Volume 2, Issue 1, January 2013
Page 201
ABSTRACT
Supply chains are fluid and are continuously adjusting to changes in supply and demand for the products they handle. To get the performance desired from supply chains requires a company to monitor and control its operations continuously. That is done through continuous measuring and monitoring their supply chain Key Performance Indicators (KPIs). Most organizations are ignoring the importance of analyzing their KPIs, and they stop at measuring and reporting them. That is not helping senior management to address root causes and understand what went wrong. We show here, how to transfer the quantitative into qualitative measures. So this paper is discussing some of supply chain KPIs, which are used in our practical case, what types of analysis are done on them, in which forums or meetings they are discussed, and the improved results. We started this concept as part of supply chain reengineering process in industrial international Fast Moving Consumer Goods (FMCG) Company by initiating Sales and Operational Planning Process (S&OP), and get use of much raw data and transforming it to meaningful analysis which helped the organization to improve their decisions. This process is being developed and implemented and after one year, results started to come.
Keywords: Supply Chain Management, Performance Measurement, Inventory Management, Factor Analysis, and Quality Data Analysis
1.
INTRODUCTION
Increasing level of competition and globalization in the world economy has major impact on looking for improving supply chains performance. Companies pay millions of dollars in order to improve their supply chain performance using process reengineering, new systems, training employees (Douglas, 2004). As a critical result, the need of using raw data and measures to better understands their supply chain performance and improves decisions taken (Douglas et. al., 2004).
A supply chain exists to support the market that it serves. To identify the performance that a supply chain should deliver, we need to measure different indicators and analyze them. Linking supply chain KPIs by the proper analysis gives better understanding of the issues and mistakes happened in history and recording these changes and root causes is very important, as learning phase (Rui and Xiaomin, 2007).
Our project was mainly to improve the performance of the supply chain by giving better service to our consumers. First our target was to perform supply chain process reengineering by applying new sales and operational process (S&OP). We started by collecting KPIs measures in order to give us better understanding to the company performance. After that we concluded that we have many issues in customer service levels, stock levels, meeting our financial targets, and we discovered many market opportunities losses. That pushed us to start investigating what are the reasons behind that. And we started to search how to understand our issues, that was the reason behind thinking of linking KPIs together and making proper analysis. When we started applying this analysis, we started understanding our issues and relations. And then we started to take better decisions. After around one year of continuous improvements and analysis, we could have better KPIs measures. This work started 2004 and continued for 4 years of continuous improvement. Our business is Fast Moving Consumers Goods (FMCG). This paper explains the whole project, and at the end we show the indicators’ results.
The paper is organized as follows. Next section is giving an introduction about supply chain and supply chain management. Section 3 gives brief about our applied S&OP with expected impact. Next, we explain KPIs we used by description and equations. Section 5 is exploring different analysis techniques we used. And lastly the results & conclusion are shown in section 6.
2.
SUPPLY
CHAIN
BRIEF
A supply chain is a network of manufactures and services providers that work together to convert and move goods from the raw materials stage through to the end user. These manufactures and service providers are linked together through physical flows, information flows, and monetary (Cecil, and Robert, 2006). Supply Chain Management is the active
Supply Chain Key Performance Indicators
Analysis
Dr. Hanaa El Sayed
Volume 2, Issue 1, January 2013
Page 202
management of supply chain activities and relationships in order to maximize customer value and achieve a sustainable competitive advantage (Roger and Kristina, 1999). It represents a conscious effort by a firm or group of firms to develop and run supply chains in the most effective and efficient ways possible (Sunil and Peter, 2007).
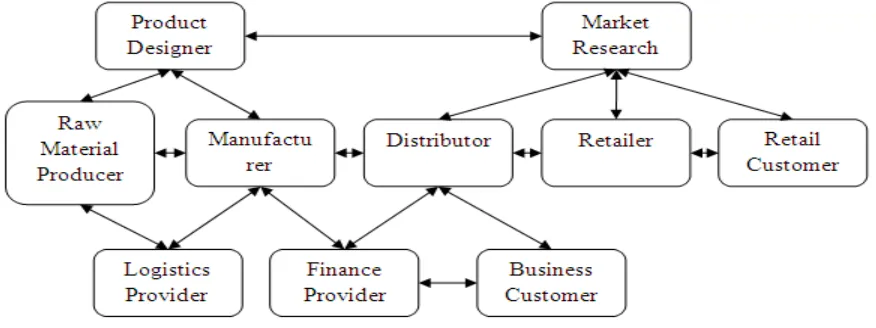
In its simplest form, a supply chain is composed of a company and the suppliers and customers of that company. This is the basic group of participants who create a simple supply chain. Extended supply chains contain three additional types of participants. First there is the supplier’s supplier or the ultimate supplier at the begging of an extended supply chain. Then there is the customer’s customer or ultimate customer at the end of an external supply chain. Finally there is a whole category of companies who are service providers to other companies in the supply chain. These are companies who supply services in logistics, finance, marketing, and information technology (Michael, 2006).
In any given supply chain there is some combination of companies who perform different functions. There are companies who producers, distributors or wholesalers, retailers, and companies or individuals who are the customers, the final consumers of a product. Supporting these companies there will be other companies that are service providers that provide a range of needed service. In the some other organizations all these entities exist in the same company even the providers such are finance (Sodhi, 2000).
FIGURE 1: Example of Extended Supply Chain
APICS defines a process as “a set of logically related tasks or activities performed to achieve a defined business outcome.” For our purposes, these outcomes can be physical, informational, or even monetary in nature. Physical outcomes might include the manufacture and delivery of goods to a customer; an informational outcome might be registering for college courses; and, finally, a monetary outcome might include payment to a supply chain partner for services rendered. Of course many business processes have elements of all three (Martin, 2001).
(Anderson, 1999) offers a similar definition, but he goes on to note that the receipt may be a downstream customer, someone within the firm (an internal customer), or even a supply chain partner. Anderson also distinguishes among three types of processes. Primary processes address the main value-added activities of an organization. They include activities such as delivering a service and manufacturing a product. These processes are considered “value-added” because some customer is willing to pay for the resulting outputs. In contrast, supports processes perform necessary, albeit not value-added, activities. An example is tuition billing. No student wants to pay tuition, and the university would rather not spend the overhead required to collect it, but the university would not be able to sustain itself for very long without monetary flows from the students. Lastly, development processes are those that improve the performance of primary and support processes (H. James, 1991). Table 1 gives examples of primary, support, and development processes.
TABLE1: Primary, support and development processes
PRIMARY PROCESSES SUPPORT PROCESSES DEVELOPMENT
PROCESSES
Providing a service Evaluating suppliers Developing new products Educating Customers Recruiting new workers Performing basic research Manufacturing Developing a sales & operational
plan (S&OP)
Training new workers
Volume 2, Issue 1, January 2013
Page 203
3.
S&OP
OVERVIEW
S&OP is the Business Planning framework within which all operational functions have visibility of plans, the results & risks. It is the right balance between Supply and demand plans to create a single achievable plan that delivers business goals. S&OP output is ONE plan generated from the Sales and Marketing and agreed by all functions and all levels(Cecil and Robert, 2006).
S&OP is a means of aligning targets, objectives and actions across functions.
Customer Development:
we can sell 200
Marketing: the promotion
will sell 400
Manufacturing:
they will only sell 150
Finance: we have budget of 300
Financial Planning Category Customer Service & Distribution Manufacturing Customer Developmen t Supplier mgmt Debtor mgmt one consensus plan
FIGURE 2: S&OP as one consensus planning process
We start our process by making the proper analysis for demand history and KPIs. Then first meeting is “Demand Planning” where we decide what our demand forecast is combined with agreed demand activities. Next we generate the according demand orders based on distributors stocks, lead times and weeks coverage. Next meeting is supply meeting, where we agree on the production plans and materials orders. Then calculating the financial reports based on previous decisions taken in these meetings, so that we can check and compare our forecasts with our targets. And then at partnership meeting we make gab analysis and discuss what our overall issues are and take decisions. Lastly, as S&OP is leaded by the company executive board, there must be meeting with the board member to present the supply chain results and decisions.
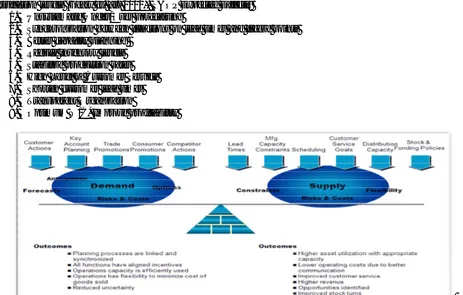
More better supply demand balance by incorporating all factors which affecting this balance, more improving customer satisfaction levels (Geary et. al., 2002). S&OP Expected Effects:
1. Unsystematic Under/Over Forecasting
2. Synchronization between functions on lead times and freeze points 3. Better capacity planning
4. Reduce inventory levels 5. Stabilize production rates 6. High Level of Customer Service 7. Shorten customer lead times 8. Transparent Organization
9. Optimum W/C, Improve profitability
Volume 2, Issue 1, January 2013
Page 204
4.
S&OP KPIs
4.1 Error
Indicates how we are forecasting from the right SKU (Stock Keeping Unit).
(1)
4.2 Bias
Indicated how much we are achieving our total plans.
(2)
4.3 CCFOT (Customer Case Fill On Time)
CCFOT is used to monitor the reliability of delivery performance to our customers. Total number of cases ordered should include all cases which the customer ordered (cases which the customer needs), regardless of their availability or the integrity of the order. Total # of cases shipped - are the cases which are shipped from the warehouse. Total number of cases delivered on-time is based on the customer’s requirements (i.e. the requested delivery date and appointment time, as agreed with/provided by the customer). If specific delivery dates are not agreed with the customer, then standard delivery lead times should be utilised. Late pick-ups by the customer will therefore impact CCFOT.
(3)
4.4 OOS (Out Of Stock)
Out Of Stock Index monitors the percentage of days the stock were less than one week plan.
(4)
4.5 TWC (Total Working Capital)
TWC is used to enable us to monitor the inventory cost and the total financial credits and debits.
(5)
5.
ANALYSIS
TYPES
Analysis, as shown in Figure 5, is categorized into two types: S&OP KPIs analysis, and analyze previous actual demand with forecast. The later is including actual demand trends analysis and forecast accuracy analysis. S&OP KPIs analysis is including root cause analysis for each KPI, and doing the proper analysis by making relationships between KPIs to conclude the proper actions.
FIGURE 4: Supply Chain KPIs Analysis Types
Volume 2, Issue 1, January 2013
Page 205
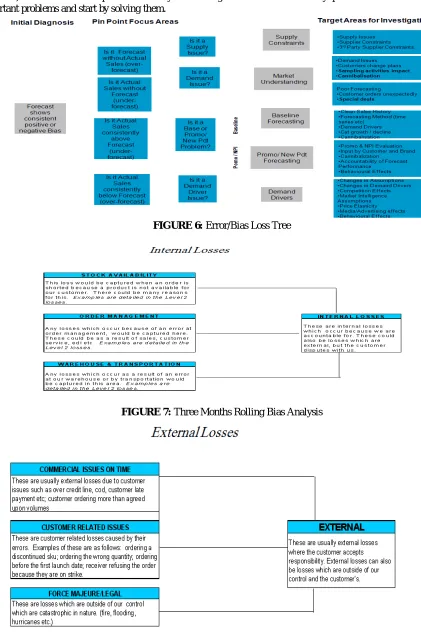
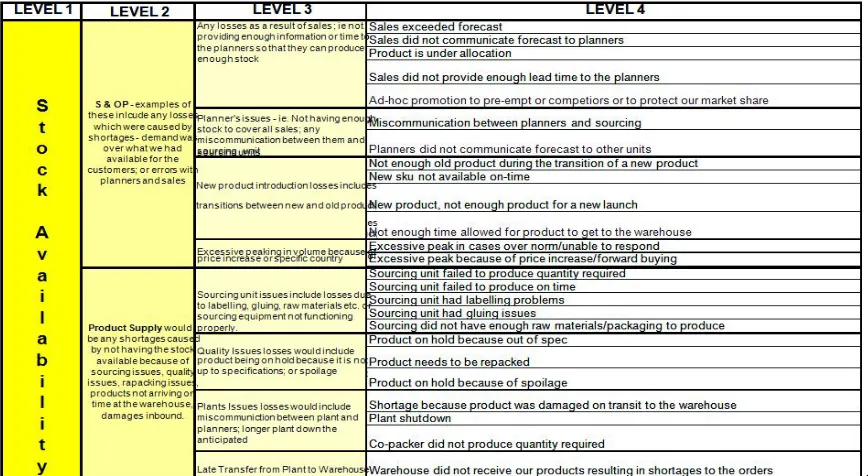
5.1 Root Cause AnalysisIn the following figures we will present some examples of root cause analysis for error bias, internal losses, external losses, and customer case fill on time. That is very important to understand the main reasons behind the low percentage measures, or the defects in performance. By monitoring these reasons for many periods we can understand the important problems and start by solving them.
FIGURE 6: Error/Bias Loss Tree
FIGURE 7: Three Months Rolling Bias Analysis
Volume 2, Issue 1, January 2013
Page 206
FIGURE 9: CCFOT Loss Tree Example5.2 Relational Analysis
FIGURE 10: Bias Stock Analysis
OOS Normalized Measure:
OOS Nor (OOS Normalized) is a measure which is calculated weighted by value and is calculated as follows:
(6)
Volume 2, Issue 1, January 2013
Page 207
FIGURE 11: OOS NorWhen plotting this chart, we can conclude that PRODUCT8 has the largest effect on the total losses over the company and we have to focus on the reasons behind that and ensure that it will not be repeated again
FIGURE 12: OOS Nor Factor Analysis Effect
If we could eliminate the total two big PRODUCTS which are the most affecting the total company losses as you see we can improve the total OOS
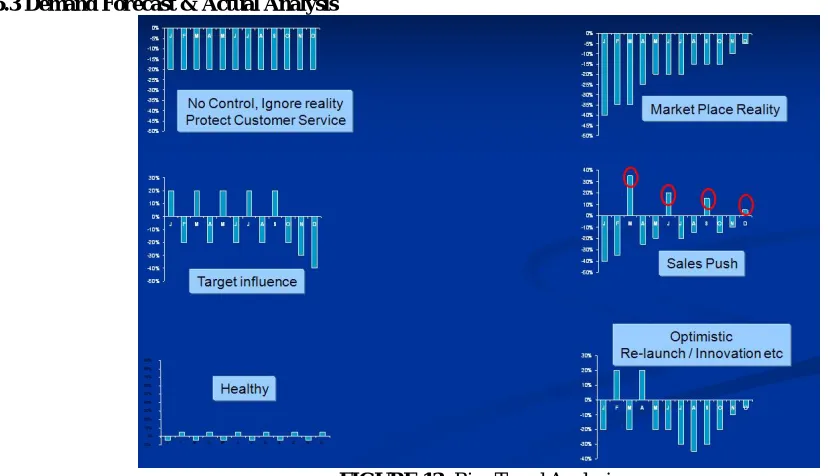
5.3 Demand Forecast & Actual Analysis
Volume 2, Issue 1, January 2013
Page 208
Bias indicates how healthy the business planning process is.
FIGURE 14: Financial & Volume Bias Analysis
Forecast bias is an indicator of the health of the business plan process. Bias is frequently heavily influenced by board behaviour. Analysis of Volume & Financial forecast bias seems to indicate that the business is focussing on NPS targets rather than volume target. A positive forecast bias indicates over-forecasting in the volume
5.3.1. Three Months Rolling Analysis
The objective of this exercise is to check the products, which have three consecutive months over forecasting or have three consecutive months under forecasting. These products are dealt differently as the board has to enforce change the forecast for these products for the coming month. The change is done by changing the direction of the bias in order to correct it.
FIGURE 15: Three Months Rolling Bias Analysis FIGURE 16: Three Months Rolling Bias Analysis Applying this type of analysis monthly basis made significant improvement in the Bias trends
Volume 2, Issue 1, January 2013
Page 209
5.3.2. when should we discuss KPIs Analysis?It is very important to discuss KPIs in every meeting, because it is believed that in order to take future decisions we have to understand what went wrong in previous decisions to avoid repeating doing mistakes.
6.
RESULTS
&
CONCLUSIONS
FIGURE 18: Bias Improvement FIGURE 19: Error Improvement
FIGURE 20: OOS Improvement FIGURE 21: CCFOT Improvement
Performing KPIs analysis is very critical in any organization to better understanding their performance and previous decisions accuracy. Unfortunately not many organizations understand its importance and ignore performing this step. As shown from Figures 19-22 improvement in KPIs due to applying relational analysis and transforming quantitative measure to qualitative indicators which makes senior management understand previous decision taken and how accurate it was, and hence improving future decisions and hence performance results.
REFERENCES
[1] Book - Bjorn Anderson, Business Process Improvement Toolbox, 1st Edition, ASQ Quality Press Publications, 1999, ISBN: 0-87389-438-3.
[2] Book - Cecil C. Bozarth, Robert B. Handfield. Introduction to operations and supply chain management, 1st Edition. Pearson Education, 2006, Inc. ISBN: 0-13-944620.
[3] Book - Douglas M. Lambert, The Eight Essential Supply Chain Management Processes, Supply Chain Management Review, 2004, pp. 18-26.
[4] Scholarly Journal - Douglas M. Lambert, Martha C. Cooper and Janus D. Pagh, Supply Chain [5] Scholarly Journal - Management: Implementation Issues and Research Opportunities, The International Journal of Logistics Management, 9 (2), 1998, pp. 1-18.
[6] Scholarly Journal - Geary, Steve, Paul Childerhouse, and Denis Towill, Uncertainty and the Seamless Supply Chain, Supply Chain Management Review, 2002, pp. 52-61.
[7] Scholarly Journal - H. James Harrington, Business Process Improvement: The Breakthrough Strategy for Total Quality, Productivity, and Cometitiveness. New York:McGraw-Hill, 1991, ISBN: 0-07-026768-5.
[8] Scholarly Journal - Martin, Andre J., Capacity Planning: The Antidote to Supply Chain Constraints, Supply Chain Management Review, 2001, pp. 62-67.
[9] Book - Michael Hugos, Essentials of Supply Chain Management, 2nd Edition. John Wiley & Sons, Inc, 2006, ISBN: 0-471-77634-3.
[10] Scholarly Journal - Roger D. Blackwell, and Kristina Blackwell, The Century of the Consumer: Converting Supply Chains into Demand Chains, Supply Chain Management Review, 1999, pp. 22-32.
Volume 2, Issue 1, January 2013
Page 210
[12] Scholarly Journal - Sodhi, Mohan, Getting the Most from Planning Technologies, Supply Chain Management Review, Special Global Supplement, 2000, pp. 19-23.