healthy blood donors using data mining
Maryam Ashoori1, Somaye Alizade2, Hoda Sadat Hosseiny Eivary3,
Saber Rastad4, Somaye Sadat Hossieny Eivary5
Abstract
Urgent need for blood and lack of alternative to replace it, necessitate the presence of a system for predicting continuous behavior of healthy blood donors in blood transfusion organization. Predicting donors’ behavior aims to determine blood unit number and blood groups for providing future contingency blood bank; and also restraining the dangerous bullwhip effect on blood supply chain. This cross-sectional study was conducted by using census. The study population consisted of blood donors’ data, which was collected from blood transfusion organization. Clementine software version 12.0 was used to analyze the data. Four different data mining algorithms including a decision tree algorithm that it used as data mining technique (C5.0), C&R Tree, CHAID and QUEST were employed for analyzing the data and knowledge. Results from data mining were respectively: 57.49%, 55.9%, 55.56% and 55.34%. High accuracy of C5.0 indicates the better performance for this algorithm. According to measurement accuracy of training and test data, the reliability score for algorithm of C5.0 was 0.981. Clustering method was used to verify the accuracy of the best model. C5.0 algorithm, distributs the continuous participants' blood among clusters based on variables such as age, gender and marital status by using clustering. Repeated participantss were assigned to a cluster and the first time participantss were assigned between two clusters based on gender or marital status variables. Using this model helps to predict contingency blood bank faster with more accuracy.
Keywords: Blood Donors, Data Mining, Decision Tree Journal of Research & Health
Social Development & Health Promotion Research Center
Vol.5, No.2, Summer 2015 Pages: 141-148 Original Article
1. Correspondence to: MSc in
E-Commerce, Information Technology Engineering Department, Faculty of Industrial Engineering, Khaje Nasir Toosi University of Technology, Tehran, Iran Tel/Fax: +98 21 8406 3340
Email: [email protected] 2. PhD in Industrial Engineering, Assistant Professor in Information Technology Engineering Department, Faculty of Industrial Engineering, Khaje Nasir Toosi University of Technology, Tehran, Iran
3. MSc in Artificial Intelligence, Ferdos
Branch, Islamic Azad University, Ferdos, Iran
4. MSc in E-Commerce, Computer and Information Technology Engineering Department, Shiraz University, Shiraz, Iran
5. General Physician, Faculty of Medical and Physician, Golestan University of Medical Science, Golestan, Iran
Received: 4 Jun 2014 Accepted: 22 Sep 2014
How to cite this article: Ashoori M, Alizade S, Hosseiny Eivary HS, Rastad S, Hossieny Eivary SS. A model to predict the sequential behavior of healthy blood donors using data mining; J Research Health2015; 5(2): 141-148.
Introduction
Nowadays computer and information technology have influenced databases of medicine and health by means of computer-assisted tomography [1]. However the volume of electronicallystored medical data hasbeen increaseddaily. But the hugeset of raw data is not applicable by itself. Data must be analyzed and converted into information or knowledge to make sense [2]. Although the availability of
handemphasizes on data mining as an important tool for medicine and health data [2]. Blood donation and its transfusion service is a business in the health field [1].
Blood is always in great demand and it cannot be manufactured since it can only come from generous donors. This reveals the importance of lookingfor blood and providing conditions for donating blood [5]. Blood donation and its transfusion service is an indispensable part of contemporary medicine and healthcare [6]. Blood donation service is a series of interdependent operations in blood transfusion organization including donor registration, donors’ health evaluation, blood collection, blood screening, supply production, inventory management, and blood dissemination[1]. If there is no restriction at donor's health evaluation phase, the phase of blood collection will be accomplished [7]. The donated blood must be used immediately; otherwise it will be corrupted [8]. Therefore, blood storing for a long time is impossible, and it is necessary to have an organized approach in order to predict thecurrent blood donors'future behavior. Because we need to have access to healthy donorsfor compensating required blood supply in times of crisis [8]. The growing demand for blood bank necessitates discovering the effectiveness of all stored data as well. Hence data mining ofblood bank will be helpful as an important tool which analyzes data collected by blood banks [9].
In the current study we used four classification algorithms of data mining methods from the category of prediction approaches named Chi-Squared Automatic Interaction Detector (CHAID), Classification and Regression Tree or CART (C&R Tree), a decision tree algorithm that it used as data mining technique (C5.0) and Quick Unbiased and Efficient Statistical Tree (QUEST) to predict healthy blood donors'future behavior. Then we employed Clementine software to introduce a more efficient algorithm for prediction model. By identifying the most efficient algorithms of detectionand trying to increase the efficiency and accuracy of them we can make automated systems with high reliability which detect complex pattern and
predict future trends for dealing with various kinds of diseases [2]. Finally we used clustering approach on the results of classification to verify the prediction results.
The overall aim of this research wasto discover the hidden knowledge in the existed data of a blood transfusion center. Hence we need a model to identify stable healthy blood donors and predict their future behavior of blood donating. In addition, identification of regular donors enables the blood banks and volunteer organizations to systematically plan for organizing the blood donation camps in an efficient way. Current studycan provide a good vision of blood consumption for authorities and make them able to predict theblood donors'future behavior.
Method
This cross-sectional study was conducted through census and included all blood donors (9239 participant) in some months from2013 to 2014 in blood transfusion center of Birjand City. The study population consisted of Data from blood transfusion center of Birjand (North East Iran). The content of records was validated by the organization authorities as well.In the step of data preprocessing, the records with missing value were removed according to experts' opinion. So the number of donors under study was reduced to 9231. Researcher collected these data directly from Birjand blood transfusion center. Advisors and expertsapproved the validity of data collection method. Therefore, the data set included 9231 participants with 6 attributes which had been collected in December 2013 and February, March, April and May 2014. Clementine12.0 has been employed to analyze data and implement the algorithms of data mining. Four algorithms which differ from rule inference algorithms, named CHAID, C&R Tree, C5.0 and QUEST were applied on the data and then the accuracy of the generated models was verified.
This aim would be achieved by dividing the participants blood into two subgroups (70 percent for training and 30 percent for test), and implementing the algorithms on the data. Then the generated models by CHAID, C&R Tree, C.50 and QUEST wouldbe evaluated. It is clear that the model efficiency cannot be judged before determining the model accuracy. Therefore, at first the accuracy of the generated models was evaluated and then the root causes of model accuracy reduction were detected. By measuring theaccuracy of trainingand test data, the reliability score of 0.981 was achieved. The next step was to verify the accuracy of the best generated model by using clustering approach. Clustering is an unsupervised learning method in whichthe concept of output field doesnot exist [14]. To verify the accuracy of the best generated model, we implemented K-Means clustering algorithm and analyzed its output. We implemented the clustering algorithm for 2-7 clusters on the most valid generated model. Then according to equation (1), we computed the optimal number of clusters on the modelby using Dunn index. The purpose of taking advantages of Dunn index is to maximize the intra-cluster distance while minimizing the inter-cluster distance [17].
(1)
d (ci,cj ) And diam(ci) were calculated according to the equations (2) and (3) [17].
(2)
(3) Results
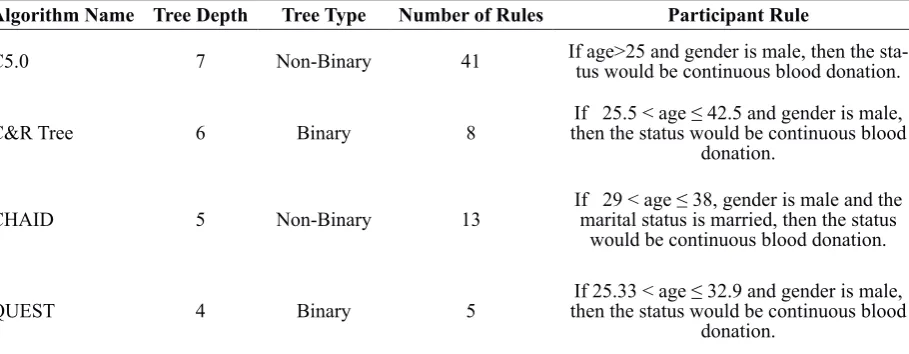
The rules can be inferred from generated decision trees. Generated results by C5.0 algorithm included three rule sets for the first time, repeated and continuous blood donation. Also generated rules by CHAID, C&R Tree and QUEST algorithms respectively included 3, 2 and 2 rule sets for the first time, repeated and continuous blood donation statuses. Table 1 shows a comprehensive description for decision trees generated by the mentioned algorithms.
Now to identify the best prediction model for blood donors' future behavior, it is required to verify the accuracy rate of the generated models. The accuracy rate of a classification method on the training data is the percentage of the training data set which is correctly classified through the applied method. In the literature of pattern recognition, this special index is called identification rate which reflects the identification quality of different categoriescategory category participants. The value of accuracy index was calculated according
to equation (4). (4)
TP: The true number of positive labeled data, TN: The true number of negative labeled data, Pos: Total number of positive labeled data, Neg: Total number of negative labeled data [17].
The accuracy of generated models from
Table 1Results from implementation of C5.0, C&R Tree, CHAID and QUEST algorithms
Algorithm Name Tree Depth Tree Type Number of Rules Participant Rule
C5.0 7 Non-Binary 41 If age>25 and gender is male, then the sta-tus would be continuous blood donation.
C&R Tree 6 Binary 8 then the status would be continuous blood If 25.5 < age ≤ 42.5 and gender is male, donation.
CHAID 5 Non-Binary 13 If 29 < age ≤ 38, gender is marital status is married, then the status male and the would be continuous blood donation.
implementation of CAID, C&R Tree, C5.0 and QUEST algorithms on training and test datasets are provided in table 2.The highest accuracy value of the C5.0 algorithm 5.0 on training and test datasets, reflects the better performance of the algorithm on theunder investigation dataset. The decision tree from C5.0 algorithm includedmore details due toits great depth, and thus it generated more rules. Large number of rules which creates more consistency between tree and the participants makes the model more valid.
However, the results of model accuracy represent the lack of correct classification in placing some data properly. In this step, to find the effective root cause of model validity reduction, the predicted values should be compared with the actual values of training data. Table 3 shows the accuracy rate of predicted values for blood donation situation in generated models.
Table2 The accuracy rate of models on training and test datasets
Algorithm Name Accuracy Training Set Test Set
C5.0 57.49 % 56.4 %
C&R Tree 55.9 % 56.4 %
CHAID 55.56 % 55.61 %
QUEST 55.34 % 56.11 %
Table3 The accuracy rate of the predicted values for blood donation situation
Algorithm Name
Blood Donation Situation
Accuracy Rate of Predicted Value Versus Actual Value
C5.0
First time 18.23 % Repeated 2.89 % Continuous 95.41 %
C&R Tree
First time 16.33 % Repeated 2.62 % Continuous 93.42 %
CHAID
First time 6.90 %
Repeated 0 %
Continuous 97.63 %
QUEST
First time 11.89 %
Repeated 0 %
Continuous 97.63 %
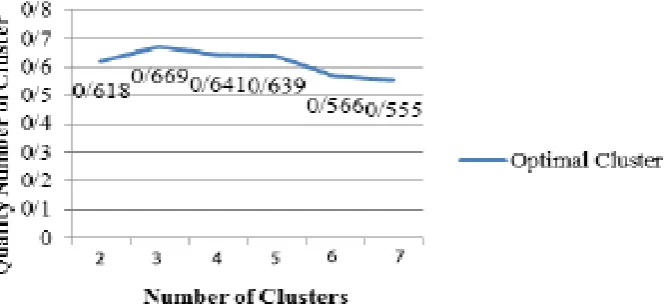
Also as shown in chart 1, results from clustering and Dunn index value calculation for generated
model by C5.0 algorithm, indicated that the optimal number for clusters equals to 3. Since the bigger value for Dunn index implies that the model is better, the number of clusters that make the index value bigger is the optimal number of clusters [17].
The output of clustering on C5.0 tree results showed that the first cluster contained 4513 participants and 98.96% of them represented the continuous blood donation, 1% represented the first time blood donation and 0.04% indicatedthe repeated blood donation. All donors were male and married. The second cluster contained1531 participants in whom 77.27% represented continuous blood donation, 20.77% indicated the first time blood donation and the remaining (1.96%) demonstrated the repeated blood donation status. 91.57% of the second cluster participants were male and 99.93% were single. The third cluster contained 382 participants in whom 65.45% indicated continuous blood donation, 21.47% represented the first time blood donation and 13.09% demonstrated the repeated blood donation status. All were female and 86.13% were married.
Discussion
value compared with that of actual value for continuous blood donation situation in all four algorithms, demonstrated that the participants harmonized with this situation, have been placed properly in generated decision tree. It indicates the high confidence in putting donors in proper places in this situation. According to table 3, generally the highest accuracy average of predicted value compared with that of actual value belongs to C5.0 algorithm. Long depth and large number of generated rules by this algorithm in decision tree improves its performance on examined data set. Therefore the overall accuracy of generated model by C5.0 algorithm is more than the accuracy of generated models by other algorithms.
The results of clustering on C5.0 tree for describing the situation of predicted blood donation, showed that a high percentage of clusters participants had a regular blood donation status. The accuracy of predicted value versus real value was 95.41% for regular blood donation, as shown in table 3. The high validity of prediction, promotes the overall validity of the model. The participants with this situation have been distributed in 3 clusters, but the most of these participants have been placed in the first cluster. The important factors affecting the distribution of participants in three clusters in this situation are age, gender and marital status. The results of Bayesian network implementation on existing data showed that age, a predictor by coefficient of 0.4, marital status, a predictor by coefficient of 0.3 and gender, a predictor by coefficient of
0.25, are effective in network generating. This indicates the importance of age, marital status and gender in clustering and distributing participants with high accuracy for t predicted value in mentioned three mentioned clusters. Respectively 77.27% and 65.45% of the second and the third clusters include participants with regular blood donation status. The reason of having small number of participants with regular blood donation status is the distribution of participants with repeated and the first time blood donation statuses in these two clusters. As shown in table 3, the accuracy of predicted value against real value in the repeated and the first time blood donation were respectively 2.89 and 18.23. The greater validity of predicted value than the real value for the first time blood donation against repeated blood donation caused the distribution of participants with these statuses in the second and third clusters. Important factors effecting the distribution of participants with the first time blood donation status are gender and marital status.
The third cluster mainly included participants with repeated blood donation and these participants have not been distributed in other clusters. So participants with the lowest accuracy value which reduce the overall validity of the model were concentrated in the third cluster. Participants with the greatest model accuracy value which increase the overall validity of the model were distributed in the first, second and third clusters. Participants with moderate status have lower
predicted value accuracy than real value. They reduce the overall validity of the model and have been distributed in the second and third clusters. The reason of placing some of these participants in the third cluster is their similarity to third cluster in reducing the overall validity of the model and their low predicted validity value.
The aims of blood donor behavior prediction are widely: helping doctors to predict adequate blood storage, curbing the side effects of shortage in the blood supply in times of crisis and reducing the number of victims in deadly disasters. The findings of this paper showed that the generated decision tree by C5.0 algorithm has a higher accuracy and good performance on the research data set so this algorithm is more suitable for prediction. The results of clustering on the best model indicated that participants with the lowest validity value who reduced overall accuracy of the model were placed in the third cluster. Participants with the highest validity value were distributed in all three clusters, and participants that had a status between two mentioned states were distributed in the second and third clusters. These participants were distributed between the second and third clusters for which the predicted value validity is lower than their real value so they were distributed in the clusters which reduce the overall validity of the model. This is why some of the participants with moderate state were placed in the third cluster. The main variables on which the distribution was based were age, gender and marital status. Reviewing similar studies on the application of data mining techniques in the field of blood donation, indicated that in nonnative studies the prediction of blood donor behavior has been neglected so far. For instance, Mostafa showed that potential blood donors and non-donors are different in identifiable characteristics and behavioral patterns [10]. Two other researchers classified blood donors based on blood donation patterns to determine voluntary blood donation [11]. In other studies C&R Tree decision tree was applied to classify regular volunteer blood donors [18] and J48 algorithm was applied
to cluster and classify the number of blood donors on the basis of their age and blood groups [19].
Lee and Cheng proposed a method to improve the performance of blood donation in order to determine the differences between blood donors' behavior using the algorithms of classification and clustering [20]. Bravo et al used the classification algorithms of data mining to improve security of blood donation process [21]. Furthermore, in native studies data mining has been applied to diagnose hyperlipidemia [12], neural network algorithms, Adaptive Nero Fuzzy Inference System and linear discriminant analysis algorithm to classify blood donors and identify volunteer individuals to donate blood in the future [3]. Two other native researchers have clustered blood donors to describe their future behavior as well [22].
According to Liao et al. and prior studies in the field of data mining between 2000 and 2011 AD, out of 188 articles, 17 articles have addressed the issue of classification and 9 articles have been devoted to clustering. Thus considering the application of the decision tree (a classification technique) in previous studies as the method of prediction due to its ability in interpretation and understanding, this technique was chosen as the method of prediction.. Also to identify the best algorithm, applicable algorithms were tested considering the given goal (the prediction of blood donation status).
Conclusion
units and blood groups of the future donated blood. One limitation of the current research is the symbolic type of the output which restricts applying more prediction algorithms. In addition a small number of attributes to be selected as a subset of characteristics is another restriction to achieve the algorithms with high performance. Applying attributes set such as hemoglobin, minimum blood pressure, maximum blood pressure, temperature, blood pressure and pulse could lead to a more accurate prediction model. On the other hand, using larger statistical community could be a verification to generalize the proposed model. It is also possible to propose some models to predict blood pressure, required drugs for high and low pressure and so on. Any of the mentioned issues could be the subject of a new article and would make the present study more comprehensive.
Acknowledgements
It is necessary to thank personnel working at blood transfusion organization of Birjand for their cooperation in conducting this research. Undoubtedly the aim of this project was not achieved without the assistance of this organization staffs.
Contributions
Study design: MA, HSHE
Data collection and analysis: MA, HSHE, SSHE
Manuscript preparation: MA, SA, SR
Conflict of Interest
"The authors declare that they have no competing interests."
References
1- Li B.N, Dong M.C. Banking on Blood. IET Computing & Control Engineering, August/September 2006. 2- Ashoori M, Naji Moghaddam V, Alizadeh S, Safi M. Classification and clustering algorithm application for prediction of tablet numbers: case study diabetes Disease. Health Information Management1392; 10(5): 739-749. [In Persian]
3- Rashid Mehrabadi E, Pedram MM. Blood donors classification and identifying future donors .The fourth iran data mining conference, Sharif University of
Technology, Tehran, Iran, 2010. [In Persian]
4- Ramachandran P, Girija N, Bhuvaneswari T. Classifying blood donors using data mining techniques.
IJCSET2011; 1 (1): 10-13.
5- Rahman MS, Akter KH, Hossain SH, Basak A, Ahmed SI. Smart blood query: a novel mobile phone based privacy-aware blood donor recruitment and management system for developing regions. IEEE workshops of international conference on advanced information networking and applications (WAINA) 2011. 22-25 March 2011: 544-48.
6- Li BN, Dong MC, Chao S. On decision making support in blood bank information systems. Expert
Systems with Applications Journal2008; 34: 1522–32.
7- Testik MC, Ozkaya BY, Aksu S, Ozcebe OI. Discovering blood donor arrival patterns using data mining: a method to investigate service quality at blood centers. Journal of Medical Systems2012; 36(2): 579-94.
8- Darwiche M, Feuilloy M, Bousaleh GH, Schang D. Prediction of blood transfusion donation. 2010 Fourth International Conference on Research Challenges in Information Science (RCIS) 2010: 51-6.
9- Bhardwaj A, Sharma A, Shrivastava V. Data mining techniques and their implementation in blood bank sector –a review. IJERA2012; 2 (4): 1303-09.
10- Mostafa MM. Profiling blood donors in Egypt: a neural network analysis. Expert Systems with Applications Journal2009; 36: 5031-38.
11- Sundaram S, Santhanamt TA. Comparison of blood
donor classification data mining models. JATIT2011;
30 (2): 98-101.
12- Okhovvat M, MinaeeBidgoli B, Okhovvat MR. Comparison methods based on data mining in detection of lipid disorders. 3rd Iran data mining Conference (1388/11/26), Tehran: Iran datamining, 1388. [In Persian]
13- SPSS Inc . Modeling techniques in Clementine. Chapter11; 2003. Available at URL:https://fhss.byu. edu/SPSS%20Modeler/Chapter%2011.pdf.
14- SPSS Inc. Rule Induction. Chapter12; 2003. Available at URL: https://fhss.byu.edu/SPSS%20 Modeler/Chapter%2012.pdf.
15- Khalilinezhad M, MinaeeBidgoli B. Clinical data mining. 3rd Iran data mining conference (1388/11/26), Tehran: Iran data mining, 1388. [In Persian]
16- Tan P.N, Steinbach M, Kumar V. Introduction to data mining. USA: addison-wesley longman; 2005. 17- Ghazanfari M, Alizadeh S, Teymourpour B. Data mining and knowledge discovery. Tehran: publish center of Iran University of Science & Technology; 2008. [In Persian]
18- Santhanam T, Sundaram S. Application of CART
algorithm in blood donors classification. Journal of
Computer Science2010; 6 (5): 548-52.
20- Lee WC, Cheng BW. An intelligent system for improving performance of blood donation. Journal of Quality2011; 18(2): 173-85.
21- Bravo M, Whitaker B, Mayer R, Khaire S. Data mining to improve safety of blood donation process.
47th Hawaii International Conference on System Science2014. 6-9 Jan 2014:789-95.
22- Ashoori M, Taheri Z. Using clustering methods for identifying blood donors behavior. 5th Iranian Conference on Electrical and Electronic Engineering
2013: 4055-57. [In Persian]
23- Liao SH, Chu PH, Hsiao PY. Data mining techniques and applications – A decade review from 2000 to 2011.