I
I
I
N
N
N
T
T
T
E
E
E
R
R
R
N
N
N
A
A
A
T
T
T
I
I
I
O
O
O
N
N
N
A
A
A
L
L
L
J
J
J
O
O
O
U
U
U
R
R
R
N
N
N
A
A
A
L
L
L
O
O
O
F
F
F
R
R
R
E
E
E
S
S
S
E
E
E
A
A
A
R
R
R
C
C
C
H
H
H
I
I
I
N
N
N
C
C
C
O
O
O
M
M
M
M
M
M
E
E
E
R
R
R
C
C
C
E
E
E
,
,
,
I
I
I
T
T
T
A
A
A
N
N
N
D
D
D
M
M
M
A
A
A
N
N
N
A
A
A
G
G
G
E
E
E
M
M
M
E
E
E
N
N
N
T
T
T
C
C
C
CONTENTS
ONTENTS
ONTENTS
ONTENTS
Sr.
No.
TITLE & NAME OF THE AUTHOR (S)
Page No.
1
.
IMPACT OF EMPLOYEES’ EDUCATING ON PRODUCTIVITY IN BANKING SECTORHAMID REZA QASEMI
1
2
.
ASSESSING THE EFFECTIVENESS OF FRONTLINE MANAGERS IN PUBLIC SECTOR COLLEGES OF PAKISTANANSAR MAHMOOD & DR. WAHEED AKHTER
6
3
.
DOES EMPOWERMENT MODERATE OF THE RELATIONSHIP BETWEEN PERCEIVED OVERQUALIFICATION AND JOB ATTITUDES?KENGATHARAN. N
14
4
.
LINKING THE ‘BIG FIVE’ PERSONALITY DOMAINS TO ORGANIZATIONAL COMMITMENTJYOTI KUMAR CHANDEL, DR. SUJEET KUMAR SHARMA & DR. S.P. BANSAL
19
5
.
A STUDY ON DEVELOPMENT AND PROCESSING IN MYSORE MILK UNION LIMITEDDR. HARISH.M
25
6
.
USE OF INTERNET FOR ELECTRONIC GADGETS PURCHASING – IMPACT OF CIRCUMSTANTIAL ELEMENTSASMATARA KHAN & DR. MOHD. ZAFAR SHAIKH
31
7
.
QUALITY MANAGEMENT INITIATIVES AND COMPETITIVENESS - CASE STUDIES ON SMALL AND MEDIUM ENTERPRISESDR. S. R. ASHOK, DR. C. S. VENKATESHA & DR. B. T. ACHYUTHA
37
8
.
RELATIONSHIP BETWEEN EMPLOYEE ENGAGEMENT AND COMMITMENT: A STUDY AT IVRCLSURESH KANDULAPATI & DR. G. MANCHALA
44
9
.
PERCEPTION AND RECEPTIVITY OF BRANDING BY BANKS BY CUSTOMERS OF SMALL SCALE INDUSTRIES IN BANGALORE: AN EMPIRICAL EVIDENCEDR. S. JOHN MANOHAR & N. S. RAVINDRA
48
10
.
EXPECTATIONS AND PERCEPTIONS OF STUDENTS IN ENGINEERING EDUCATION - A STUDYDR. KANAGALURU SAI KUMAR
55
11
.
CONSUMER BEHAVIORAL PATTERNS OF PASSENGER CARSBALAKRISHNAN MENON & DR. JAGATHY RAJ V. P.
61
12
.
REPATRIATION PROGRAM AS A PROCESS FOR RETAINING REPATRIATES - ISSUES SURROUNDING INTERNATIONAL HUMAN RESOURCEB. R. SANTOSH & DR. KRISHNAVENI MUTHIAH
69
13
.
ROLE OF TRAINERS IN IMPROVING TRAINING EFFECTIVENESS: A CASE STUDY OF INSURANCE SECTOR IN ARID INDIARICHA DIXIT & DR. HARSH PUROHIT
73
14
.
A STUDY ON WORK INTERFERENCE WITH FAMILY (WIF) AND FAMILY INTERFERENCE WITH WORK (FIW) AMONG MARRIED FEMALE MANAGEMENT FACULTIESSMRUTI R PATRE & DR. ANANT DESHMUKH
78
15
.
WORK-LIFE BALANCE: A CROSS SECTIONAL STUDY OF BANKING & INSURANCE SECTORPRERNA PATWA
85
16
.
THE CHALLENGING JOB DESIGN OF GLOBAL MANAGERPAYAL JOHARI
92
17
.
CULTURAL INTELLIGENCE (CQ): LEVERAGING EFFECTIVENESS OF INDIAN BPO SECTORSHIKHA BHARDWAJ
95
18
.
GLOBAL FOREX MARKET VIS-A-VIS INDIAN CURRENCY– A STUDYT. CHANDRABAI, SRIVALLI. J & T. BHARATHI
100
19
.
RANKING MFIS IN INDIA: USING TOPSISSANTANU DUTTA & PINKY DUTTA
103
20
.
SERVICE QUALITY EVALUATION: AN APPLICATION OF THE SERVQUAL MODEL WITH SPECIAL REFERENCE TO TWO WHEELER SERVICE STATIONS IN NANGAL DAMABHAY TIWARI & NITIN CHAUDHARY
108
21
.
A STUDY OF PROBLEMS & PROSPECTS OF INTERNET RETAILING IN INDIADR. HEMANT J. KATOLE
114
22
.
ORGANISATIONAL OUTCOMES OF EFFECTIVE RELATIONSHIP MARKETING IN INDIAN INSURANCE COMPANIESDR. M. DHANABHAKYAM & K. VIMALADEVI
117
23
.
E – GOVERNANCE: AN INITIATIVE TO PUBLIC DEVELOPMENT IN INDIA WITH SPECIAL REFERENCE TO ODISHADEVI PRASAD DASH
121
24
.
TO STUDY THE FACTORS AFFECTING JOB SATISFACTION LEVEL IN THE SELECTED BPO COMPANIES IN NCR REGIONSURENDER SARIN & VIJENDER PAL SAINI
125
25
.
JOB SATISFACTION AMONG EMPLOYEES IN SMALL SCALE INDUSTRIES, VISAKHAPATNAMDR. M. RAMESH
130
INTERNATIONAL JOURNAL OF RESEARCH IN COMMERCE, IT & MANAGEMENT
CHIEF PATRON
CHIEF PATRON
CHIEF PATRON
CHIEF PATRON
PROF. K. K. AGGARWAL
Chancellor, Lingaya’s University, Delhi
Founder Vice-Chancellor, Guru Gobind Singh Indraprastha University, Delhi
Ex. Pro Vice-Chancellor, Guru Jambheshwar University, Hisar
PATRO
PATRO
PATRO
PATRON
N
N
N
SH. RAM BHAJAN AGGARWAL
Ex. State Minister for Home & Tourism, Government of Haryana
Vice-President, Dadri Education Society, Charkhi Dadri
President, Chinar Syntex Ltd. (Textile Mills), Bhiwani
CO
CO
CO
CO----ORDINATOR
ORDINATOR
ORDINATOR
ORDINATOR
AMITA
Faculty, E.C.C., Safidon, Jind
ADVISOR
ADVISOR
ADVISOR
ADVISORSSSS
PROF. M. S. SENAM RAJU
Director A. C. D., School of Management Studies, I.G.N.O.U., New Delhi
PROF. M. N. SHARMA
Chairman, M.B.A., Haryana College of Technology & Management, Kaithal
PROF. S. L. MAHANDRU
Principal (Retd.), Maharaja Agrasen College, Jagadhri
EDITOR
EDITOR
EDITOR
EDITOR
PROF. R. K. SHARMA
Dean (Academics), Tecnia Institute of Advanced Studies, Delhi
CO
CO
CO
CO----EDITOR
EDITOR
EDITOR
EDITOR
DR. BHAVET
Faculty, M. M. Institute of Management, Maharishi Markandeshwar University, Mullana, Ambala, Haryana
EDITORIAL ADVISORY BOARD
EDITORIAL ADVISORY BOARD
EDITORIAL ADVISORY BOARD
EDITORIAL ADVISORY BOARD
DR. AMBIKA ZUTSHI
Faculty, School of Management & Marketing, Deakin University, Australia
DR. VIVEK NATRAJAN
Faculty, Lomar University, U.S.A.
DR. RAJESH MODI
Faculty, Yanbu Industrial College, Kingdom of Saudi Arabia
PROF. SANJIV MITTAL
University School of Management Studies, Guru Gobind Singh I. P. University, Delhi
PROF. ANIL K. SAINI
Chairperson (CRC), Guru Gobind Singh I. P. University, Delhi
DR. KULBHUSHAN CHANDEL
Reader, Himachal Pradesh University, Shimla
DR. TEJINDER SHARMA
DR. SAMBHAVNA
Faculty, I.I.T.M., Delhi
DR. MOHENDER KUMAR GUPTA
Associate Professor, P. J. L. N. Government College, Faridabad
DR. SHIVAKUMAR DEENE
Asst. Professor, Government F. G. College Chitguppa, Bidar, Karnataka
MOHITA
Faculty, Yamuna Institute of Engineering & Technology, Village Gadholi, P. O. Gadhola, Yamunanagar
ASSOCIATE EDITORS
ASSOCIATE EDITORS
ASSOCIATE EDITORS
ASSOCIATE EDITORS
PROF. NAWAB ALI KHAN
Department of Commerce, Aligarh Muslim University, Aligarh, U.P.
PROF. ABHAY BANSAL
Head, Department of Information Technology, Amity School of Engineering & Technology, Amity University, Noida
PROF. A. SURYANARAYANA
Department of Business Management, Osmania University, Hyderabad
DR. ASHOK KUMAR
Head, Department of Electronics, D. A. V. College (Lahore), Ambala City
DR. JATINDERKUMAR R. SAINI
Head, Department of Computer Science, S. P. College of Engineering, Visnagar, Mehsana, Gujrat
DR. V. SELVAM
Divisional Leader – Commerce SSL, VIT University, Vellore
DR. PARDEEP AHLAWAT
Reader, Institute of Management Studies & Research, Maharshi Dayanand University, Rohtak
S. TABASSUM SULTANA
Asst. Professor, Department of Business Management, Matrusri Institute of P.G. Studies, Hyderabad
TECHNICAL ADVISOR
TECHNICAL ADVISOR
TECHNICAL ADVISOR
TECHNICAL ADVISOR
AMITA
Faculty, E.C.C., Safidon, Jind
MOHITA
Faculty, Yamuna Institute of Engineering & Technology, Village Gadholi, P. O. Gadhola, Yamunanagar
FINANCIAL ADVISORS
FINANCIAL ADVISORS
FINANCIAL ADVISORS
FINANCIAL ADVISORS
DICKIN GOYAL
Advocate & Tax Adviser, Panchkula
NEENA
Investment Consultant, Chambaghat, Solan, Himachal Pradesh
LEGAL ADVISORS
LEGAL ADVISORS
LEGAL ADVISORS
LEGAL ADVISORS
JITENDER S. CHAHAL
Advocate, Punjab & Haryana High Court, Chandigarh U.T.
CHANDER BHUSHAN SHARMA
Advocate & Consultant, District Courts, Yamunanagar at Jagadhri
SUPERINTENDENT
SUPERINTENDENT
SUPERINTENDENT
INTERNATIONAL JOURNAL OF RESEARCH IN COMMERCE, IT & MANAGEMENT
CALL FOR MANUSCRIPTS
CALL FOR MANUSCRIPTS
CALL FOR MANUSCRIPTS
CALL FOR MANUSCRIPTS
We
invite unpublished novel, original, empirical and high quality research work pertaining to recent developments & practices in
the area of Computer, Business, Finance, Marketing, Human Resource Management, General Management, Banking, Insurance,
Corporate Governance and emerging paradigms in allied subjects like Accounting Education; Accounting Information Systems;
Accounting Theory & Practice; Auditing; Behavioral Accounting; Behavioral Economics; Corporate Finance; Cost Accounting;
Econometrics; Economic Development; Economic History; Financial Institutions & Markets; Financial Services; Fiscal Policy;
Government & Non Profit Accounting; Industrial Organization; International Economics & Trade; International Finance; Macro
Economics; Micro Economics; Monetary Policy; Portfolio & Security Analysis; Public Policy Economics; Real Estate; Regional
Economics; Tax Accounting; Advertising & Promotion Management; Business Education; Business Information Systems (MIS);
Business Law, Public Responsibility & Ethics; Communication; Direct Marketing; E-Commerce; Global Business; Health Care
Administration; Labor Relations & Human Resource Management; Marketing Research; Marketing Theory & Applications;
Non-Profit Organizations; Office Administration/Management; Operations Research/Statistics; Organizational Behavior & Theory;
Organizational Development; Production/Operations; Public Administration; Purchasing/Materials Management; Retailing;
Sales/Selling; Services; Small Business Entrepreneurship; Strategic Management Policy; Technology/Innovation; Tourism,
Hospitality & Leisure; Transportation/Physical Distribution; Algorithms; Artificial Intelligence; Compilers & Translation; Computer
Aided Design (CAD); Computer Aided Manufacturing; Computer Graphics; Computer Organization & Architecture; Database
Structures & Systems; Digital Logic; Discrete Structures; Internet; Management Information Systems; Modeling & Simulation;
Multimedia; Neural Systems/Neural Networks; Numerical Analysis/Scientific Computing; Object Oriented Programming;
Operating Systems; Programming Languages; Robotics; Symbolic & Formal Logic; Web Design. The above mentioned tracks are
only indicative, and not exhaustive.
Anybody can submit the soft copy of his/her manuscript
anytime
in M.S. Word format after preparing the same as per our
submission guidelines duly available on our website under the heading guidelines for submission, at the email addresses,
[email protected]
or
.
GUIDELINES FOR SUBMISSION OF MANUSCRIPT
GUIDELINES FOR SUBMISSION OF MANUSCRIPT
GUIDELINES FOR SUBMISSION OF MANUSCRIPT
GUIDELINES FOR SUBMISSION OF MANUSCRIPT
1. COVERING LETTER FOR SUBMISSION:
DATED: _____________
THE EDITOR
IJRCM
Subject:
SUBMISSION OF MANUSCRIPT IN THE AREA OF .
(e.g. Computer/IT/Finance/Marketing/HRM/General Management/other, please specify)
.
DEAR SIR/MADAM
Please find my submission of manuscript titled ‘___________________________________________’ for possible publication in your journal.
I hereby affirm that the contents of this manuscript are original. Furthermore it has neither been published elsewhere in any language fully or partly, nor is it under review for publication anywhere.
I affirm that all author (s) have seen and agreed to the submitted version of the manuscript and their inclusion of name (s) as co-author (s).
Also, if our/my manuscript is accepted, I/We agree to comply with the formalities as given on the website of journal & you are free to publish our contribution to any of your journals.
NAME OF CORRESPONDING AUTHOR:
Designation:
Residential address with Pin Code:
Mobile Number (s):
Landline Number (s):
E-mail Address:
Alternate E-mail Address:
2. INTRODUCTION: Manuscript must be in British English prepared on a standard A4 size paper setting. It must be prepared on a single space and single column with 1” margin set for top, bottom, left and right. It should be typed in 8 point Calibri Font with page numbers at the bottom and centre of the every page.
3. MANUSCRIPT TITLE: The title of the paper should be in a 12 point Calibri Font. It should be bold typed, centered and fully capitalised.
4. AUTHOR NAME(S) & AFFILIATIONS: The author (s) full name, designation, affiliation (s), address, mobile/landline numbers, and email/alternate email address should be in italic & 11-point Calibri Font. It must be centered underneath the title.
5. ABSTRACT: Abstract should be in fully italicized text, not exceeding 250 words. The abstract must be informative and explain the background, aims, methods, results & conclusion in a single para.
6. KEYWORDS: Abstract must be followed by list of keywords, subject to the maximum of five. These should be arranged in alphabetic order separated by commas and full stops at the end.
7. HEADINGS: All the headings should be in a 10 point Calibri Font. These must be bold-faced, aligned left and fully capitalised. Leave a blank line before each heading.
8. SUB-HEADINGS: All the sub-headings should be in a 8 point Calibri Font. These must be bold-faced, aligned left and fully capitalised.
9. MAIN TEXT: The main text should be in a 8 point Calibri Font, single spaced and justified.
10. FIGURES &TABLES: These should be simple, centered, separately numbered & self explained, and titles must be above the tables/figures. Sources of data should be mentioned below the table/figure. It should be ensured that the tables/figures are referred to from the main text.
11. EQUATIONS: These should be consecutively numbered in parentheses, horizontally centered with equation number placed at the right.
12. REFERENCES: The list of all references should be alphabetically arranged. It must be single spaced, and at the end of the manuscript. The author (s) should mention only the actually utilised references in the preparation of manuscript and they are supposed to follow Harvard Style of Referencing. The author (s) are supposed to follow the references as per following:
•
All works cited in the text (including sources for tables and figures) should be listed alphabetically.•
Use (ed.) for one editor, and (ed.s) for multiple editors.•
When listing two or more works by one author, use --- (20xx), such as after Kohl (1997), use --- (2001), etc, in chronologically ascending order.•
Indicate (opening and closing) page numbers for articles in journals and for chapters in books.•
The title of books and journals should be in italics. Double quotation marks are used for titles of journal articles, book chapters, dissertations, reports, working papers, unpublished material, etc.•
For titles in a language other than English, provide an English translation in parentheses.•
The location of endnotes within the text should be indicated by superscript numbers.PLEASE USE THE FOLLOWING FOR STYLE AND PUNCTUATION IN REFERENCES:
BOOKS
•
Bowersox, Donald J., Closs, David J., (1996), "Logistical Management." Tata McGraw, Hill, New Delhi.•
Hunker, H.L. and A.J. Wright (1963), "Factors of Industrial Location in Ohio," Ohio State University.CONTRIBUTIONS TO BOOKS
•
Sharma T., Kwatra, G. (2008) Effectiveness of Social Advertising: A Study of Selected Campaigns, Corporate Social Responsibility, Edited by David Crowther & Nicholas Capaldi, Ashgate Research Companion to Corporate Social Responsibility, Chapter 15, pp 287-303.JOURNAL AND OTHER ARTICLES
•
Schemenner, R.W., Huber, J.C. and Cook, R.L. (1987), "Geographic Differences and the Location of New Manufacturing Facilities," Journal of Urban Economics, Vol. 21, No. 1, pp. 83-104.CONFERENCE PAPERS
•
Garg Sambhav (2011): "Business Ethics" Paper presented at the Annual International Conference for the All India Management Association, New Delhi, India, 19–22 June.UNPUBLISHED DISSERTATIONS AND THESES
•
Kumar S. (2011): "Customer Value: A Comparative Study of Rural and Urban Customers," Thesis, Kurukshetra University, Kurukshetra.ONLINE RESOURCES
•
Always indicate the date that the source was accessed, as online resources are frequently updated or removed.WEBSITE
INTERNATIONAL JOURNAL OF RESEARCH IN COMMERCE, IT & MANAGEMENT
EXPECTATIONS AND PERCEPTIONS OF STUDENTS IN ENGINEERING EDUCATION - A STUDY
DR. KANAGALURU SAI KUMAR
PROFESSOR & HEAD
DEPARTMENT OF MANAGEMENT
NARAYANA ENGINEERING COLLEGE
NELLORE
ABSTRACT
The Purpose of this qualitative study is to ascertain the expectations and perceptions of students studying in private engineering colleges. A sample of 175 respondents has been selected for conducting the study. The various dimensions that are considered for the study include placement, infrastructure, extracurricular activities, education, student’s development, educational material and college environment. The study reveals that there is a highest gap in education dimension and lowest gap in placement and college environment dimensions. ANOVA technique has been used to compare the mean differences between the perceptions and expectations of students. The study identifies that there is a significant difference in the mean values of perceptions and expectations of students. This study is an attempt to identify the areas where students get dissatisfaction and to offer suggestions necessary to minimize the same.
KEYWORDS
College environment, education, expectations, perceptions, placement.
INTRODUCTION
large number of students, every year have been going to United States of America, United Kingdom, Germany and Australia to pursue their Engineering education. The trend is increasing year after year because; the quality in education is more superior than compare to its quality in India. Engineering education requires more attention on the innovation and entrepreneurship ability to set success in a constantly changing global environment. Due to liberalization and privatization of Indian economy and its resulting robust growth, a large number of engineering colleges under private management started in India and still the trend is moving in the upward direction. Though the country has large youth with various skills and capabilities and willing to join in these colleges, they are limited by inadequate trained teachers, poor infrastructural facilities, absent of student development and placement related activities etc. As a result, the dissatisfied youth becoming one of the most serious constraints to economic growth. The satisfaction of a student mainly depends on the quality of education he received and the facilities he enjoyed during his course of study. The satisfaction of a student is said to be the combination of various psychological, physiological and other education related factors. It may be defined as “the willingness to express high level of satisfaction towards personal goals”. Student satisfaction has been considered as a state where students are induced to develop their skills effectively and efficiently and promote the image of the institute more happily. It focuses on general attitude of students and is an emotion, a feeling and a matter of perception. It arises from the students’ appraisal of their experience; requirements and facilities enjoyed as well as needs and want which are internal and external to the students. As educational institutions related to service sector that consider satisfaction of students based on their expectations and perceptions, studies of these kind helpful in identifying the areas of dissatisfaction.
The satisfaction of the student plays an important role in the success of any educational institute. It develops the state of healthy balance in the college in which teachers also make their respective contributions to achieve the goals set by the college management. With the Government policy of liberalization of economy, a large number of Engineering Colleges in private sector were established during the last decade. As a result the competition also started among the managements of these colleges. In a competitive environment each college is interested to improve its position to create a strong base for its survival. The competition was developed in terms of attracting large number of students by providing various student related requirements, such as placements, supply of educational material, conducting various programs and extracurricular activities etc. As management of these colleges plays a dominant role in fulfillment of various needs of students and to achieve the primary aim of students’ satisfaction, studies of these kinds are necessary to know the gap between the expectations and perceptions of students.
STATEMENT OF THE PROBLEM
Each educational Institute has its own policies for the accomplishment of objectives. Continuous updating and monitoring of these policies is essential to keep the pace with change in time and to avoid any dissatisfaction of the students. To study the expectations and perceptions of the students, various factors which are directly or indirectly related to students and college environment have been considered. These factors include placement, infrastructure, extracurricular activities, education, student development, educational material supplied, and college environment etc.
The study is based on the students studying in private engineering colleges. The need for the study is to ascertain the expectations and perceptions of the students that lead to the satisfaction. This study will help the managements of the colleges in identifying the gap and to develop more appropriate policies for the better management of educational Institutions.
LITERATURE REVIEW
It is a fact that satisfaction is treated as an important factor in determining the demand of goods and services and also considered as an indicator that affects the competitive advantages of firms. The term satisfaction in service sector is different from the term used in the goods market. Since evaluating the satisfaction is more difficult, the measurements are in general made by means of perceptions of consumers. Student’s satisfaction is the major indicator of service quality in educational institutions. Many researchers on this issue believe that there is a relation between the perception and their satisfaction (Petersen 1988). Satisfaction of students appears to be a major device in order to take important decisions by the college managements. According to Ibekwe (2006), any higher educational Institute must desire its basic goals and objectives to satisfy students by offering various academic and career oriented programs, providing quality teaching and learning environment and by providing adequate student support services. Therefore, the managements of the colleges, as a matter of fact, take satisfaction of students into account as a main goal of strategies of their colleges. (Bolton & Frederic, 1971). Abbott & Doucouliagos (2003), in their studies also opined to change the attitude of management towards providing relevant, purposeful and meaningful education for the academic community and for the society as a whole.
life setting it requires to collect the data twice from the same customers and compare their answers. However, from the management perspective it is always necessary to identify the gap between expectations and perceptions of the students, so that effective and suitable strategies can be designed to close the gaps or at least to minimize them (Arun Kumar,2010). In the present study gap approach has been used, with the objective of identifying the gaps and to use these gaps for the prediction of the satisfaction of the students.
Some of the other researchers such as Stanley and Reynolds (1994), Srikanth and Dairymple (2007), Kealy and Rockel(1987), Anderson (2000), Hill et al (2003), in their studies suggested various factors like placement, education, infrastructure, college environment etc., contribute positive perceptions of the students. The essence of these studies is the consideration of various factors that are responsible for the satisfaction of students as well as finding out the relation among them giving least scope to identify the gap between the expectations and perceptions. Hence, the present study may be considered as one among the few studies that bridges the gap.
OBJECTIVES OF THE STUDY
The purpose of the present study is aimed to enhance the satisfaction of students studying in private Engineering colleges by indentifying the gap between their expectations and perceptions on various college related factors. The following are the research objectives formulated to guide the study.
1. To measure the gap between expectations and perceptions of the students studying engineering education. 2. To suggest suitable measures, to minimize the gap between expectations and perceptions of the students.
HYPOTHESIS
This study infers that there is no difference in the mean value of students’ expectations and perceptions for all dimensions. As against this back ground the following hypothesis has been formulated.
NULL HYPOTHESIS: There is no difference in the mean value of students’ expectations and perceptions for all dimensions.
ALTERNATIVE HYPOTHESIS: There is a difference in the mean value of students’ expectations and perceptions for all dimensions.
METHODOLOGY
INSTRUMENT DEVELOPMENT
The Instrument used in this study is composed of 2 parts. Satisfaction of the students was measured by a questionnaire consists of 7 dimensions namely 1. Placement
2. Infrastructure
3. Extracurricular activities 4. Education
5. Student Development 6. Educational Material 7. College environment.
The dimensions included in the questionnaire have been taken from the students perceptions and are supported by other researchers like Dalwinder kaur and Gurwinder singh Bhalla (2010), Anderson (2000), Hill et al (2003). Part 1 of the questionnaire includes demographic characteristics such as gender, area of residence, year of study etc, while part 2 has an expectations section and perceptions section with 33 statements Each of these statements was measured on 4 points likert scale in which 1 indicated “strongly disagree”, 2 indicated “disagree” 3 indicated agree” and 4 indicated “strongly agree”.
DATA COLLECTION:
A survey Instrument in the form of close ended questionnaire was developed for the purpose of collecting the main data for the study. This study was conducted at various private engineering colleges located in Nellore district in Andhra Pradesh. Various factors such as precession, accuracy, time and cost constraints were taken into consideration in selecting the respondents. Using convenient sampling technique 10 colleges were selected. Using non-probability sampling technique, a total of 175 students were selected as a sample of the study. The respondents were selected from private engineering colleges only in order to maintain uniformity and also, proper care has been taken to select the respondents studying different years of engineering, to improve the generalization of the result. The actual field survey was conducted over a period of one month between June 2010 and August 2010, whereby personal interviews were employed to obtain the required information from the selected respondents.
DATA ANALYSIS
The primary data collected have been sorted, classified and tabulated in a format and analyzed by using statistical package for social sciences (SPSS16.0). Appropriate statistical procedures like averages, ANOVA tests have been used for inference.
RESULTS AND ANALYSIS
PROFILE OF THE RESPONDENTS
The table1 reveals that 62.85 percent of respondents were male and the rest 37.15 percent were female students. An analysis of area of residence of the respondents indicates that 26.85 percent were with rural background, 37.15 percent were with semi urban, and the remaining 36 percent were with urban background. Similarly an analysis of the student respondents studying different years of engineering education reveal that 20 percent of respondents were studying first year, 35.42 percent were studying second year, 26.28 percent of the respondents were studying third year and the remaining 18.20 percent with fourth year of their study. With respect to gender, the students are male dominated. With respect to area of residence, most of the students belong to semi urban and with respect to year of study, majority of students belong to second year.
TABLE 1: PROFILE OF THE RESPONDENTS
1.Gender No of Respondents Percentage
a) Male 110 62.85
b) Female 65 37.15
Total 175 100
2.Area of residence
a) Rural 47 26.85
b) Semi urban 65 37.15
c) Urban 63 36.00
Total 175 100
3.Year of study
a) First year 35 20.00
b) Second year 62 35.42
c) Third year 46 26.28
INTERNATIONAL JOURNAL OF RESEARCH IN COMMERCE, IT & MANAGEMENT
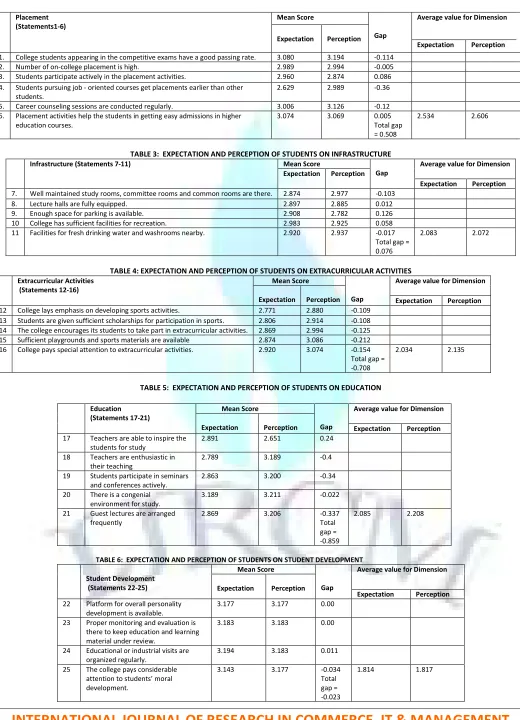
TABLE 2: EXPECTATION AND PERCEPTION OF STUDENTS ON PLACEMENT STATEMENTSTABLE 3: EXPECTATION AND PERCEPTION OF STUDENTS ON INFRASTRUCTURE
Infrastructure (Statements 7-11) Mean Score
Gap
Average value for Dimension
Expectation Perception
Expectation Perception
7. Well maintained study rooms, committee rooms and common rooms are there. 2.874 2.977 -0.103
8. Lecture halls are fully equipped. 2.897 2.885 0.012
9. Enough space for parking is available. 2.908 2.782 0.126
10 College has sufficient facilities for recreation. 2.983 2.925 0.058
11 Facilities for fresh drinking water and washrooms nearby. 2.920 2.937 -0.017
Total gap = 0.076
2.083 2.072
TABLE 4: EXPECTATION AND PERCEPTION OF STUDENTS ON EXTRACURRICULAR ACTIVITIES
Extracurricular Activities (Statements 12-16)
Mean Score
Gap
Average value for Dimension
Expectation Perception Expectation Perception
12 College lays emphasis on developing sports activities. 2.771 2.880 -0.109
13 Students are given sufficient scholarships for participation in sports. 2.806 2.914 -0.108
14 The college encourages its students to take part in extracurricular activities. 2.869 2.994 -0.125
15 Sufficient playgrounds and sports materials are available 2.874 3.086 -0.212
16 College pays special attention to extracurricular activities. 2.920 3.074 -0.154
Total gap = -0.708
2.034 2.135
TABLE 5: EXPECTATION AND PERCEPTION OF STUDENTS ON EDUCATION
Placement (Statements1-6)
Mean Score
Gap
Average value for Dimension
Expectation Perception
Expectation Perception
1. College students appearing in the competitive exams have a good passing rate. 3.080 3.194 -0.114
2. Number of on-college placement is high. 2.989 2.994 -0.005
3. Students participate actively in the placement activities. 2.960 2.874 0.086
4. Students pursuing job - oriented courses get placements earlier than other
students.
2.629 2.989 -0.36
5. Career counseling sessions are conducted regularly. 3.006 3.126 -0.12
6. Placement activities help the students in getting easy admissions in higher
education courses.
3.074 3.069 0.005
Total gap = 0.508
2.534 2.606
Education (Statements 17-21)
Mean Score
Gap
Average value for Dimension
Expectation Perception Expectation Perception
17 Teachers are able to inspire the
students for study
2.891 2.651 0.24
18 Teachers are enthusiastic in
their teaching
2.789 3.189 -0.4
19 Students participate in seminars
and conferences actively.
2.863 3.200 -0.34
20 There is a congenial
environment for study.
3.189 3.211 -0.022
21 Guest lectures are arranged
frequently
2.869 3.206 -0.337
Total gap = -0.859
2.085 2.208
TABLE 6: EXPECTATION AND PERCEPTION OF STUDENTS ON STUDENT DEVELOPMENT
Student Development (Statements 22-25)
Mean Score
Gap
Average value for Dimension
Expectation Perception
Expectation Perception
22 Platform for overall personality
development is available.
3.177 3.177 0.00
23 Proper monitoring and evaluation is
there to keep education and learning material under review.
3.183 3.183 0.00
24 Educational or industrial visits are
organized regularly.
3.194 3.183 0.011
25 The college pays considerable
attention to students’ moral development.
3.143 3.177 -0.034
Total gap = -0.023
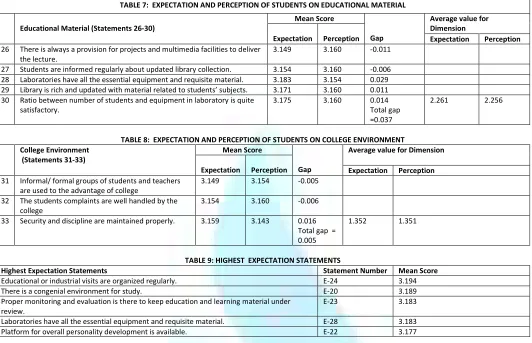
TABLE 7: EXPECTATION AND PERCEPTION OF STUDENTS ON EDUCATIONAL MATERIAL
Educational Material (Statements 26-30)
Mean Score
Gap
Average value for Dimension
Expectation Perception Expectation Perception
26 There is always a provision for projects and multimedia facilities to deliver the lecture.
3.149 3.160 -0.011
27 Students are informed regularly about updated library collection. 3.154 3.160 -0.006
28 Laboratories have all the essential equipment and requisite material. 3.183 3.154 0.029
29 Library is rich and updated with material related to students’ subjects. 3.171 3.160 0.011 30 Ratio between number of students and equipment in laboratory is quite
satisfactory.
3.175 3.160 0.014
Total gap =0.037
2.261 2.256
TABLE 8: EXPECTATION AND PERCEPTION OF STUDENTS ON COLLEGE ENVIRONMENT College Environment
(Statements 31-33)
Mean Score
Gap
Average value for Dimension
Expectation Perception Expectation Perception
31 Informal/ formal groups of students and teachers are used to the advantage of college
3.149 3.154 -0.005
32 The students complaints are well handled by the college
3.154 3.160 -0.006
33 Security and discipline are maintained properly. 3.159 3.143 0.016
Total gap = 0.005
1.352 1.351
TABLE 9: HIGHEST EXPECTATION STATEMENTS
Highest Expectation Statements Statement Number Mean Score
Educational or industrial visits are organized regularly. E-24 3.194
There is a congenial environment for study. E-20 3.189
Proper monitoring and evaluation is there to keep education and learning material under review.
E-23 3.183
Laboratories have all the essential equipment and requisite material. E-28 3.183
Platform for overall personality development is available. E-22 3.177
From the above, three of the highest expectations, E22, E23, E24, are in the student development dimension. The second highest expectation, E20 is in the education dimension and the other one, E28, is from the educational material dimension.
TABLE 10: LOWEST EXPECTATION STATEMENTS
Lowest Expectation Statements Statement Number Mean Score
Students pursuing job - oriented courses get placements earlier than other students. E-4 2.629
College lays emphasis on developing sports activities. E-12 2.771
Teachers are enthusiastic in their teaching E-18 2.789
The college encourages its students to take part in extracurricular activities. E-14 2.869
Guest lectures are arranged frequently E-21 2.869
The lowest expectation statement is in the placement dimension, E4, two of the lowest expectation statements, E12, E14 are in extracurricular activities dimension and the other lowest expectation statements E18, E21 are in education dimension.
TABLE 11: HIGHEST PERCEPTION STATEMENTS
Highest Perception Statements Statement Number Mean Score
There is a congenial environment for study. P-20 3.211
Students participate in seminars and conferences actively. P-19 3.200
Guest lectures are arranged frequently P-21 3.206
College students appearing in the competitive exams have a good passing rate. P-1 3.194
Teachers are enthusiastic in their teaching P-18 3.189
From the above, four of the highest perception statements E18, E19, E20, and E21are in the education dimension, the other highest perception statement E1 is in the placement dimension.
TABLE 12: LOWEST PERCEPTION STATEMENTS
Lowest Perception Statements Statement Number Mean Score
Teachers are able to inspire the students for study P-17 2.651
Enough space for parking is available. P-9 2.782
Students participate actively in the placement activities. P-3 2.874
College lays emphasis on developing sports activities. P-12 2.880
Lecture halls are fully equipped. P-8 2.885
INTERNATIONAL JOURNAL OF RESEARCH IN COMMERCE, IT & MANAGEMENT
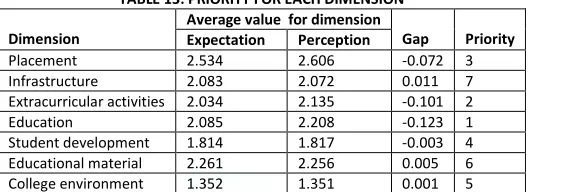
TABLE 13: PRIORITY FOR EACH DIMENSIONDimension
Average value for dimension
Gap Priority Expectation Perception
Placement 2.534 2.606 -0.072 3
Infrastructure 2.083 2.072 0.011 7
Extracurricular activities 2.034 2.135 -0.101 2
Education 2.085 2.208 -0.123 1
Student development 1.814 1.817 -0.003 4
Educational material 2.261 2.256 0.005 6
College environment 1.352 1.351 0.001 5
From the above table it is clear that students were given first priority to education followed by extracurricular activities and placement. The fourth and fifth priorities were given to student development and college environment followed by educational material and infrastructure.
TABLE 14: RESULT OF COMPARISON OF PLACEMENT STATEMENTS FOR EXPECTATION AND PERCEPTION
Statements Sum of Squares df Mean Square F Sig.
Between Groups 7.046 3 2.349 8.828 .000
Within Groups 45.492 171 .266
Total 52.537 174
The result of ANOVA between expectations and perceptions for placements is explained in the above table. The calculated F value is 8.828, which is greater than tabular value of F (3,171) = 2.60, and falls in the rejection region. Hence, the null hypothesis is rejected and is significant at 5% level of confidence. Therefore, it is
clear that there is a difference in the mean value of students’ expectations and perceptions for placement factor.
TABLE 15: RESULT OF COMPARISON OF INFRASTRUCTURE STATEMENTS FOR EXPECTATION AND PERCEPTION
Statements Sum of Squares df Mean Square F Sig.
Between Groups 4.885 3 1.628 2.868 .038
Within Groups 97.092 171 .568
Total 101.977 174
The result of ANOVA between expectations and perceptions for infrastructure is explained in the above table. The calculated F value is 2.868, which is greater than tabular value of F (3,171) = 2.60, and falls in the rejection region. Hence, the null hypothesis is rejected and is significant at 5% level of confidence. Therefore, it
is clear that there is a difference in the mean value of students’ expectations and perceptions for infrastructure factor.
TABLE 16: RESULT OF COMPARISON OF EXTRACURRICULAR ACTIVITIES STATEMENTS FOR EXPECTATION AND PERCEPTION
Statements Sum of Squares df Mean Square F Sig.
Between Groups 1.023 3 .341 .596 .618
Within Groups 97.834 171 .572
Total 98.857 174
The result of ANOVA between expectations and perceptions for extracurricular activities is explained in the above table. The calculated F value is 0.596, which is lesser than tabular value of F (3,171) = 2.60, and falls in the acceptance region. Hence, the null hypothesis is accepted, but is not significant at 5% level of
confidence.
Table 17: RESULT OF COMPARISON OF EDUCATION STATEMENTS FOR EXPECTATION AND PERCEPTION
Statements Sum of Squares df Mean Square F Sig.
Between Groups 2.289 3 .763 3.125 .027
Within Groups 41.746 171 .244
Total 44.034 174
The result of ANOVA between expectations and perceptions for education is explained in the above table. The calculated F value is 3.125, which is greater than tabular value of F (3,171)
=
2.60, and falls in the rejection region. Hence, the null hypothesis is rejected and is significant at 5% level of confidence. Therefore, it is
clear that there is a difference in the mean value of students’ expectations and perceptions for education factor.
TABLE 18: RESULT OF COMPARISON OF STUDENT DEVELOPMENT STATEMENTS FOR EXPECTATION AND PERCEPTION
Statements Sum of Squares df Mean Square F Sig.
Between Groups 8.602 2 4.301 19.829 .000
Within Groups 37.307 172 .217
Total 45.909 174
The result of ANOVA between expectations and perceptions for student development is explained in the above table. The calculated F value is 19.829, which is greater than tabular value of F (2,172) = 3.0, and falls in the rejection region. Hence, the null hypothesis is rejected and is significant at 5% level of confidence.
Therefore, it is clear that there is a difference in the mean value of students’ expectations and perceptions for student development factor.
TABLE 19: RESULT OF COMPARISON OF EDUCATIONAL MATERIAL STATEMENTS FOR EXPECTATION AND PERCEPTION
Statements Sum of Squares df Mean Square F Sig.
Between Groups 11.686 3 3.895 13.054 .000
Within Groups 51.023 171 .298
The result of ANOVA between expectations and perceptions for educational material is explained in the above table. The calculated F value is 13.054, which is greater than tabular value of F (3,171)
=
2.60, and falls in the rejection region. Hence, the null hypothesis is rejected and is significant at 5% level of confidence.
Therefore, it is clear that there is a difference in the mean value of students’ expectations and perceptions for Educational material factor.
TABLE 20: RESULT OF COMPARISON OF COLLEGE ENVIRONMENT STATEMENTS FOR EXPECTATION AND PERCEPTION
Statements Sum of Squares df Mean Square F Sig.
Between Groups 44.815 3 14.938 147.472 .000
Within Groups 17.322 171 .101
Total 62.137 174
The result of ANOVA between expectations and perceptions for college environment is explained in the above table. The calculated F value is 147.472, which is greater than tabular value of F (3,171)
=
2.60, and falls in the rejection region. Hence, the null hypothesis is rejected and is significant at 5% level of confidence.
Therefore, it is clear that there is a difference in the mean value of students’ expectations and perceptions for college environment factor.
FINDINGS AND RECOMMENDATIONS
The highest gap between the expectations and perceptions of the students was found in the education dimension. The result of the study reveals that students are not happy about the education they are getting for completion of engineering course. This indicates that students are expecting good education than they are receiving at present. This gap can be bridged by providing good education by way of appointing experienced and dedicated teachers, providing more teaching by practical training and teaching by audio visual aids etc,. The lowest gap in the college environment and placement dimensions show that the students are satisfied with environment prevailed in the college campuses and the placements being offered by the college administration. If the college administration fails to provide congenial environment and placements, students get dissatisfaction. But the present study shows that majority of respondents satisfied with the college environment and placements. The study also reveals that, students have more expectations on student development activities followed by good education. Hence, the managements of the colleges must give proper importance to provide a platform for career development and personality development as well as moral development of the students.
CONCLUSION
The educational institutions started in recent years have been facing heavy competition due to rapidly changing environment for survival. It is the responsibility of college managements to provide various requirements to the satisfaction of students, otherwise, they get dissatisfaction and therefore they will not feel happy studying in these colleges. Hence, the managements of educational institutions must find out the areas where students feel unhappy, and also to investigate factors and understand what makes them to feel happy. The results of the study show various implications for the individual colleges offering engineering education. A study of this kind helps to identify the areas where students get dissatisfaction. The study identifies what the managements of these colleges have to do to minimize the gap between the expectations and perceptions of the students and also to enhance the satisfaction.
REFERENCES
1. Abbott. M and Doucouliagos.C (2003),” The Efficiency of Australian Universities: A Data Envelopment Analysis”, Economics of Education Review, No.22 pp.89-97.
2. Aldlaigan A, and Buttle A., (2002),: SYSTRA-SQ: A New Measure of Bank Service Quality”, International Journal of Service Industry Management, Vol.13,No.4,pp.362-381.
3. Arun Kumar S, Tamil Mani,Mahalingam S,and Vanjikovan M(2010),”Imfluence of Service Quality on Attitudinal Loyality in Private Retail Banking: An Emirical Study”,The IUP Journal of Management Research, Vol 9, No.4, pp-21-38.
4. Anderson. L(2000),’Teaching Development in Higher Education as Scholarly Practice: A Reply to Rowland et al.,”Turning Academics into Teachers”, Teaching in Higher Education, Vol.5, No.3,pp. 23-31.
5. Bolton E.C and Frederic G.H (1971), ‘Universities and Managements”, The Journal of Higher Education, Vol. 42, pp. 279 -291.
6. Cronin. J.J Jr and Taylor,S.A, ( 1992), “Measuring the Service Quality: A Reexamination and Extension”, Journal of Marketing,Vol.56,July,pp.55-68.
7. Dalwinder kaur and Gurwinder singh Bhalla (2010), “College Management and Views of Students”, The IUP Journal of Management Research Vol-9, Vol-5 pp.6-26.
8. Hill. Y,Lomas.L and Macgregor (2003),”Students Perceptions of Quality in Higher Education”, Quality Assurance in Education, Vol. 11, No. 1, pp15-20. 9. [Ibekwe (2006),”Using Total Quality Management to Achieve Academic Program Effectiveness: An Evaluation of Administrator and Faculty Perceptions in
Business Schools at Historically Black Colleges and Universities “, Un Published PhD Thesis, Capella University, Minneapolis.
10. Kealy. M.J and Rockel.M.L(1987), “Students Perceptions of College Quality : The Influence of College Recruitment Policies”, The Journal of Higher Education, Vol.58,No.6,pp.683-703.
11. Nunnalym,J.C(1978), Psychometric Theory,New Yark, McGraw-Hill.
12. Parasuraman,A.,Zeithamal V.A., and Berry L.,(1985) “ a Conceptual Model of Service Quality and its Implications for Future Research”. Journal of Marketing 49; pp 41-50.
13. Parasuraman,A.,Zeithamal V.A., and Berry L.,(1988)”SERVQUL- A Multiple Item Scale for Measuring Consumer Perceptions of Service Quality” Journal of Retailing 64(1); PP 12-40.
14. Petersen, M.B.H (1988). Measuring satisfaction; collecting useful data, Journal of Nursing Quality Assurance,2(3), pp 25-35.
15. Stanley. G and Reynolds.P(1994),”The relationship between students levels of school achievement, their preferences for fuure enrollements and their images of universities”, higher education,Vol.27,No.1,pp. 85-93.
16. Srikanathan. G and DairympleJ.F (2007), “A Conceptual Overview of a Holistic Model for Quality in Higher Eduation”, International Journal of Educational Management, Vol.21, No.3, pp.173-193.
17. Teas R, (1993),”Expectations, Performance Evaluation and Consumer Perceptions of Quality and Satisfaction”. Journal of Retailing, Vol. 72, No.2, pp.201-214.
INTERNATIONAL JOURNAL OF RESEARCH IN COMMERCE, IT & MANAGEMENT
REQUEST FOR FEEDBACK
Dear Readers
At the very outset, International Journal of Research in Commerce, IT and Management (IJRCM)
acknowledges & appreciates your efforts in showing interest in our present issue under your kind perusal.
I would like to request you to supply your critical comments and suggestions about the material published
in this issue as well as on the journal as a whole, on our E-mails i.e.
or
for further improvements in the interest of research.
If you have any queries please feel free to contact us on our E-mail
.
I am sure that your feedback and deliberations would make future issues better – a result of our joint
effort.
Looking forward an appropriate consideration.
With sincere regards
Thanking you profoundly
Academically yours
Sd/-