M E T H O D O L O G Y
Open Access
Tools and best practices for
retrotransposon analysis using
high-throughput sequencing data
Aurélie Teissandier
1,2,3,4, Nicolas Servant
1,2,3*, Emmanuel Barillot
1,2,3and Deborah Bourc
’
his
1,4*Abstract
Background:Sequencing technologies give access to a precise picture of the molecular mechanisms acting upon genome regulation. One of the biggest technical challenges with sequencing data is to map millions of reads to a reference genome. This problem is exacerbated when dealing with repetitive sequences such as transposable elements that occupy half of the mammalian genome mass. Sequenced reads coming from these regions introduce ambiguities in the mapping step. Therefore, applying dedicated parameters and algorithms has to be taken into consideration when transposable elements regulation is investigated with sequencing datasets.
Results:Here, we used simulated reads on the mouse and human genomes to define the best parameters for aligning transposable element-derived reads on a reference genome. The efficiency of the most commonly used aligners was compared and we further evaluated how transposable element representation should be estimated using available methods. The mappability of the different transposon families in the mouse and the human genomes was calculated giving an overview into their evolution.
Conclusions:Based on simulated data, we provided recommendations on the alignment and the quantification steps to be performed when transposon expression or regulation is studied, and identified the limits in detecting specific young transposon families of the mouse and human genomes. These principles may help the community to adopt standard procedures and raise awareness of the difficulties encountered in the study of transposable elements.
Keywords:Retrotransposon, High-throughput sequencing, Data analysis, Mapping, Quantification
Background
Transposable elements (TEs) comprise approximately half of the mammalian genomes [1]. Based on de novo repeat iden-tification, it has been suggested that two-thirds of the human genome is in fact composed of repetitive elements [2].TEs are first classified according to their ability to invade the gen-ome and their related molecular mechanisms. DNA transpo-sons use a cut-and-pastemechanism where the element is excised and inserted into a new locus. Retrotransposons use an intermediate RNA template to insert into new genomic locations, in a copy-and-pastemanner. These are classified into Long-Terminal Repeat (LTR) elements that are similar to retroviruses, and non-LTR elements. Non-LTR elements are more abundant compared to LTR elements and DNA
transposons in mammalian genomes. The vast majority of TE insertions are incapable of mobilization, due to invalidat-ing truncations, internal rearrangements or mutations. How-ever, based on cell culture assays, it has been estimated that 80–100 L1HS elements are competent for retrotransposition in the human genome [3] and around 3000 L1 elements from the Tf, A and Gf subfamilies are potentially capable of retrotransposition in the mouse genome [4]. De novo inser-tions of TEs -mainly Alu, L1 and SVA non-LTR families-have been associated with more than 100 human diseases [5]. In reaction, cells have developed several restraining mechanisms against TE activity. At the transcriptional level, DNA methylation and repressive histone modifications block TE expression. In the cytoplasm, some restriction factors de-grade retrotransposon RNAs. Other factors play a role in the nucleus by interfering with the DNA integration step [6].
The emergence of high-throughput sequencing tech-nologies has allowed making tremendous progress in
© The Author(s). 2019Open AccessThis article is distributed under the terms of the Creative Commons Attribution 4.0 International License (http://creativecommons.org/licenses/by/4.0/), which permits unrestricted use, distribution, and reproduction in any medium, provided you give appropriate credit to the original author(s) and the source, provide a link to the Creative Commons license, and indicate if changes were made. The Creative Commons Public Domain Dedication waiver (http://creativecommons.org/publicdomain/zero/1.0/) applies to the data made available in this article, unless otherwise stated.
* Correspondence:[email protected];[email protected]
1Institut Curie, PSL Research University, 75005 Paris, France
our understanding of the regulation and functional im-pact of TEs. However, the characterization of these elements remains computationally challenging, mainly due to their repetitiveness [6]. As they are not unique in the genome, repeated sequences create ambiguities in the alignment step, which can lead to misleading biological conclusions if inappropriate parameters are applied [7,8]. Different algorithms have been developed for the purpose of mapping reads according to the se-quencing application [9]. By default, most of these tools are parameterized to randomly report one genomic pos-ition among the set of possible alignments. Addpos-itional parameters or filters are implemented to keep uniquely mapped reads, to report all possible positions of reads or to return up to a given number of valid alignments. Benchmarkings of these methods have also been re-ported to compare their efficiency. Some of them inves-tigated specific biological applications, such as Whole-Genome Bisulfite Sequencing (WGBS) [10] and RNA-seq [11] or specific sequencing platforms [12]. Schbath et al. assessed the power of tools to retrieve all the read occurences. However, their study relied on simulated short single-end reads of 40 bp without any insertions/ deletions (indels). Hatem et al. investigated the effect of different mapping parameters such as number of mismatches, seed and read length, gapped vs ungapped alignment. Nevertheless, they did not inves-tigate the power of the different algorithms to align TE-derived reads.
Some tools were developed to quantify TEs within se-quencing data. TEtools uses TE annotation to create Bow-tie2 index and performs mapping by reporting randomly one position [13,14]. RepEnrich recommends performing the mapping with Bowtie to retrieve unique alignments [15, 16]. It enables quantifying unique reads emanating from specific families (referred torepEnrich Uniquein this study) and the total number of reads, unique and multiple, mapped to each TE family (repEnrich Total). The
repEn-rich Fractionalmethod counts reads that map to a single
TE family and assigns multi-mapped reads to correspond-ing families uscorrespond-ing a fractional value 1/n, where n is the number of TE families the read maps to. SQuIRE [17] al-lows quantifying TE single copies and families performing the alignment with STAR [18] and using an iterative method to assign multi-mapped reads (SQuIRE). Finally, TEtranscripts [19] advises to generate BAM files with the STAR mapper, and performs TE quantification using only uniquely-mapped reads (TEtranscripts Unique), or using multi-mapped reads with an iterative method ( TEtran-scripts Multiple).
In this study, we propose to benchmark at once the ef-ficiency of the most used aligners and available tools for TE quantification. Using simulated data with mouse and human genomes, Bowtie, Bowtie2, STAR, Novoalign
(http://www.novocraft.com), BWA aln [20] and mem [21] alignment algorithms were compared. We also assessed the effect of using paired-end library compared to single-end library with TE-derived reads. Reporting unique reads, randomly one position and all possible lo-cations were compared when TE abundance was esti-mated. In addition, TE quantification was compared to TE-simulated abundance using the most recent and used RepeatMasker-based tools, TEtools, repEnrich, SQuIRE
and TEtranscript. Finally, the efficiency to map reads
from each TE subfamily within the mouse and the hu-man genome was computed and revealed the difficulties of accessing specific young TE families.
Results
Mapping based on STAR and PE libraries are highly recommended to align reads coming from transposable elements
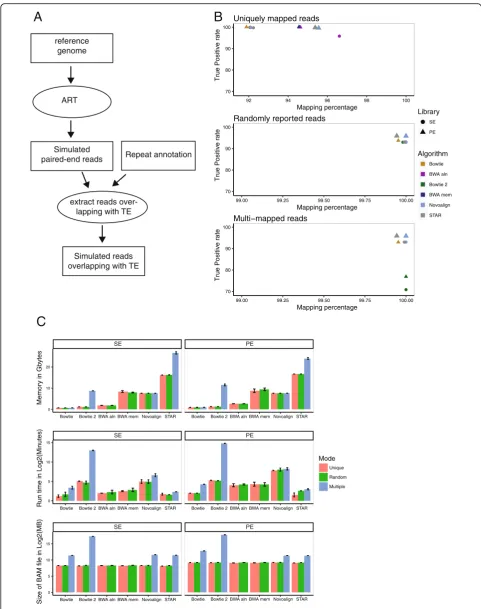
To compare different mapping algorithms and their effi-ciency to align reads from repeated sequences, we relied on simulated data (Fig.1a). Using a reference genome, 2x100bp paired-end reads were simulated with ART v2.5.8 [22] mim-icking Illumina HiSeq 2500 technology (mean fragment size = 200 bp, standard deviation = 20 bp and technology-specific sequencing errors). Reads overlapping with Repeat-Masker annotations were kept (Smit, R, & P, 2013–2015). Three independent datasets were simulated at a 10X cover-age and aligned using Bowtie1, Bowtie2, BWA aln and mem algorithms, Novoalign and STAR. Only one end of the simu-lated fragments (single-end (SE) alignment) or both ends (paired-end (PE) alignment) were used, allowing us to com-pare the performance of both library types when TE-derived reads are aligned. Algorithms were run while enabling unique, randomly-reported or multi-mapped reads, except for BWA algorithms that do not give the possibility to return several hits per read. Reported alignments were compared to the simulated positions. When congruent, alignments were flagged as true-positive (TP) and weighted by the number of reported hits for the corresponding read in the multi-mapped mode. This approach allowed penalizing algorithms that report too many positions per read.
A
C
reference genome
ART
Simulated paired-end reads
extract reads over-lapping with TE
Simulated reads overlapping with TE
Repeat annotation
B
0 10 20
Memor
y in Gb
ytes
0 5 10 15
Run time in Log2(Min
u
tes)
Bowtie Bowtie 2BWA alnBWA mem Novoalign STAR
0 5 10 15
Siz
e
of BAM file in Log2(MB)
Mode
Unique Random Multiple
Bowtie Bowtie 2BWA alnBWA mem Novoalign STAR Bowtie Bowtie 2BWA alnBWA mem Novoalign STAR Bowtie Bowtie 2BWA alnBWA mem Novoalign STAR
Bowtie Bowtie 2BWA alnBWA mem Novoalign STAR Bowtie Bowtie 2BWA alnBWA mem Novoalign STAR
70 80 90 100
92 94 96 98 100
Mapping percentage
True Positive
rate
Uniquely mapped reads
70 80 90 100
99.00 99.25 99.50 99.75 100.00
Mapping percentage
True Positive r
ate
Randomly reported reads
70 80 90 100
99.00 99.25 99.50 99.75 100.00
Mapping percentage
True Positive r
ate
Multi−mapped reads
Library
SE
PE
Algorithm
Bowtie
BWA aln
Bowtie 2
BWA mem
Novoalign
STAR
SE PE
SE PE
information because the second read of the pair had dif-ferent valid alignments.
Bowtie2, BWA mem and aln algorithms do not allow reporting uniquely mapped reads with defined parame-ters. Post-mapping filtering is therefore required. In this case, these mappers had the same performance with both SE and PE libraries compared to STAR and Novoa-lign (Fig.1b and Additional file1: Figure S1A and Tables 1and2).
When randomly-reported and multi-mapped reads were allowed (middle and bottom panels, Fig 1b and Additional file 1: Figure S1A), the percentage of map-ping increased close to 100%, leading to a decrease of TP rate around 93% for Bowtie1, 93% for the others in SE and 96% in PE. In addition, we also observed a big drop in Bowtie2 TP rate in the multi-mapped mode. Bowtie2 did not guarantee that the reported alignments are the best possible in terms of alignment score. Conse-quently, more alignments were reported, leading to a de-crease of TP rate compared to other algorithms. As in unique mode, Bowtie1 was less efficient using PE library than SE library compared to Novoalign and STAR.
Computation time, BAM file size and memory usage were finally reported (Tables 1 and 2, Fig. 1c for mouse simulation and Additional file 1: Figure S1B for the hu-man simulation) for all applied mappers and modes. The runtime measurement includes post-mapping filtering in the unique mode for bowtie2, BWA mem and aln algo-rithms. All algorithms required less than 10GB, except STAR which required 26GB at most. On the other hand, STAR was at least 15 times faster compared to Novoalign. Reporting all possible alignments per read increased at least four times the output size in PE mode compared to randomly-reported alignments for the mouse simulation. Output size of Bowtie2 in multi-mapped mode confirmed the fact that Bowtie2 reported too many alignments per read inducing a decrease of TP rate. In conclusion, STAR gave the best compromise in terms of mapping efficiency and accuracy, as well as computing time.
Quantification of TE families: random and multiple counting methods give the best estimations
Regarding its better performance, STAR was used as the mapping algorithm in subsequent quantification analyses. One library was simulated at a 10X coverage using the pipe-line described previously with the human and mouse ge-nomes as reference. The same mapping parameters than in previous analyses were applied for the human simulation.
However, mapping parameters were adjusted (see Additional file5) for the mouse simulation allowing higher number of multi-mapped reads, to account for the more complex TE content in this species. TE-estimated quantification from dif-ferent developed methods was compared to simulated abun-dance. TE families were quantified using uniquely-mapped reads (referred to FeatureCounts Unique alignments), randomly-reported position (FeatureCounts Random align-ments) and all valid alignments (FeatureCounts Multiple
alignments). In the FeatureCounts Multiple alignments,
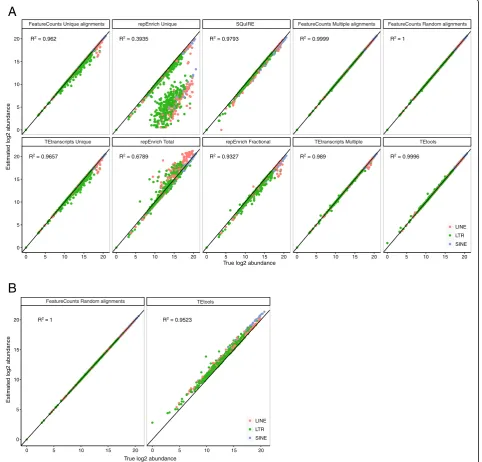
alignments were weighted by the number of corresponding hits. Quantifications were performed using featureCounts [23]. In addition, repEnrich, TEtools, SQuIRE and TEtran-scripts were evaluated using recommended parameters. TE-simulated abundance and estimated abundance were corre-lated for the different methods (Fig.2a for mouse simulation and Additional file3: Figure S2A for human simulation).
Methods using only unique reads (FeatureCounts Unique alignments, repEnrich Unique, TEtranscripts
Unique) underestimated some TE families of all classes
(LTR, LINEs and SINEs), with repEnrich Unique being the least accurate. In contrast, counting the total number of reads mapping to each TE family -as it is the case
with repEnrich Total- induced an overestimation. On
the other hand, weighting by the number of hits (
Fea-tureCounts Multiple alignments) or reporting randomly
one position (TEtoolsand FeatureCounts Random
align-ments) gave the most satisfactory TE estimation with a
correlation close to 1. To test whether coverage could influence these results, we repeated the simulation with 5X, 10X, 25X, 50X and 100X coverage, focusing on spe-cific TE families known to be potentially active (B2_ Mm1a, IAPEz-int and L1MdA_I for the mouse genome and AluYa5, HERVK-int, L1HS and SVA_F for the hu-man genome). Independently of the coverage depth, methods using unique reads (FeatureCounts Unique
alignments, repEnrich Unique, TEtranscripts Unique)
consistently underestimated TE families (Additional file 3: Figure S3A and B), whileFeatureCounts using random
and multiple alignments and TEtoolsgave the best
esti-mation, confirming the 10X genome-wide simulation. By proposing to map reads on TE annotations only, TEtools contrasts with other mapping methods that align reads genome-wide and then extract TE-derived reads only. However, because transposable elements represent only half of the mammalian genomes, we wanted to estimate whether TEtools could introduce some biases. New datasets were then simulated uniformly genome-wide, including non-(See figure on previous page.)
Fig. 1Comparison of mapper efficiency with mouse simulated data.aA diagram showing the method for the data simulation. The circles represent used
repeated sequences, by generating PE libraries with a 10X coverage from mouse and human genomes. Compared to
the FeatureCounts Random alignments (with STAR
for the mapping), TEtools clearly introduced an over-estimation of both LINE1 and LTR elements by for-cing non-derived reads to map to TE sequences (Fig. 2b and Additional file 2: Figure S2B).
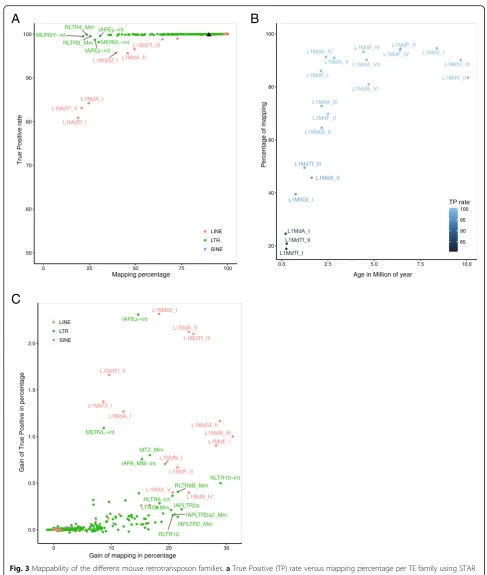
Evolutionarily young families suffer from low percentage of mapping and low true positive rate
Using PE library simulated on the mouse and human ge-nomes, we found that 89.8 and 93.4% of the reads were
uniquely mapped, respectively, with a TP rate of 99.9% (Fig. 3a and Additional file 4: Figure S4A). However, we noticed that some TE families displayed a lower map-ping percentage. This was the case for the L1HS family
–a recent human-specific L1 family- whereby 49% of simulated reads had 88% of TP rate upon unique map-ping. In the mouse genome, 25 families had less than 50% of mapping when uniquely-reported reads were allowed, six of them being annotated in the LINE order. Using estimated evolutionary age of mouse and human LINE1 families [24,25], we found that the youngest fam-ilies were the ones with the lowest percentage of Table 1Statistics for the different mappers with mouse chromosome 1 simulation data
Algorithm Library Mode Mapping percentage True Positive rate Memory in gbytes Running Time in minutes Output size in Mbytes
bowtie PE unique 91.87823 99.97913 0.92 3.00 583.36
bowtie SE unique 92.05224 99.92287 0.69 1.33 311.38
bowtie2 PE unique 94.57886 99.93802 1.28 38.00 572.58
bowtie2 SE unique 92.08282 99.84845 1.18 32.67 294.64
Bwa aln PE unique 94.62602 99.88782 2.66 15.67 553.86
Bwa aln SE unique 96.60879 95.82612 1.85 3.00 310.30
Bwa mem PE unique 94.54763 99.95728 8.77 19.33 563.50
Bwa mem SE unique 92.08548 99.89624 8.40 4.67 299.76
novoalign PE unique 95.55760 99.61473 7.62 226.33 609.08
novoalign SE unique 92.08982 99.92307 7.61 31.67 315.96
STAR PE unique 95.37882 99.80753 16.67 2.00 553.24
STAR SE unique 92.23340 99.73004 16.18 2.33 285.06
bowtie PE random 99.95300 93.67212 0.93 3.00 596.75
bowtie SE random 99.99001 93.04126 0.69 2.33 317.67
bowtie2 PE random 99.99991 95.89737 1.28 35.67 607.86
bowtie2 SE random 99.98093 92.97406 1.18 25.67 324.26
Bwa aln PE random 99.99998 95.94218 2.66 17.67 604.39
Bwa aln SE random 99.99801 93.01531 1.85 4.00 322.33
Bwa mem PE random 99.99998 95.94068 9.42 18.33 612.39
Bwa mem SE random 99.99998 93.01096 7.96 6.33 329.82
novoalign PE random 99.99998 95.84899 7.62 272.00 616.78
novoalign SE random 99.99989 93.03697 7.61 30.67 322.72
STAR PE random 99.94380 95.93094 16.67 5.00 583.02
STAR SE random 99.99024 93.01921 16.26 2.00 314.19
bowtie PE multi 99.95300 92.89719 0.98 18.33 7289.52
bowtie SE multi 99.99001 93.01711 0.71 9.67 2747.64
bowtie2 PE multi 99.99998 76.80653 11.53 28658.67 228148.51
bowtie2 SE multi 99.99998 70.81391 8.74 8205.33 161697.48
novoalign PE multi 99.99998 95.85903 7.62 307.67 2627.41
novoalign SE multi 99.99989 93.03718 7.61 99.00 3176.37
STAR PE multi 99.94380 95.93265 23.95 7.00 2575.59
STAR SE multi 99.99024 93.02143 26.64 4.00 2831.57
mapping and TP rate (Fig.3b and Additional file4: Fig-ure S4B). These two metrics appear therefore as new classifiers to rank L1 subfamilies according to their age. The link between mappability and the age of L1 families was previously reported by Sexton and Han for the hu-man genome [26]. The lower the age is, the lower mapp-ability is as well.
Among the 25 mouse TE families with less than 50% of mapping, 19 were annotated as LTR retrotransposons, with representatives of the three different classes of LTR defined by their similarities to exogenous retroviruses [27]. In the ERV1 class, MURVY-int, its related LTR
(RLTR5_MM) and RLTR4_MM (LTR flanking Murine Leukemia virus elements) had less than 25% of mapping. In the ERVK class, reads corresponding to the IAPEz-int annotation had 28% of mapping. This annotation repre-sents the internal portion of IAPLTR1 elements, which are the young active elements from the IAP subtypes [28]. Finally, MERVL-int annotations, which represent active members of the ERVL class, had only 30% of map-ping [29].
As depicted in Fig. 1b and Additional file 1: Figure S1A, using PE library improved the mapping step by producing a higher percentage of uniquely-mapped Table 2Statistics for the different mappers with human chromosome 1 simulation data
Algorithm Library Mode Mapping percentage True Positive rate Memory in gbytes Running Time in minutes Output size in Mbytes
bowtie PE unique 96.12725 99.99703 1.07 4.00 717.33
bowtie SE unique 96.26772 99.98760 0.80 1.67 381.52
bowtie2 PE unique 97.58530 99.99163 1.42 36.00 720.57
bowtie2 SE unique 96.25897 99.93671 1.33 25.33 375.46
Bwa aln PE unique 97.58600 99.99135 3.01 13.67 703.84
Bwa aln SE unique 98.40958 98.52603 2.18 6.33 381.22
Bwa mem PE unique 97.57669 99.99745 5.65 8.33 715.38
Bwa mem SE unique 96.28285 99.98096 5.45 4.67 379.88
novoalign PE unique 97.83211 99.99187 8.31 99.67 745.17
novoalign SE unique 96.28793 99.98755 8.31 21.00 385.94
STAR PE unique 97.79129 99.99166 18.12 2.33 693.70
STAR SE unique 96.29801 99.96226 17.71 1.00 363.12
bowtie PE random 99.95306 97.78786 1.07 4.00 722.46
bowtie SE random 99.98993 97.48616 0.80 2.33 383.45
bowtie2 PE random 99.99967 98.68378 1.42 47.00 738.73
bowtie2 SE random 99.97064 97.42861 1.33 35.67 391.06
Bwa aln PE random 99.99998 98.68727 3.01 13.67 733.20
Bwa aln SE random 99.99814 97.47704 2.18 7.33 387.77
Bwa mem PE random 99.99998 98.69222 6.05 9.33 744.88
Bwa mem SE random 99.99998 97.47710 5.26 3.00 397.18
novoalign PE random 99.99998 98.68797 8.31 100.67 748.47
novoalign SE random 99.99998 97.48725 8.31 27.67 388.19
STAR PE random 99.94355 98.68767 18.12 3.33 709.61
STAR SE random 99.99103 97.47578 17.70 2.00 378.46
bowtie PE multi 99.95306 97.41469 1.09 4.33 1032.87
bowtie SE multi 99.98993 97.47888 0.82 2.00 540.64
bowtie2 PE multi 99.99998 85.55682 11.92 71150.67 81772.06
bowtie2 SE multi 99.99998 77.59895 6.34 62006.33 123387.84
novoalign PE multi 99.99998 98.68698 8.31 83.67 800.39
novoalign SE multi 99.99998 97.48601 8.31 24.00 572.07
STAR PE multi 99.94355 98.69066 18.12 4.00 754.66
STAR SE multi 99.99103 97.47921 17.64 2.00 541.40
reads: more precisely, 6 and 2% of additional uniquely-mapped reads were gained in genome-wide mouse and human simulations, respectively. However, there was a strong inter-TE family variability in the improvement (Fig. 3c and Additional file 4: Figure S4C). Mouse L1MdGf_II, L1MdA_III and L1MdF_I (Fig. 3c) and hu-man L1PA3 and L1PA2 (Additional file 4: Figure S4C) showed a 30% mapping gain when a PE library was used. The gain was slightly less satisfactory for the youngest
LINE1 families compared to the slightly older families mentioned above, with human L1HS gaining 22% (Add-itional file 4: Figure S4C) and mouse L1MdTf_I, L1MdTf_II and L1MdA_I gaining 10% only on average (Fig. 3c). Similarly, in the human genome, mapping was improved by 20% or more when using PE over SE librar-ies for the youngest, hominoid-specific SVA subtypes (SVA_E and SVA_F) and the youngest subfamilies of the AluY type (AluYa5 and AluYb9)(Additional file4: Figure
A
B
R2 = 0.962
R2 = 0.9657
R2 = 0.3935
R2 = 0.6789
R2 = 0.9793
R2 = 0.9327
R2 = 0.9999
R2 = 0.989
R2 1
R2 = 0.9996 TEtranscripts Unique repEnrich Total repEnrich Fractional TEtranscripts Multiple TEtools FeatureCounts Unique alignments repEnrich Unique SQuIRE FeatureCounts Multiple alignments FeatureCounts Random alignments
0 5 10 15 20 0 5 10 15 20 0 5 10 15 20 0 5 10 15 20 0 5 10 15 20
0 5 10 15 20
0 5 10 15 20
True log2 abundance
Estimated log2 ab
undance
LINE LTR SINE
R2
1 R2
= 0.9523
FeatureCounts Random alignments TEtools
0 5 10 15 20 0 5 10 15 20
0 5 10 15 20
True log2 abundance
Estimated log2 ab
undance
LINE LTR SINE
Fig. 2Comparison of the methods for the quantification of mouse retrotransposon families.aComparison of the estimated abundance versus
A
C
B
IAPEy−int
IAPEz−int
L1MdA_I
L1MdA_II L1MdGf_I
L1MdTf_I L1MdTf_II
L1MdTf_III
MERVL−int MURVY−int
RLTR4_Mm
RLTR5_Mm
50 60 70 80 90 100
0 25 50 75 100
Mapping percentage
True Positive r
ate
LINE LTR SINE
L1MdA_I L1MdA_II L1MdA_III L1MdA_IV
L1MdA_V
L1MdA_VI L1MdA_VII
L1MdTf_I L1MdTf_II
L1MdTf_III
L1MdGf_I
L1MdGf_II
L1MdF_I
L1MdF_II
L1MdF_III L1MdF_IV
L1MdF_V L1MdV_I
L1MdV_II L1MdV_III
20 40 60 80 100
0.0 2.5 5.0 7.5 10.0
Age in Million of year
P
ercentage of mapping
85 90 95 100 TP rate
IAPA_MM−int IAPEz−int
IAPLTR2_Mm IAPLTR2a
IAPLTR2a2_Mm
L1MdA_I
L1MdA_II
L1MdA_III
L1MdA_IV L1MdA_V
L1MdF_I
L1MdF_II L1MdGf_I
L1MdGf_II
L1MdN_I L1MdTf_I
L1MdTf_II
L1MdTf_III
LTRIS_Mm MERVL−int
MT2_Mm
RLTR10
RLTR10−int
RLTR6−int
RLTR6B_Mm
0.0 0.5 1.0 1.5 2.0
0 10 20 30
Gain of mapping in percentage
Gain of True Positive in percentage
LINE LTR SINE
Fig. 3Mappability of the different mouse retrotransposon families.aTrue Positive (TP) rate versus mapping percentage per TE family using STAR
S4C) [29–31]. These results demonstrate the importance of paired-end sequencing libraries, especially for the study of evolutionarily young TE families, provided that they are not completely identical in sequence.
Discussion
Because of their repetitive nature, TE-derived sequences are complex to analyze. The objective of the present study was to provide objective guidelines for the analysis of transpos-able elements within high-throughput sequencing datasets.
Sample and library preparation
At the beginning of a project, experimental design and sample preparation should be conceived in order to re-trieve as much information as possible. Chhangawala et al (2015) already showed that single-end reads increased the number of multi-mapped reads. In contrast, paired-end reads lower the amount of multi-mapped reads and in-crease splicing event detection [32]. Our study confirms the importance of using paired-end library instead of single-end when analyzing TE-derived reads, especially for evolutionarily young families such as SVA_F, AluYb9 and L1HS in the case of human-based analyses. Read length is another parameter to take into consideration when TE-derived reads are sequenced. Chhangawala et al (2015) showed that longer reads increased the uniqueness of se-quenced fragments. Longer fragment size should also help during the mapping step, because the chance for the se-quenced fragment to fall into the boundaries or to cover a polymorphism will increase with the size of the fragment. As a result, the mappability of the given fragment should increase. However, having longer reads is a limitation of the Illumina technology. It is also a limiting factor in some applications, such as ChIP-seq, CUT&RUN and WGBS, where fragment size is determined by obligate fragmenta-tion steps (sonicafragmenta-tion, micrococcal nuclease digesfragmenta-tion or bisulfite-induced DNA degradation).
Mapping
After quality control, read alignment against a reference gen-ome is the first step in NGS analyses. Appropriate parame-ters and algorithms are needed to align as many TE-derived reads as possible. BWA algorithms (mem and aln) and bow-tie2 have no defined parameter for retrieving uniquely mapped reads. In such case, post-mapping filtering has to be applied. In contrast, Novoalign, bowtie and STAR have dedi-cated parameters to report uniquely-mapped reads. However, bowtie does not capitalize on the information of paired-end reads. If a 5’end read -R1 read- is uniquely mapped and the corresponding 3’end read -R2 read- is a multi-mapper, bow-tie discards the valid alignment from the R1 read. In contrast, Novoalign and STAR use the information from the R1 read and increase the percentage of mapping with paired-end library.
In the multiple-hit mode, Bowtie2 searches for up to k valid alignments per read, where k is a threshold given by the user (k was set to 5000 in this study). In Bowtie2’s reference manual, it is mentioned: “Bowtie 2 does not guarantee that the k alignments reported are the best possible in terms of alignment score”(http://bowtie-bio. sourceforge.net/bowtie2/manual.shtml). Other align-ments with different alignment scores are reported in addition to the best alignment, which creates a low true positive rate and a bigger BAM file compared to STAR and Novoalign (Tables1and2).
We found that reporting multi-mapped reads or reporting randomly one position increases the percentage of mapping close to 100% but at the cost of lower precision, which con-firms previous results [11, 33]. Discarding multi-mapped reads is a real cost for evolutionary young families due to quasi-identical copies. However, these families are the ones that are mostly regulated in the genome, by repression his-tone marks and DNA methylation [34,35]. As a conclusion, using multi-mapped reads or reporting randomly one pos-ition has to be done with caution to avoid discarding the most important information of the TE fraction of the genome.
As with the uniquely-mapped reads, STAR and Novoalign were the best compromise to report multi-mapped reads or a random valid alignment. However, Novoalign had a big dis-advantage, its computing time, especially using PE reads. Starting with more than three millions of paired-end reads simulated from the mouse chromosome 1, Novoalign ran-domly aligned this set of reads in 4.5 h (Tables 1 and 2), while STAR completed the same task in 5 min. As the amount of sequenced reads and the number of projects with sequencing data are growing, fast algorithms are requested. This is why we recommend using STAR for the mapping step. Nevertheless, specific parameters have to be adapted for the study of transposable elements. This is especially import-ant for young families that display a low mappability score. Unadapted parameters can mask relevant results or on the contrary, create incorrect conclusions. By default, STAR re-ports up to 10 alignments per read. The ENCODE project recommends to report up to 20 alignments per reads for long RNA sequencing pipeline. These guidelines are adapted for pseudogenes. In the case of TE studies and genomes with high TE content, these parameters have to be tuned (see Methods). A previous study based on ChIP-seq data esti-mated that a threshold of 10,000 positions per read is opti-mal in term of computing time and storage, without significant loss of sequence information (0.25% of reads elim-inated on average) [35].
Quantification of transposable elements
according to the parameters used during the alignment step. We demonstrated that quantification methods rely-ing on uniquely-mapped reads underestimated the abun-dance of the youngest TE families, because of their low level of sequence diversity and consequently, low map-ping performance.
When using reads with multiple hits, we found that reporting randomly one position or weighting multi-mapped reads with the number of hits give rise to the same estimation. However, reporting multi-hits is more consuming in terms of storage and time. In the case of mouse simulation, the output is five times bigger (500 Mbytes to 2500 Mbytes) when multi-hits are reported in comparison to the random mode. The increase in the rate and amount of sequencing data represents a high storage challenge for the community. Data analyses within TE studies has to be conducted with taking care of the amount of processed data. For this reason, we rec-ommend to report randomly one position per read.
We also studied the specific case of TEtools, which quantifies TEs using randomly reported reads with Bow-tie or BowBow-tie2. However, this tool considers a list of TE sequences extracted from a genome or manually anno-tated- as genomic references for the mapping. We showed that, in the case of available assembled genomes, performing the mapping onto the reference genome gives rise to a better estimation of TE quantity in com-parison to the strategy applied by TEtools. Indeed, using only a part of the genome assembly introduces a bias in the alignment by forcing the mapping to this genome extract, the extent of which results from a combination of technology-specific sequencing errors and mismatch allowance in the alignment settings. Consequently, re-gions represented in this genome extract are overesti-mated. The method used by TEtools is analogous to a strategy where TE consensus sequences provided by RepBase are used for the mapping step [36]. Aligning reads against consensus sequences should also lead to an overestimation of the abundance of TEs; it adds more-over another confounding factor by allowing more mis-matches. In the case of available assembly genomes, we therefore recommend to align reads with the reference genome and extract expression with FeatureCounts. Then, for RNA-seq analyses, gene quantification can be performed in the same time taking, advantage of only one step. Gene and transposon-based differential expres-sion should be called in the same analysis, as it is done
inSQuIREandTEtranscripts.
Transposable elements and their evolution
Human and mouse genomes are estimated to contain 48.5 and 41.8% of TEs, respectively. Interestingly, using genome-wide simulation on these species, we observed a higher mappability in the human genome compared to
the mouse one. These differences likely reflect a more recent activity of certain TE families in the mouse gen-ome, and therefore a higher proportion of sequence homology among TE copies. The overview we provide here on the TE-specific mappability rate should help re-searchers qualifying their conclusions made on specific families. For instance, in the mouse, using uniquely-mapped reads on L1 young families, IAPEz and MERVL families will undoubtedly induce an underestimation of their abundance in NGS datasets. We demonstrate and quantify here that significant improvement −20 to 30% of mapping gain- can be obtained for these young TE families by using PE library. This is truly important, par-ticularly in RNA-seq datasets, as these families are the ones that have more intact sequences, including at tran-scription factor binding sites, and therefore the potential for being transcribed.
Conclusions
By comparing different available algorithms with simu-lated data generated onto the mouse and human ge-nomes, we demonstrated the difficulty of analyzing evolutionarily young TE families. Improvements can nonetheless be gained if the following recommendations are followed:
1) paired-end library should be used to increase the uniqueness of sequenced fragments.
2) During the alignment step, STAR is the best compromise between efficiency and speed. Parameters have to be set according to the TE content.
3) Reporting randomly one position and using FeatureCounts to quantify TE families gives the best estimation values.
4) When TE annotation on an assembled genome is available, mapping and quantification should be done with the reference genome.
5) Evolutionarily young families suffer from low mappability rate and are severely underestimated if uniquely-mapped reads are reported.
Methods
Reconstruction of repeatMasker annotations
Transposon annotations were downloaded from the RepeatMasker website (Smit, AFA, Hubley, R & Green,
P. RepeatMasker Open-4.0. 2013–2015 <http://www.
same copy were merged if the distance between them is less than 1000 bp.
Simulation data pipeline
2x100bp paired-end reads were simulated with ART v2.5.8 [22] mimicking Illumina HiSeq 2500 technologies (−m 200 –s 10). Simulated reads overlapping with re-constructed repeatMasker annotation were kept using Bedtools intersectBed v2.21.0.
Mapping comparison
The following tools were used: Bowtie v1.0.0, Novoalign v3.2.11, STAR v2.5.2b, Bowtie2 v2.1.0, BWA aln v0.7.15, BWA mem v0.7.15. All the mappers were run with four threads (except for Novoalign that can be run with only 1 thread). Parameters used for the unique, random and multiple mode are detailed in Additional file5.
Quantification comparison
The following tools were compared. Command lines and parameters are detailed in Additional file5.
repEnrich
as recommended, reads were first mapped with Bowtie v1.2 reporting unique alignments and retrieving multi-hits in fastq files (−m1 --max multimap.fastq). TE fam-ilies were quantified using repEnrich v0.1.
TEtools
repeatMasker annotation was first extended 300 bp upstream and downstream in order to map reads located in the bound-aries. TEtools v1.0.0 was used with Bowtie2 v2.2.4.
TEtranscripts
STAR v2.5.2b was used with the recommended parame-ters (−- outAnchorMultimapNmax 100 --outFilterMulti-mapNmax 100). TEtranscipts v1.5.1 was run using unique and multiple modes.
SQuIRE
To compare TE-estimated abundance with other tools, the same TE annotation was provided to the clean folder (−c option in SQuIRE count). SQuIRE v0.9.9.92 was run.
FeatureCounts unique, random and multiple alignments
featureCounts v1.5.1 was used with specific options (−s 0 -p). The option -M was used for random and multiple counting methods. In the multiple counting method,
−-fraction option was also used in order to weight the counts for multi-mapped reads. Quantification of TE family was performed by summing all copies from each family.
Supplementary information
Supplementary informationaccompanies this paper athttps://doi.org/10. 1186/s13100-019-0192-1.
Additional file 1: Figure S1.Comparison of mapper efficiency with
human simulated data. (A) True Positive (TP) rate versus mapping percentage with chromosome 1 of the human genome. The dots are the average values of three independent simulated libraries. SE and PE refer to single end and paired end, respectively. (B) Use memory, run time and size of the BAM file with chromosome 1 of the human genome. The error bars correspond to standard deviation from three independent simulated libraries.
Additional file 2: Figure S2.Comparison of the methods for the
quantification of human retrotransposon families. (A) Comparison of the estimated abundance versus the true abundance for different quantification methods using human simulated TE-derived library. An R-squared value (R2) was calculated to evaluate the correlation of estimated values between simulated values (B) Comparison of the estimated abun-dance versus the true abunabun-dance for TEtools and when randomly re-ported reads are used for the TE quantification with FeatureCounts (FeatureCounts Random alignments). A PE genome-wide library (10X coverage) was simulated using the human genome with STAR for the mapping.
Additional file 3: Figure S3.Impact of read depth in TE families
quantification. (A) Estimated abundance for different quantification methods and true abundance (Simulated counts) using 5X, 10X, 25X, 50X and 100X coverage on specific mouse TE families. Only these TE families were used for the quantification. (B) Same as in A), with specific human TE families.
Additional file 4: Figure S4.Mappability of the different human
retrotransposon families. (A) True Positive (TP) rate versus mapping percentage per TE family using STAR and paired126 library and human simulated TE-derived reads. Black triangle represents the True Positive rate and percentage of mapping for the entire simulated library (B) Mapping percentage versus age of L1Md families. Dot colors represent the True Positive (TP) rate. Ages are obtained from previously published diver-gence analysis study (25) (C) Gain of True Positive in percentage versus gain of mapping in percentage when PE library are used in comparison to SE library.
Additional file 5.Supplementary methods.
Abbreviations
ERV:Endogenous Retrovirus; LINE: Long INterspersed Element; LTR: Long Terminal Repeat; PE: Paired-End; SE: Single-End; SVA: SINE-R, VNTR, andAlu; TE: Transposable Element; TP: True Positive
Acknowledgements
We would like to thank M. Greenberg for editing the manuscript.
Authors’contributions
AT, NS, EB and DB conceived the study. AT conducted the research and drafted the manuscript with NS and DB. All authors read and approved the final manuscript.
Funding
The laboratory of D.B. is part of the Laboratoire d’Excellence (LABEX) entitled DEEP (11-LBX0044). This research was supported by the ERC (grant ERC-Cog EpiREPRO).
Availability of data and materials
Data sharing not applicable to this article as no datasets were generated or analysed during the current study.
Ethics approval and consent to participate
Not applicable.
Consent for publication
Competing interests
The authors declare that they have no competing interests.
Author details
1Institut Curie, PSL Research University, 75005 Paris, France.2INSERM U900,
75005 Paris, France.3MINES ParisTech, PSL Research University, 75005 Paris, France.4INSERM U934, CNRS UMR 3215, 75005 Paris, France.
Received: 22 July 2019 Accepted: 4 December 2019
References
1. Platt RN, Vandewege MW, Ray DA. Mammalian transposable elements and their impacts on genome evolution. Chromosom Res. 2018;26(1–2):25–43. 2. de Koning APJ, Gu W, Castoe TA, Batzer MA, Pollock DD. Repetitive
elements may comprise over two-thirds of the human genome. PLoS Genet. 2011;7(12):e1002384.
3. Brouha B, Schustak J, Badge RM, Lutz-Prigge S, Farley AH, Moran JV, et al. Hot L1s account for the bulk of retrotransposition in the human population. Proc Natl Acad Sci U S A. 2003;100(9):5280–5.
4. Goodier JL, Ostertag EM, Du K, Kazazian HH Jr. A novel active L1 retrotransposon subfamily in the mouse. Genome Res. 2001;11(10):1677–85. 5. Hancks DC, Kazazian HH. Roles for retrotransposon insertions in human
disease. Mobile DNA. 2016;7:9.
6. Treangen T, Salzberg S. Repetitive DNA and next-generation sequencing: computational challenges and solutions. Nat Rev Genet. 2012;13:36–46. 7. Royo H, Stadler MB, Peters AHFM. Alternative computational analysis shows
no evidence for nucleosome enrichment at repetitive sequences in mammalian spermatozoa. Dev Cell. 2016;37(1):98–104.
8. Marinov GK, Wang J, Handler D, Wold BJ, Weng Z, Hannon GJ, et al. Pitfalls of mapping high-throughput sequencing data to repetitive sequences: Piwi’s genomic targets still not identified. Dev Cell. 2015;32(6):765–71 Elsevier Inc.
9. Fonseca N. A, rung J, Brazma a, Marioni JC. Tools for mapping high-throughput sequencing data. Bioinformatics. 2012;28(24):3169–77. 10. Tsuji J, Weng Z. Evaluation of preprocessing, mapping and postprocessing
algorithms for analyzing whole genome bisulfite sequencing data. Brief Bioinform. 2016;17(6):938–52.
11. Baruzzo G, Hayer KE, Ji Kim E, Di Camillo B, FitzGerald GA, Grant GR. Simulation-based comprehensive benchmarking of RNA-seq aligners. Nat Methods. 2016;4(December):1–9.
12. Caboche S, Audebert C, Lemoine Y, Hot D. Comparison of mapping algorithms used in high-throughput sequencing: application to ion torrent data. BMC Genomics. 2014;15(1):1–16.
13. Lerat E, Fablet M, Modolo L, Lopez-Maestre H, Vieira C. TEtools facilitates big data expression analysis of transposable elements and reveals an antagonism between their activity and that of piRNA genes. Nucleic Acids Res. 2016;45(4):gkw953.
14. Langmead B, Salzberg SL. Fast gapped-read alignment with bowtie 2. Nat Methods. 2012;9(4):357–9.
15. Criscione SW, Zhang Y, Thompson W, Sedivy JM, Neretti N. Transcriptional landscape of repetitive elements in normal and cancer human cells. BMC Genomics. 2014;15(1):583.
16. Langmead B, Trapnell C, Pop M, Salzberg SL. Ultrafast and memory-efficient alignment of short DNA sequences to the human genome. Genome Biol. 2009;10(3):R25.
17. Yang WR, Ardeljan D, Pacyna CN, Payer LM, Burns KH. SQuIRE reveals locus-specific regulation of interspersed repeat expression. Nucleic Acids Res. 2019;47(5):e27.
18. Dobin A, Davis C a, Schlesinger F, Drenkow J, Zaleski C, Jha S, et al. STAR: ultrafast universal RNA-seq aligner. Bioinformatics. 2013;29(1):15–21. 19. Jin Y, Tam OH, Paniagua E, Hammell M. TEtranscripts: a package for
including transposable elements in differential expression analysis of RNA-seq datasets. Bioinformatics. 2015 Nov 15;31(22):3593–9.
20. Li H, Durbin R. Fast and accurate short read alignment with burrows-wheeler transform. Bioinformatics. 2009;25(14):1754–60.
21. Li H. Aligning sequence reads, clone sequences and assembly contigs with BWA-MEM. arXiv Prepr arXiv. 2013;00(00):3.
22. Huang W, Li L, Myers JR, Marth GT. ART: a next-generation sequencing read simulator. Bioinformatics. 2012;28(4):593–4.
23. Liao Y, Smyth GK, Shi W. FeatureCounts: an efficient general purpose program for assigning sequence reads to genomic features. Bioinformatics. 2014;30(7):923–30.
24. Sookdeo A, Hepp CM, McClure M a, Boissinot S. Revisiting the evolution of mouse LINE-1 in the genomic era. Mob DNA. 2013;4(1):3 [cited 2014 Aug 6]. 25. Khan H, Smit A, Boissinot S. Molecular evolution and tempo of amplification
of human LINE-1 retrotransposons since the origin of primates. Genome Res. 2006;16(1):78–87.
26. Sexton CE, Han MV. Paired-end mappability of transposable elements in the human genome. Mobile DNA. 2019;10:29
27. McCarth, EM, McDonald JF. Long terminal repeat retrotransposons ofMus musculus. Genome Biol. 2004;5:R14.
28. Qin C, Wang Z, Shang J, Bekkari K, Liu R, Pacchione S, et al. Intracisternal a particle genes: distribution in the mouse genome, active subtypes, and potential roles as species-specific mediators of susceptibility to cancer. Mol Carcinog. 2010;49(1):54–67.
29. Costas J. Molecular characterization of the recent intragenomic spread of the murine endogenous retrovirus MuERV-L. J Mol Evol. 2003;56(2):181–6. 30. Wang H, Xing J, Grover D. Hedges Kyudong Han DJ, Walker JA, Batzer MA.
SVA elements: a hominid-specific retroposon family. J Mol Biol. 2005;354(4): 994–1007.
31. Batzer MA, Deininger PL. Alu repeats and human genomic diversity. Nat Rev Genet. 2002;3(5):370–9.
32. Chhangawala S, Rudy G, Mason CE, Rosenfeld JA. The impact of read length on quantification of differentially expressed genes and splice junction detection. Genome Biol Genome Biology. 2015;16(1):1–10.
33. Yu X, Guda K, Willis J, Veigl M, Wang Z, Markowitz S, et al. How do alignment programs perform on sequencing data with varying qualities and from repetitive regions? Bio Data Min. 2012;5(1):1.
34. Barau J, Teissandier A, Zamudio N, Roy S, Nalesso V, Hérault Y, et al. The DNA methyltransferase DNMT3C protects male germ cells from transposon activity. Science. 2016;354(6314):909–12.
35. Pezic D, Manakov SA, Sachidanandam R, Aravin AA. piRNA pathway targets active LINE1 elements to establish the repressive H3K9me3 mark in germ cells. Genes Dev. 2014 Jul 1;28(13):1410–28.
36. Bao W, Kojima KK, Kohany O. Repbase update, a database of repetitive elements in eukaryotic genomes. Mob DNA. 2015;6(1):11.
Publisher’s Note