A Technical Assessment of the Utility of Reverse Phase
Protein Arrays for the Study of the Functional Proteome
in Non-microdissected Human Breast Cancers
Bryan T. Hennessy
&Yiling Lu
&Ana Maria Gonzalez-Angulo
&Mark S. Carey
&Simen Myhre
&Zhenlin Ju
&Michael A. Davies
&Wenbin Liu
&Kevin Coombes
&Funda Meric-Bernstam
&Isabelle Bedrosian
&Mollianne McGahren
&Roshan Agarwal
&Fan Zhang
&Jens Overgaard
&Jan Alsner
&Richard M. Neve
&Wen-Lin Kuo
&Joe W. Gray
&Anne-Lise Borresen-Dale
&Gordon B. Mills
Published online: 23 October 2010
#Springer Science+Business Media, LLC 2010
Abstract
Introduction
The lack of large panels of validated
anti-bodies, tissue handling variability, and intratumoral
hetero-geneity potentially hamper comprehensive study of the
functional proteome in non-microdissected solid tumors.
The purpose of this study was to address these concerns
and to demonstrate clinical utility for the functional analysis
of proteins in non-microdissected breast tumors using
Drs. Hennessy and Lu contributed equally to this work.
B. T. Hennessy (*)
Department of Medical Oncology, Beaumont Hospital, Dublin, Ireland
e-mail: [email protected]
B. T. Hennessy
The University of Texas M. D. Anderson Cancer Center (MDACC),
1515 Holcombe Blvd., Houston, TX 77030, USA
B. T. Hennessy
:
A. M. Gonzalez-Angulo:
G. B. Mills Kleberg Center for Molecular Markers,The University of Texas M. D. Anderson Cancer Center (MDACC),
1515 Holcombe Blvd., Houston, TX 77030, USA
Y. Lu
:
A. M. Gonzalez-Angulo:
M. S. Carey:
M. McGahren:
R. Agarwal:
F. Zhang:
G. B. MillsDepartment of Systems Biology, The University of Texas M. D. Anderson Cancer Center (MDACC),
1515 Holcombe Blvd., Houston, TX 77030, USA
A. M. Gonzalez-Angulo
Department of Breast Medical Oncology,
The University of Texas M. D. Anderson Cancer Center (MDACC),
1515 Holcombe Blvd., Houston, TX 77030, USA
S. Myhre
:
A.-L. Borresen-DaleDepartment of Genetics, Institute for Cancer Research,
Norwegian Radium Hospital, Rikshospitalet University Hospital, Oslo, Norway
S. Myhre
:
A.-L. Borresen-DaleFaculty Division, The Norwegian Radium Hospital, Faculty of Medicine, University of Oslo,
Oslo, Norway
Z. Ju
:
W. Liu:
K. CoombesDepartment of Bioinformatics and Computational Biology, The University of Texas M. D. Anderson Cancer Center (MDACC),
1515 Holcombe Blvd., Houston, TX 77030, USA
M. A. Davies
Department of Melanoma Medical Oncology,
The University of Texas M. D. Anderson Cancer Center (MDACC),
1515 Holcombe Blvd., Houston, TX 77030, USA
F. Meric-Bernstam
:
I. BedrosianDepartment of Surgical Oncology, The University of Texas M. D. Anderson Cancer Center (MDACC),
1515 Holcombe Blvd., Houston, TX 77030, USA
J. Overgaard
:
J. AlsnerDepartment of Experimental Clinical Oncology, Aarhus University Hospital,
Aarhus, Denmark
reverse phase protein arrays (RPPA).
Methods
Herein, 82 antibodies that recognize kinase and
steroid signaling proteins and effectors were validated for
RPPA. Intraslide and interslide coefficients of variability
were <15%. Multiple sites in non-microdissected breast
tumors were analyzed using RPPA after intervals of up to
24 h on the benchtop at room temperature following
surgical resection.
Results
Twenty-one of 82 total and phosphoproteins
dem-onstrated time-dependent instability at room temperature
with most variability occurring at later time points between
6 and 24 h. However, the 82-protein functional proteomic
“
fingerprint
”
was robust in most tumors even when
maintained at room temperature for 24 h before freezing.
In repeat samples from each tumor, intratumoral protein
levels were markedly less variable than intertumoral levels.
Indeed, an independent analysis of prognostic biomarkers
in tissue from multiple tumor sites accurately and
repro-ducibly predicted patient outcomes. Significant correlations
were observed between RPPA and immunohistochemistry.
However, RPPA demonstrated a superior dynamic range.
Classification of 128 breast cancers using RPPA identified six
subgroups with markedly different patient outcomes that
demonstrated a significant correlation with breast cancer
subtypes identified by transcriptional profiling.
Conclusion
Thus, the robustness of RPPA and stability of the
functional proteomic
“
fingerprint
”
facilitate the study of the
functional proteome in non-microdissected breast tumors.
Keywords
Functional proteome . RPPA . Breast cancer .
Kinase signaling . Steroid signaling
Abbreviations
AcCoA
acetyl coenzyme A carboxylase
AcCoAp
phosphorylated acetyl coenzyme A carboxylase
at serine 79
AMP
adenosine monophosphate
AMPK
AMP-activated protein kinase
AMPKp
phosphorylated AMP-activated protein kinase
at serine 172
ANOVA
analysis of variance
BCA
bicinchoninic acid
CCNB1
cyclin B1
CCND1
cyclin D1
CCNE1
cyclin E1
CMF
cyclophosphamide, methotrexate,
and 5-fluorouracil chemotherapy
CV
coefficients of variation
DAB
diaminobenzidine
DFS
disease-free survival
EGF
epidermal growth factor
EGFR
epidermal growth factor receptor
ER
α
estrogen receptor alpha
FC
fold change
FFPE
formalin-fixed paraffin-embedded
FISH
fluorescent in situ hybridization
FT
frozen tumor
GSK3
glycogen synthase kinase 3
HER2
human epidermal receptor 2
HR
hormone receptor
IRB
Institutional Review Board
IHC
immunohistochemistry
Log2
log to the base 2
MDACC
The University of Texas M. D. Anderson
Cancer Center
mRNA
messenger ribonucleic acid
mTor
mammalian target of rapamycin
PI3K
phosphatidylinositol-3 kinase
PR
progesterone receptor
RPPA
reverse phase protein lysate array
S
serine
Stat3
signal transducer and activator of transcription
T
threonine
Y
tyrosine
Introduction
Much progress has been made in genomic breast cancer
classification [
1
–
10
]. However, as mRNA levels may not
translate precisely into protein function due to
posttransla-tional modifications and other factors, mRNA profiling may
not be able to fully characterize the functional proteome.
Proteins are the ultimate effectors of cellular outcomes.
Thus, the lack of a validated, practical, moderate- to
high-throughput, quantitative functional proteomics platform
applicable to patient tumors remains a key barrier to the
identification of solid tumor biomarkers.
Traditional protein assays including enzyme-linked
immunosorbent assay, immunoblotting, and
immunohisto-chemistry (IHC) can assess only small numbers of proteins
and are expensive, semiquantitative, and require large
amounts of material. Although mass spectroscopy is
promising, it is not currently sufficiently robust or
cost-effective for clinical implementation.
By providing high-throughput, low-cost, objective
anal-ysis of multiple proteins in small amounts of sample,
reverse phase protein lysate arrays (RPPA) offer an
emerging approach to comprehensive quantitative profiling
of the levels and function of multiple proteins in tumors and
have the potential to map protein levels and function in
intracellular pathways in a comprehensive, convenient, and
sensitive manner [
11–23
].
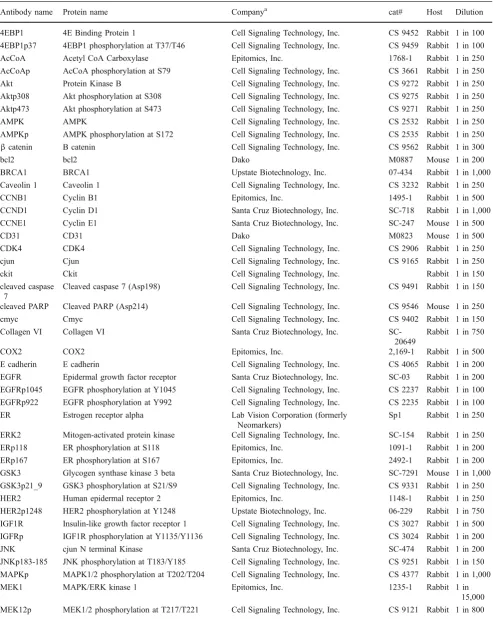
Table 1 Eighty-two monospecific antibodies used in this study
Antibody name Protein name Companya cat# Host Dilution
4EBP1 4E Binding Protein 1 Cell Signaling Technology, Inc. CS 9452 Rabbit 1 in 100
4EBP1p37 4EBP1 phosphorylation at T37/T46 Cell Signaling Technology, Inc. CS 9459 Rabbit 1 in 100
AcCoA Acetyl CoA Carboxylase Epitomics, Inc. 1768-1 Rabbit 1 in 250
AcCoAp AcCoA phosphorylation at S79 Cell Signaling Technology, Inc. CS 3661 Rabbit 1 in 250
Akt Protein Kinase B Cell Signaling Technology, Inc. CS 9272 Rabbit 1 in 250
Aktp308 Akt phosphorylation at S308 Cell Signaling Technology, Inc. CS 9275 Rabbit 1 in 250
Aktp473 Akt phosphorylation at S473 Cell Signaling Technology, Inc. CS 9271 Rabbit 1 in 250
AMPK AMPK Cell Signaling Technology, Inc. CS 2532 Rabbit 1 in 250
AMPKp AMPK phosphorylation at S172 Cell Signaling Technology, Inc. CS 2535 Rabbit 1 in 250
βcatenin B catenin Cell Signaling Technology, Inc. CS 9562 Rabbit 1 in 300
bcl2 bcl2 Dako M0887 Mouse 1 in 200
BRCA1 BRCA1 Upstate Biotechnology, Inc. 07-434 Rabbit 1 in 1,000
Caveolin 1 Caveolin 1 Cell Signaling Technology, Inc. CS 3232 Rabbit 1 in 250
CCNB1 Cyclin B1 Epitomics, Inc. 1495-1 Rabbit 1 in 500
CCND1 Cyclin D1 Santa Cruz Biotechnology, Inc. SC-718 Rabbit 1 in 1,000
CCNE1 Cyclin E1 Santa Cruz Biotechnology, Inc. SC-247 Mouse 1 in 500
CD31 CD31 Dako M0823 Mouse 1 in 500
CDK4 CDK4 Cell Signaling Technology, Inc. CS 2906 Rabbit 1 in 250
cjun Cjun Cell Signaling Technology, Inc. CS 9165 Rabbit 1 in 250
ckit Ckit Cell Signaling Technology, Inc. Rabbit 1 in 150
cleaved caspase 7
Cleaved caspase 7 (Asp198) Cell Signaling Technology, Inc. CS 9491 Rabbit 1 in 150
cleaved PARP Cleaved PARP (Asp214) Cell Signaling Technology, Inc. CS 9546 Mouse 1 in 250
cmyc Cmyc Cell Signaling Technology, Inc. CS 9402 Rabbit 1 in 150
Collagen VI Collagen VI Santa Cruz Biotechnology, Inc.
SC-20649
Rabbit 1 in 750
COX2 COX2 Epitomics, Inc. 2,169-1 Rabbit 1 in 500
E cadherin E cadherin Cell Signaling Technology, Inc. CS 4065 Rabbit 1 in 200
EGFR Epidermal growth factor receptor Santa Cruz Biotechnology, Inc. SC-03 Rabbit 1 in 200
EGFRp1045 EGFR phosphorylation at Y1045 Cell Signaling Technology, Inc. CS 2237 Rabbit 1 in 100
EGFRp922 EGFR phosphorylation at Y992 Cell Signaling Technology, Inc. CS 2235 Rabbit 1 in 100
ER Estrogen receptor alpha Lab Vision Corporation (formerly
Neomarkers)
Sp1 Rabbit 1 in 250
ERK2 Mitogen-activated protein kinase Cell Signaling Technology, Inc. SC-154 Rabbit 1 in 250
ERp118 ER phosphorylation at S118 Epitomics, Inc. 1091-1 Rabbit 1 in 200
ERp167 ER phosphorylation at S167 Epitomics, Inc. 2492-1 Rabbit 1 in 200
GSK3 Glycogen synthase kinase 3 beta Santa Cruz Biotechnology, Inc. SC-7291 Mouse 1 in 1,000
GSK3p21_9 GSK3 phosphorylation at S21/S9 Cell Signaling Technology, Inc. CS 9331 Rabbit 1 in 250
HER2 Human epidermal receptor 2 Epitomics, Inc. 1148-1 Rabbit 1 in 250
HER2p1248 HER2 phosphorylation at Y1248 Upstate Biotechnology, Inc. 06-229 Rabbit 1 in 750
IGF1R Insulin-like growth factor receptor 1 Cell Signaling Technology, Inc. CS 3027 Rabbit 1 in 500 IGFRp IGF1R phosphorylation at Y1135/Y1136 Cell Signaling Technology, Inc. CS 3024 Rabbit 1 in 200
JNK cjun N terminal Kinase Santa Cruz Biotechnology, Inc. SC-474 Rabbit 1 in 200
JNKp183-185 JNK phosphorylation at T183/Y185 Cell Signaling Technology, Inc. CS 9251 Rabbit 1 in 150 MAPKp MAPK1/2 phosphorylation at T202/T204 Cell Signaling Technology, Inc. CS 4377 Rabbit 1 in 1,000
MEK1 MAPK/ERK kinase 1 Epitomics, Inc. 1235-1 Rabbit 1 in
15,000 MEK12p MEK1/2 phosphorylation at T217/T221 Cell Signaling Technology, Inc. CS 9121 Rabbit 1 in 800
addressed prior to its routine application to non-microdissected
human breast tumors. These potential obstacles include:
1. Antibody validation: The validation of a large panel of
antibodies is required since RPPA is essentially a
high-throughput
“
dot-blot
”
and therefore is unable to
distinguish between specific and off-target antibody
–
protein interactions.
2. Variability in tissue handling prior to freezing:
Vari-ability in tissue handling may result in unpredictable
changes in the levels and posttranslational modification
(e.g., phosphorylation) of proteins.
3. Intratumoral heterogeneity: RPPA does not provide
information concerning spatial organization. Intratumoral
heterogeneity in protein expression and activation thus
poses a potential challenge.
Table 1 (continued)
Antibody name Protein name Companya cat# Host Dilution
p110alpha p110alpha subunit of phosphatidylinositol-3-kinase
Epitomics, Inc. 1683-1 Rabbit 1 in 500
p21 p21 Santa Cruz Biotechnology, Inc. SC-397 Rabbit 1 in 250
p27 p27 Santa Cruz Biotechnology, Inc. SC-527 Rabbit 1 in 500
p38 p38 MAPK Cell Signaling Technology, Inc. CS 9212 Rabbit 1 in 300
p38p180_2 p38 MAPK phosphorylation at T180/T182 Cell Signaling Technology, Inc. CS 9211 Rabbit 1 in 250
p53 p53 Cell Signaling Technology, Inc. CS 9282 Rabbit 1 in 3,000
p7056 Kinase p70S6 Kinase Epitomics, Inc. 1494-1 Rabbit 1 in 500
p70S6Kp389 p70S6 Kinase phosphorylation at T389 Cell Signaling Technology, Inc. CS 9205 Rabbit 1 in 200
PAI1 Plasminogen activator inhibitor-1 BD Biosciences 612024 Mouse 1 in 1,000
pcmyc cmyc phosphorylation at T58/S62 Cell Signaling Technology, Inc. CS 9401 Rabbit 1 in 150
PDK1 Phosphoinositide-dependent kinase 1 Cell Signaling Technology, Inc. CS 3062 Rabbit 1 in 250
PDK1p241 PDK1 phosphorylation at S241 Cell Signaling Technology, Inc. CS 3061 Rabbit 1 in 500
PKCalpha Protein Kinase C alpha Upstate Biotechnology, Inc. 05-154 Mouse 1 in 2,000
PKCaphap657 PKCalpha phosphorylation at S657 Upstate Biotechnology, Inc. 06-822 Rabbit 1 in 3,000
pmTOR mTOR phosphorylation at S2448 Cell Signaling Technology, Inc. CS 2971 Rabbit 1 in 150
PR Progesterone receptor Epitomics, Inc. 1483-1 Rabbit 1 in 400
PTEN PTEN Cell Signaling Technology, Inc. CS 9552 Rabbit 1 in 500
Rab25 Rab25 Courtesy Dr. Kwai Wa Cheng, MDACC Covance Rabbit 1 in 4,000
Rb Retinoblastoma Cell Signaling Technology, Inc. CS 9309 Mouse 1 in 3,000
Rbp Rb phosphorylation at S807/S811 Cell Signaling Technology, Inc. CS 9308 Rabbit 1 in 250
S6 S6 ribosomal protein Cell Signaling Technology, Inc. CS 2217 Rabbit 1 in 200
S6p235–236 S6 phosphorylation at S235/S236 Cell Signaling Technology, Inc. CS 2211 Rabbit 1 in 3,000 S6p240_4 S6 phosphorylation at S240/S244 Cell Signaling Technology, Inc. CS 2215 Rabbit 1 in 3,000
SGK Serum Glucocorticoid Kinase Cell Signaling Technology, Inc. CS 3272 Rabbit 1 in 250
SGKp SGK phosphorylation at S78 Cell Signaling Technology, Inc. CS 3271 Rabbit 1 in 250
src Src Upstate Biotechnology, Inc. 05-184 Mouse 1 in 200
srcp416 src phosphorylation at Y416 Cell Signaling Technology, Inc. CS 2101 Rabbit 1 in 150
srcp527 src phosphorylation at Y527 Cell Signaling Technology, Inc. CS 2105 Rabbit 1 in 400
stat3 Signal transducer and activator of transcription 3 Upstate Biotechnology, Inc. 06-596 Rabbit 1 in 500
stat3p705 stat3 phosphorylation at S705 Cell Signaling Technology, Inc. CS 9131 Rabbit 1 in 500
stat3p727 stat3 phosphorylation at S727 Cell Signaling Technology, Inc. CS 9134 Rabbit 1 in 250
stat6p641 stat6 phosphorylation at Y641 Cell Signaling Technology, Inc. CS 9361 Rabbit 1 in 150
stathmin Stathmin Epitomics, Inc. 1972-1 Rabbit 1 in 500
TSC2 Tuberous Sclerosis Kinase 2 Epitomics, Inc. 1613-1 Rabbit 1 in 500
TSC2p TSC2 phosphorylation at T1462 Cell Signaling Technology, Inc. CS 3617 Rabbit 1 in 200
VEGFR2 KDR2/VEGF Receptor 2 Cell Signaling Technology, Inc. CS 2479 Rabbit 1 in 700
XIAP X linked inhibitor of apoptosis Cell Signaling Technology, Inc. CS 2042 Rabbit 1 in 200
aCompanies—Abcam, Inc. (Cambridge, MA), BD Biosciences (San Jose, CA), Cell Signaling Technology, Inc. (Danvers, MA), Dako (Carpinteria, CA),
These problems could clearly impair the integrity of data
derived from the study of the functional proteome in human
breast tumors using RPPA. Thus, the goals of this study
were:
a. to address these obstacles to the successful application
of RPPA to the study of non-microdissected human
breast tumors
b. to investigate reproducibility and the correlation of
RPPA with standard IHC in human breast tumors
c. to evaluate the potential clinical utility of this approach for
the analysis of the breast cancer functional proteome.
Methods
Antibodies and Reagents
Eighty-two antibodies, chosen because of the importance of
the detected proteins to breast carcinogenesis [
24
–
44
], were
used (Table
1
). The AKT inhibitor perifosine was obtained
from Keryx Pharmaceuticals (New York, NY). The
phosphatidylinositol-3 kinase inhibitor LY294002 was
obtained from Calbiochem (San Diego, CA). Rapamycin
was obtained from Cell Signaling, Inc. (Danvers, MA).
Epidermal growth factor (EGF) was purchased from R&D
Systems, Inc. (Minneapolis, MN).
Cell Lines and Tumor Samples
The MDAMB231, MDAMB468, MCF7, T47D, ZR75-1,
OVCAR3, and SKOV3 cell lines were obtained from the
American Type Culture Collection (Manassas, VA). Protein
lysates of 52 breast cancer cell lines were prepared as
previously described [
29
]. The human tumor sets used
herein were obtained using Institutional Review
Board-approved protocols and are as follows:
1. Set A (128 tumors): For comparison of RPPA with
transcriptional profiling (e.g., for protein
–
mRNA
cor-relations), 128 stored primary breast tumors were
obtained from patients treated in the Danish DBCG82
b and c studies [
45
] (Table
2
).
2. Set B (ten tumors): For the studies of intratumoral
heterogeneity and total and phosphoprotein stability, a
prospective study was undertaken to collect primary
breast tissue at breast surgery in ten patients with breast
cancer under an Institutional Review Board
(IRB)-approved protocol. Each tumor was sectioned with
assistance from a breast pathologist and immediately
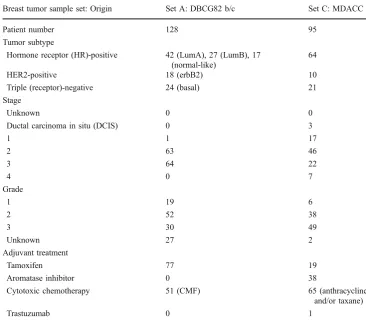
Breast tumor sample set: Origin Set A: DBCG82 b/c Set C: MDACC
Patient number 128 95
Tumor subtype
Hormone receptor (HR)-positive 42 (LumA), 27 (LumB), 17 (normal-like)
64
HER2-positive 18 (erbB2) 10
Triple (receptor)-negative 24 (basal) 21
Stage
Unknown 0 0
Ductal carcinoma in situ (DCIS) 0 3
1 1 17
2 63 46
3 64 22
4 0 7
Grade
1 19 6
2 52 38
3 30 49
Unknown 27 2
Adjuvant treatment
Tamoxifen 77 19
Aromatase inhibitor 0 38
Cytotoxic chemotherapy 51 (CMF) 65 (anthracycline
and/or taxane)
Trastuzumab 0 1
Table 2 Clinical details of
human breast tumors utilized in this study
snap frozen (three pieces) or left at room temperature in
closed eppendorf tubes without any added buffer for
0.5/1/2/4/6/24 h (1 piece/time point) prior to freezing
(
−
85°C). Protein was extracted from each piece of
tumor without thawing.
3. Set C (95 tumors): Ninety-five stored primary breast
tumors were obtained from the breast tumor frozen
tissue bank at M. D. Anderson Cancer Center under an
IRB-approved protocol (Table
2
). Protein was extracted
from these 95 tumors, including from two independent
sections (
“
biologic replicates
”
) derived from 49 of the
95 tumors.
Note that Table
2
does not show the clinical data for Set
B since the clinical data for this set were not utilized in this
study.
MDAMB231 and MDAMB435 breast cancer xenografts
were assessed for total and phosphoprotein stability using
the same approach as with human tumor set B above. After
animal sacrifice, the xenograft tumors were sectioned and
immediately snap frozen or left at room temperature in
closed eppendorf tubes without any added buffer for 0.5/1/
2/4/6 h (1 piece/time point) prior to freezing (
−
85°C). As
with the human tumors, protein was extracted from each
piece of tumor without thawing.
Lysate Preparation and Array Spotting
Breast cancer cell lines were cultured in their optimal
medium (recommended by the American Type Culture
Collection) with 5% fetal bovine serum in 6-well plates.
For experiments involving cell line treatment or
stimula-tion, the cells were starved overnight and treated with
inhibitor with or without EGF stimulation (20 ng/ml for
10 min) where indicated. Cells were then washed twice
with PBS and lysed in ice-cold lysis buffer (1% Triton
X-100, 50 mm HEPES, pH 7.4, 150 mM NaCl, 1.5 mM
MgCl
2, 1 mM EGTA, 100 mM NaF, 10 mM Na
pyrophosphate, 1 mM Na
3VO
4, 10% glycerol)
supple-mented with proteinase inhibitors (Roche Applied Science,
Indianapolis, IN). Cellular protein concentration was
determined by bicinchoninic acid reaction (Pierce, Rockford,
IL). Frozen tumor tissue (
≤
10 mg) was homogenized after
macrodissection without microdissection in lysis buffer at
40 mg/ml by PowerGen polytron homogenizer (Fisher
Scientific, Hampton, NH) and concentration of the protein
lysates corrected to 1.33 mg/ml. After centrifugation,
post-nuclear detergent lysates (three parts) were boiled with a
solution (one part) of 4XSDS (90%)/B mercaptoethanol
(10%). Five serial 2-fold dilutions were performed in lysis
buffer containing 1% SDS (dilution buffer). The diluted
lysates were spotted on nitrocellulose-coated FAST slides
(Whatman, Schleicher & Schuell BioScience, Inc., Keene,
NH) by a robotic GeneTAC (Genomic Solutions, Inc., Ann
Arbor, MI) G3 arrayer or an Aushon Biosystems (Burlington,
MA) 2,470 arrayer.
Antibody Probing and Signal Detection of RPPA
The DAKO (Carpinteria, CA) catalyzed signal amplification
system was used for antibody blotting. Each slide was
incubated with a primary antibody (Table
1
) in the appropriate
dilution. The signal was captured by biotin-conjugated
secondary antibody and amplified by tyramide deposition.
The analyte was detected by avidin-conjugated peroxidase
reactive to its substrate chromogen diaminobenzidine.
Sub-sequently, the slides were individually scanned, analyzed,
and quantitated using MicroVigene software (VigeneTech
Inc., North Billerica, MA). This software provides automated
spot identification, background correction, and individual
spot intensity determination (expressed in logarithmic units).
Immunoblotting
Lysates were prepared as described above. Proteins were
resolved in SDS-PAGE and transferred to PVDF
mem-branes. The membranes were blocked by 5% BSA and
hybridized with different primary antibodies as indicated.
Signals were captured by horse radish
peroxidase-conjugated secondary antibody and visualized by enhanced
chemiluminescence (Amersham Pharmacia Biotech,
Piscat-away, NJ). The abundance of immunoreactive protein was
quantified using a computing densitometer (NIH Imaging)
and presented as arbitrary units of density.
Transcriptional Profiling
Expression data for Set A (Table
2
) were generated at the
Norwegian Radium Hospital using the Applied Biosystems
Human Genome Survey Microarray version 2.0 consisting
of whole genome arrays spotted with 32,878 probes
covering 29,098 genes. Signal was detected by
chemilumi-nescence in a single channel system. Details can be found
at the website:
http://www3.appliedbiosystems.com/cms/
groups/mcb_marketing/documents/generaldocuments/
cms_040420.pdf
Statistical Analysis
R and NCSS (Kaysville, Utah) software were used. The
spot signal intensity data from MicroVigene are processed
by the R package SuperCurve (version 1.01) [
18
], available
at
“http://bioinformatics.mdanderson.org/OOMPA
.
”
A
of each protein on the
x
-axis using the non-parametric,
monotone increasing B-spline model (Fig.
1
) [
18
]. The
protein concentrations are derived from supercurve for each
sample lysate on the slide by curve fitting and then
normalized by median polish. Each total and
phosphopro-tein measurement is subsequently corrected for loading
using the average expression of all measured proteins. For
the study of total and phosphoprotein stability, the
expression of each protein in the three immediately frozen
replicate sections of ten primary breast tumors was
a
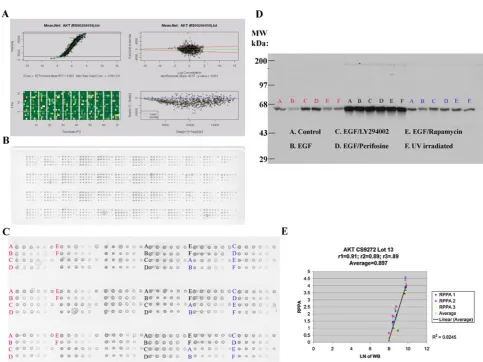
Fig. 1 aAkt andb Aktp473 antibody validation for reverse phase
protein array (RPPA). MDAMB468 (red), ZR75-1 (black) and T47D (blue) cells were left untreated followed by no stimulation (control) or by stimulation with epidermal growth factor (EGF) or were treated with LY294002 (phosphatidylinositol-3-kinase (PI3K) inhibitor), perifosine (Akt inhibitor), rapamycin (mTOR inhibitor), or ultraviolet (UV) irradiation and then stimulated with epidermal growth factor (EGF) in the case of treatment with the three inhibitors. Lysates were then probed with antibody to total Akt (a) or to phosphorylated Akt at serine 473 (Aktp473,b) by RPPA in triplicate (panels A–C) and by western blotting (panel D) and the derived signals for total Akt and for Aktp473 were quantified and correlated (panel Ein a and b). For RPPA, each lysate was arrayed in five serial 2-fold dilutions on nitrocellulose slides (with increasing dilution fromlefttorighton each slide for each lysate as shown inpanel B). A control spot (a mixed cell line lysate) was placed at the end of each sample lysate’s five serial 2-fold dilution series to give six spots. Four samples are arrayed in this fashion in each grid of 24 spots on the nitrocellulose slides shown.
The correlation coefficients between signals derived using RPPA and western blotting for Akt and Aktp473 were 0.897 and 0.93, respectively (panel Einaandb). These correlation coefficients were based on 18 data points as shown and indicate valid antibodies for RPPA.Panel Ainaandbdemonstrates the process of curve fitting for RPPA that is applied by the R package SuperCurve (version 1.01)18.
averaged, measurements at six later time points (0.5/1/2/4/
6/24 h) were treated as separate observations, and the
effects of time to freezing on total and phosphoprotein
expression were tested using an analysis of variance
(ANOVA) model. The effects of intratumoral and
intertu-moral variability on protein expression were tested by
applying ANOVA models to RPPA data derived from the
three immediately frozen replicate sections of ten breast
tumors. To estimate disease-free survival (DFS), the time to
any breast cancer relapse or any death (whichever came
first) since diagnosis was computed. DFS time was
censored at last follow-up if neither relapse nor death
occurred. To estimate distant metastasis-free survival, the
time to distant breast cancer metastasis since diagnosis was
computed. Distant metastasis-free survival time was
cen-sored at last follow-up or death if no distant metastasis was
detected. To estimate overall survival (OS), the time to
death from any cause since diagnosis was computed. OS
time was censored at last follow-up if death had not
occurred. Survival probabilities were estimated using
Kaplan
–
Meier
’
s product limit method.
Results
A. Obstacles to the Successful Application of RPPA to the
Study of Non-microdissected Breast Tumors:
Obstacle 1: Antibody Validation
Antibody validation for RPPA is
criti-cal to ensure that the detected signal is
representative of the protein of interest.
We chose 82 antibodies that recognize
kinase and steroid signaling events and
their effectors (Table
1
) because of the
importance of these proteins to breast
carcinogenesis [
24–44
]. The relative
pro-tein levels derived from RPPA [
18
] were
correlated with the density of the
appro-priately sized band on immunoblots of the
corresponding protein lysates. An
arbi-trary correlation coefficient (
R
) of
≥
0.7 is
required for each antibody (Fig.
1
).
Anti-bodies that interact with multiple
“
off-b
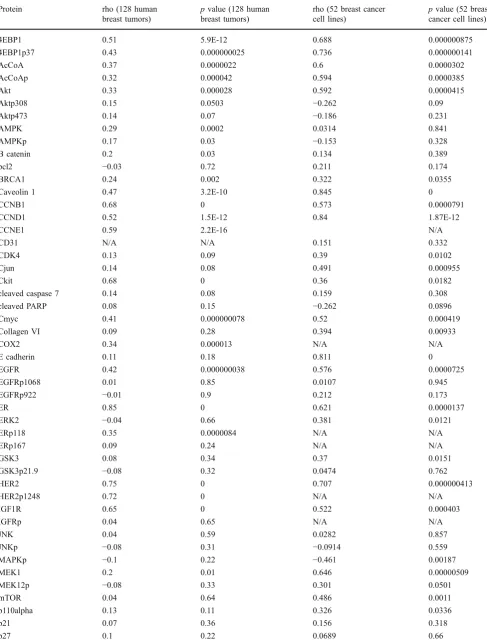
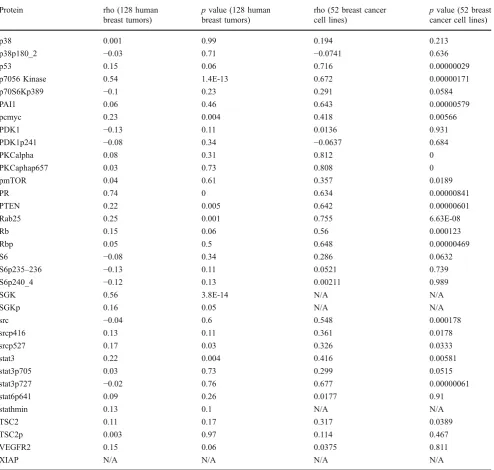
Table 3 Eighty-two protein–mRNA correlation coefficients (rho) and correspondingpvalues
Protein rho (128 human
breast tumors)
pvalue (128 human breast tumors)
rho (52 breast cancer cell lines)
pvalue (52 breast cancer cell lines)
4EBP1 0.51 5.9E-12 0.688 0.000000875
4EBP1p37 0.43 0.000000025 0.736 0.000000141
AcCoA 0.37 0.0000022 0.6 0.0000302
AcCoAp 0.32 0.000042 0.594 0.0000385
Akt 0.33 0.000028 0.592 0.0000415
Aktp308 0.15 0.0503 −0.262 0.09
Aktp473 0.14 0.07 −0.186 0.231
AMPK 0.29 0.0002 0.0314 0.841
AMPKp 0.17 0.03 −0.153 0.328
B catenin 0.2 0.03 0.134 0.389
bcl2 −0.03 0.72 0.211 0.174
BRCA1 0.24 0.002 0.322 0.0355
Caveolin 1 0.47 3.2E-10 0.845 0
CCNB1 0.68 0 0.573 0.0000791
CCND1 0.52 1.5E-12 0.84 1.87E-12
CCNE1 0.59 2.2E-16 N/A
CD31 N/A N/A 0.151 0.332
CDK4 0.13 0.09 0.39 0.0102
Cjun 0.14 0.08 0.491 0.000955
Ckit 0.68 0 0.36 0.0182
cleaved caspase 7 0.14 0.08 0.159 0.308
cleaved PARP 0.08 0.15 −0.262 0.0896
Cmyc 0.41 0.000000078 0.52 0.000419
Collagen VI 0.09 0.28 0.394 0.00933
COX2 0.34 0.000013 N/A N/A
E cadherin 0.11 0.18 0.811 0
EGFR 0.42 0.000000038 0.576 0.0000725
EGFRp1068 0.01 0.85 0.0107 0.945
EGFRp922 −0.01 0.9 0.212 0.173
ER 0.85 0 0.621 0.0000137
ERK2 −0.04 0.66 0.381 0.0121
ERp118 0.35 0.0000084 N/A N/A
ERp167 0.09 0.24 N/A N/A
GSK3 0.08 0.34 0.37 0.0151
GSK3p21.9 −0.08 0.32 0.0474 0.762
HER2 0.75 0 0.707 0.000000413
HER2p1248 0.72 0 N/A N/A
IGF1R 0.65 0 0.522 0.000403
IGFRp 0.04 0.65 N/A N/A
JNK 0.04 0.59 0.0282 0.857
JNKp −0.08 0.31 −0.0914 0.559
MAPKp −0.1 0.22 −0.461 0.00187
MEK1 0.2 0.01 0.646 0.00000509
MEK12p −0.08 0.33 0.301 0.0501
mTOR 0.04 0.64 0.486 0.0011
p110alpha 0.13 0.11 0.326 0.0336
p21 0.07 0.36 0.156 0.318
target
”
western blot bands or a dominant
non-specific band are not suitable for
RPPA, and an alternative antibody is
sought. For phospho-specific (p)
antibod-ies, cell lines are manipulated in a fashion
(e.g., with inhibitors and growth factors)
that will alter the phosphorylation site to
ensure that observed signal changes are
correlated between immunoblotting and
RPPA (Fig.
1
). For proteins whose
ex-pression does not demonstrate a sufficient
dynamic range to facilitate antibody
val-idation, siRNA is used to manipulate the
signal to allow evaluation of RPPA
–
immunoblotting correlations. Further,
protein and mRNA levels are compared
Table 3 (continued)
Protein rho (128 human
breast tumors)
pvalue (128 human breast tumors)
rho (52 breast cancer cell lines)
pvalue (52 breast cancer cell lines)
p38 0.001 0.99 0.194 0.213
p38p180_2 −0.03 0.71 −0.0741 0.636
p53 0.15 0.06 0.716 0.00000029
p7056 Kinase 0.54 1.4E-13 0.672 0.00000171
p70S6Kp389 −0.1 0.23 0.291 0.0584
PAI1 0.06 0.46 0.643 0.00000579
pcmyc 0.23 0.004 0.418 0.00566
PDK1 −0.13 0.11 0.0136 0.931
PDK1p241 −0.08 0.34 −0.0637 0.684
PKCalpha 0.08 0.31 0.812 0
PKCaphap657 0.03 0.73 0.808 0
pmTOR 0.04 0.61 0.357 0.0189
PR 0.74 0 0.634 0.00000841
PTEN 0.22 0.005 0.642 0.00000601
Rab25 0.25 0.001 0.755 6.63E-08
Rb 0.15 0.06 0.56 0.000123
Rbp 0.05 0.5 0.648 0.00000469
S6 −0.08 0.34 0.286 0.0632
S6p235–236 −0.13 0.11 0.0521 0.739
S6p240_4 −0.12 0.13 0.00211 0.989
SGK 0.56 3.8E-14 N/A N/A
SGKp 0.16 0.05 N/A N/A
src −0.04 0.6 0.548 0.000178
srcp416 0.13 0.11 0.361 0.0178
srcp527 0.17 0.03 0.326 0.0333
stat3 0.22 0.004 0.416 0.00581
stat3p705 0.03 0.73 0.299 0.0515
stat3p727 −0.02 0.76 0.677 0.00000061
stat6p641 0.09 0.26 0.0177 0.91
stathmin 0.13 0.1 N/A N/A
TSC2 0.11 0.17 0.317 0.0389
TSC2p 0.003 0.97 0.114 0.467
VEGFR2 0.15 0.06 0.0375 0.811
XIAP N/A N/A N/A N/A
(Table
3
); when levels are concordant, as
they are with 41% of assayed targets in
human breast tumors in Set A (at
p
≤
0.05), this provides additional confidence
in the validity of the RPPA analysis (these
correlations must be interpreted in the
context of the other data above for
antibody validation since a poor protein
–
mRNA correlation does not necessarily
indicate that an antibody is not valid).
Using these approaches, we continue to
expand the antibody list with particular
emphasis on proteins implicated in
breast carcinogenesis. A web site will
be made available with publication of
this manuscript with demonstration of
the utility of all antibodies in Table
1
in
the format shown in Fig.
1
(
http://
10.106.178.152:8080/AntibodyDatabase/
index.html
).
Obstacle 2: Variability in Tissue Handling Prior to
Freezing
A major challenge to the study of
patient tumors is the potential that protein
levels and particularly posttranslational
modifications will change between the
time of tissue collection and analysis. To
evaluate total and phosphoprotein
stabili-ty, ten human breast tumors (Set B) were
obtained at surgery, processed, and
ana-Cleaved caspase 7 Cleaved PARP S6p235.236
AMPKp MAPKp srcp527
4EBP1 4EBP1p37 Akt
0 0.5 1 2 4 6 24
Time series (hours)
0 0.5 1 2 4 6 24
Time series (hours)
0 0.5 1 2 4 6 24 Time series (hours)
Protein expression (log)
Protein expression (log)
Protein expression (log)
Protein expression (log)
Protein expression (log)
Protein expression (log)
Protein expression (log)
Protein expression (log)
Protein expression (log)
0 0.5 1 2 4 6 24
Time series (hours)
0 0.5 1 2 4 6 24
Time series (hours)
0 0.5 1 2 4 6 24 Time series (hours)
0 0.5 1 2 4 6 24
Time series (hours)
0 0.5 1 2 4 6 24
Time series (hours)
0 0.5 1 2 4 6 24 Time series (hours)
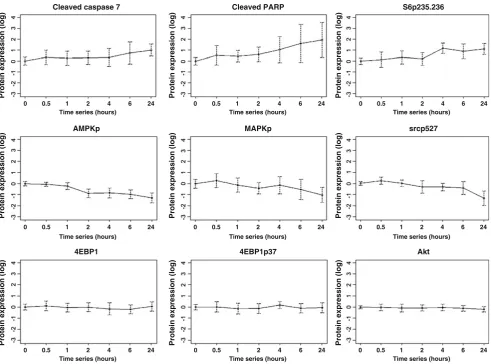
Fig. 2 Changes in proteins with increasing time to breast tumor
freezing. Ten human breast tumors were collected immediately at surgery and frozen after increasing time intervals up until 24 h. Of the nine total and phosphoproteins shown as examples, three showed a progressive increase with increasing time to breast tumor freezing (cleaved caspase 7, cleaved PARP, and phosphorylation of S6 at serines 235/236 (S6p235–236)), three showed a progressive deterio-ration with increasing time to breast tumor freezing (phosphorylation of AMP-activated protein kinase (AMPKp), MAPK (MAPKp), and src
lyzed by RPPA (see the
“
Methods
”
section). Strikingly, the levels of 61/82
proteins including several
phosphopro-teins were stable (defined using an
ANOVA
p
≤
0.05) up to 24 h after tumor
collection before freezing (Figs.
2
and
3
and Table
4
). Indeed, only 13 of the
assessed proteins actually showed a 40%
or greater percentage change from
base-line with increasing time to freezing
(Table
4
). Thus, most of proteins were
very stable in the samples over the
analyzed time course. Of all proteins,
only phosphorylated acetyl coenzyme A
carboxylase at serine 79 showed marked
loss with an estimated half-life of 2.7 h.
The remainder of the proteins did not
reach an estimated half-life by 24 h at
room temperature prior to freezing.
In-deed, the RPPA data demonstrated less
variability over time than western
blot-ting (Fig.
3
). This could be due to RPPA
being a
“
dot-blot
”
approach which is less
susceptible to proteolysis than
immuno-blotting. Thus, although human breast
tumors should be frozen as soon as
possible after excision to preserve the
ability to assess signaling events, many
total and phosphoprotein levels do not
change markedly over time, potentially
allowing analysis of stable proteins in
samples that have not been rapidly
frozen. Importantly, this was also
con-firmed in MDAMB231 and MDAMB435
breast cancer xenografts. For example, no
significant changes (at
p
≤
0.05) were
observed in phosphorylation of AKT
(Ser473), glycogen synthase kinase 3
(Ser21/9), mammalian target of
rapamy-cin (Ser2448), p70S6K (Thr389), or JNK
(Thr183/Tyr185) after xenograft tissue
was left at room temperature for up to
6 h from the time of animal sacrifice
before freezing. In contrast, as in human
tumor tissue (Table
4
), phosphorylation of
MAPK (Thr202/Tyr204) and p38 (T180/
182) did decrease over time prior to
freezing. Importantly, in neither the
hu-man tumor nor the xenograft experiments
did we observe early increases in the
majority of phosphorylation events when
tumor tissue was left at room temperature
for 30 min prior to freezing.
0 0 0 0 5 hrs 1 hr 2 hrs 4 hrs 6 hrs 24 hrs
ERK2
MAPKp
Akt
Aktp473
AMPK
AMPKp
Fig. 3 Changes in total and phosphoproteins with increasing time to
breast tumor freezing. Six western blots demonstrate stability of mitogen-activated protein kinase (ERK2), Akt, and AMP-activated protein kinase (AMPK) expression and of Akt phosphorylation (Aktp473) with increasing time to tumor freezing. In contrast, consistent with RPPA data, a progressive deterioration was seen with increasing time to breast tumor freezing in the phosphorylation of mitogen-activated protein kinase (MAPKp) and in the phosphorylation of AMPK (AMPKp). The time before tumor freezing is shown along thetopof the figure
Table 4 Time-dependent variability in total and phospho (p) protein expression with increasing time to breast tumor freezing
Apoptosis: Cleaved caspase 7, cleaved PARP
Energy sensor pathway: AcCoAp (i.e., phospho-AcCoA), AMPKp, TSC2, TSC2p Hormonal signaling: ERp167, PR
Phosphatidylinositol-3-kinase (PI3K) pathway: Aktp308, p110 alpha, PTEN
Src-/mitogen-activated protein kinase (MAPK) pathway: MAPKp, p38, p38p180_182, srcp527 Translation: total p70S6 Kinase, S6p235–236
Other: B catenin, COX2, E cadherin, stat3p705
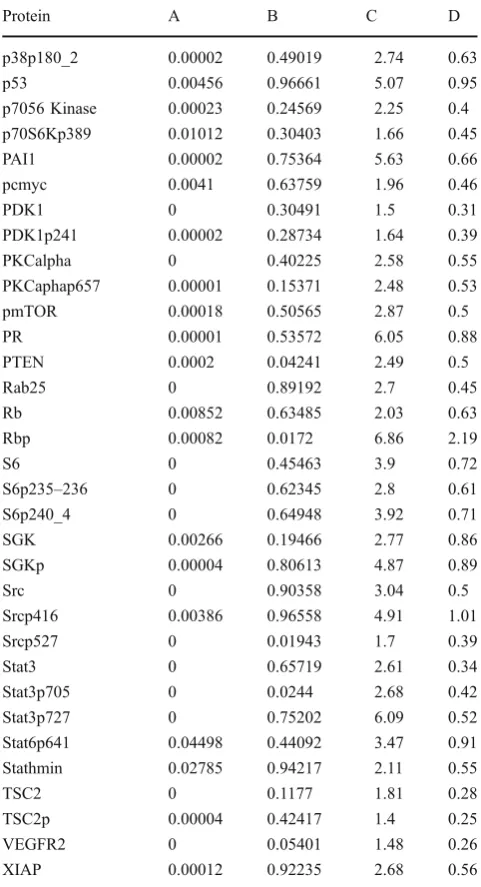
Table 5 Inter- versus intratumoral heterogeneity
Protein A B C D
4EBP1 0 0.1219 2.47 0.52
4EBP1p37 0 0.94719 2.55 0.47
AcCoA 0 0.17774 4.15 0.79
AcCoAp 0 0.11817 4.4 0.85
Akt 0.00029 0.95098 1.51 0.41
Aktp308 0.00002 0.25644 3.57 0.72
Aktp473 0.00261 0.35564 3.21 0.91
AMPK 0.01602 0.83813 2.28 0.53
AMPKp 0.00009 0.84344 2.15 0.56
B catenin 0 0.00737 3.18 0.49
Bcl2 0 0.24915 4.46 0.87
BRCA1 0.01167 0.74802 2.35 0.71
Caveolin 1 0.00001 0.06764 4.99 1.19
CCNB1 0 0.54217 4.72 0.72
CCND1 0 0.88443 2.31 0.27
CCNE1 0 0.07275 3.98 0.5
CD31 0 0.18066 4.39 0.6
CDK4 0 0.11566 1.75 0.34
cjun 0.00001 0.84812 3.0 0.57
ckit 0 0.765 6.32 1.06
cleaved caspase 7 0 0.42661 3.73 0.45
cleaved PARP 0.00004 0.72989 3.64 0.84
cmyc 0.00006 0.45661 1.95 0.45
Collagen.VI 0 0.01389 6.17 1.2
COX2 0.00041 0.1167 1.76 0.49
E cadherin 0 0.45206 2.79 0.53
EGFR 0 0.02095 2.87 0.47
EGFRp1045 0.08967 0.57635 6.49 1.75
EGFRp922 0.00011 0.72074 3.94 0.8
ER 0 0.30028 6.78 1.17
ERK2 0.00003 0.69498 2.6 0.54
ERp118 0.00001 0.37716 4.04 0.9
ERp167 0.00001 0.09904 1.74 0.3
GSK3 0.00002 0.69576 3.17 0.57
GSK3p21.9 0.00002 0.25323 6.84 1.38
HER2 0 0.10058 10.25 1.2
HER2p1248 0 0.16499 7.04 0.77
IGF1R 0 0.73024 3.5 0.45
IGFRp 0.00446 0.28133 2.72 0.65
JNK 0.05615 0.99488 2.06 0.58
JNKp 0 0.11185 2.88 0.32
MAPKp 0 0.03292 4.38 0.96
MEK1 0.00003 0.66118 1.65 0.42
MEK12p 0.00026 0.97569 1.21 0.35
mTOR 0 0.45838 2.44 0.33
p110alpha 0 0.96268 1.97 0.31
p21 0.00007 0.71856 2.47 0.4
p27 0 0.27306 2.18 0.28
p38 0.00049 0.47474 1.68 0.39
Table 5 (continued)
Protein A B C D
p38p180_2 0.00002 0.49019 2.74 0.63
p53 0.00456 0.96661 5.07 0.95
p7056 Kinase 0.00023 0.24569 2.25 0.4
p70S6Kp389 0.01012 0.30403 1.66 0.45
PAI1 0.00002 0.75364 5.63 0.66
pcmyc 0.0041 0.63759 1.96 0.46
PDK1 0 0.30491 1.5 0.31
PDK1p241 0.00002 0.28734 1.64 0.39
PKCalpha 0 0.40225 2.58 0.55
PKCaphap657 0.00001 0.15371 2.48 0.53
pmTOR 0.00018 0.50565 2.87 0.5
PR 0.00001 0.53572 6.05 0.88
PTEN 0.0002 0.04241 2.49 0.5
Rab25 0 0.89192 2.7 0.45
Rb 0.00852 0.63485 2.03 0.63
Rbp 0.00082 0.0172 6.86 2.19
S6 0 0.45463 3.9 0.72
S6p235–236 0 0.62345 2.8 0.61
S6p240_4 0 0.64948 3.92 0.71
SGK 0.00266 0.19466 2.77 0.86
SGKp 0.00004 0.80613 4.87 0.89
Src 0 0.90358 3.04 0.5
Srcp416 0.00386 0.96558 4.91 1.01
Srcp527 0 0.01943 1.7 0.39
Stat3 0 0.65719 2.61 0.34
Stat3p705 0 0.0244 2.68 0.42
Stat3p727 0 0.75202 6.09 0.52
Stat6p641 0.04498 0.44092 3.47 0.91
Stathmin 0.02785 0.94217 2.11 0.55
TSC2 0 0.1177 1.81 0.28
TSC2p 0.00004 0.42417 1.4 0.25
VEGFR2 0 0.05401 1.48 0.26
XIAP 0.00012 0.92235 2.68 0.56
Obstacle 3: Intratumoral Heterogeneity
The effects of intratumoral and
intertu-moral variability on protein and
phospho-protein expression were assessed by
applying ANOVA models to RPPA data
derived from Set B. Of 82 proteins in three
time 0 breast tumor replicates, 80
demon-strated significant (at
p
≤
0.05) variability
across the ten tumors, while the expression
of only eight total and phosphoproteins
demonstrated significant intratumoral
var-iability (Table
5
). Clearly, intratumoral
total and phosphoprotein levels are much
less variable than intertumoral levels.
Therefore, RPPA has the potential to
provide accurate and reproducible analysis
of protein expression and function across
patient samples despite potential
chal-lenges with intratumoral heterogeneity.
To determine the impact of intratumoral
heterogeneity on the robustness and
reproducibility of functional proteomic
bio-markers, we firstly determined the
correla-tion coefficients between protein expression
levels in protein lysates derived from each of
two separate sections (
“
biologic replicates
”
)
obtained from 49 primary hormone
receptor-positive breast tumors in Set C (Table
6
).
These correlation coefficients were not as
high as those associated with replicate
protein lysates derived from the same tumor
sections (
“
technical replicates
”
) likely due
in part to the modest degree of intratumoral
heterogeneity described above. However,
72% of the correlation coefficients between
“
biologic replicates
”
were statistically
sig-nificant (at
p
<0.001).
Next, the total and phosphoproteins
associated with differential DFS times were
determined using either of the two 49
Table 6 Reproducibility associated with biologic replicates in reverse
phase protein arrays (RPPA)
Antibody Correlation coefficient
AcCoAp 0.642918568
Akt 0.618759766
Aktp308 0.254004137
Aktp473 0.410063812
AMPK 0.513727089
AMPKp 0.536678994
B catenin 0.730700092
BADp 0.369340325
CCNB1 0.870882305
CCND1 0.625891268
Cleaved caspase 7 0.633270435
E cadherin 0.6183121
EGFR 0.68801607
EGFRp1068 0.405450715
ER 0.841639703
ERK2 0.736704897
ERp118 0.430508819
FKHRL1p318 0.691993326
GSK3 0.678269861
GSK3p21_9 0.592290954
HER2 0.217455474
HER2p1248 0.403034203
IGFR1 0.595481674
IGFR1p 0.436972091
JNK 0.424603378
JNKp183_5 0.543731864
MAPKp 0.79987626
MEK 0.579451091
MEK1-2p 0.659646302
mTOR 0.626602561
p110alpha 0.436998926
p27 0.849943011
p38 0.716704432
p38p180_2 0.608686332
p53 0.655654172
p70S6 Kinase 0.649534728
p70S6Kp389 0.115625786
PKCalphap657 0.58393973
pmTOR 0.006433235
PR 0.758475654
PTEN 0.529437664
Rab25 0.769013148
S6p235–236 0.720622398
S6p240_4 0.866983533
Src 0.71789969
srcp416 0.210019805
srcp527 0.625513318
stat3p705 0.539502613
Table 6 (continued)
Antibody Correlation coefficient
stat3p727 0.550006586
stat6p 0.287410482
TSC2 0.647454784
TSC2p 0.538756346
“
biologic replicates
”
in Set C. High
expres-sion of p53 and cyclin B1, which both
showed minimal intratumoral variability,
were significantly associated with short
DFS times regardless of which biological
replicate was used to classify the patient
(Fig.
4
), while, low levels of
phospho-MAPK (Thr202/Tyr204) were significantly
associated with short DFS in both biopsy
sets (not shown). In both biopsies, low
levels of estrogen (ER
α
) and progesterone
receptors (PR) and low phosphorylation of
stat3 at Ser727 were associated with a trend
(
p
=0.05
–
0.1) to shorter DFS times.
An integrated analysis of multiple
pro-teins may facilitate more accurate prediction
of clinical end points than analysis of
individual proteins. Thus, we next
deter-mined if the expression and activation
levels of multiple proteins yield a stable
functional proteomic
“
fingerprint
”
despite
intratumoral heterogeneity and variability in
tumor handling prior to freezing. Using the
ten breast tumors obtained at surgery, on
unsupervised clustering, the 82-protein
functional proteomic
“
fingerprint
”
was
faithfully preserved across three snap frozen
(time 0) sections derived from nine of the
ten tumors (Fig.
5a
). Further, the unique
“
fingerprint
”
was maintained in most
tumors with increasing time to tumor
freezing up to 24 h after resection
(Fig.
5b
). In two cohorts of separate
sections (
“
biologic replicates
”
) derived from
each of the 49 breast tumors in Set C, the
functional proteomic signatures associated
with each corresponding pair of sections
was significantly correlated (at
p≤
0.05) in
43 tumors (Fig.
6
). Overall, in terms of
intratumoral heterogeneity, the data suggest
that the quantification of total and
phos-phoproteins by RPPA in primary breast
tumors is reproducible in snap frozen
tissue without microdissection. Although
1 000
Low
1 000Low
1.000 1.000
0 750 0 750
0.750 0.750
0 500 0.500
0.500 0.500
High
High
High
0.250
High
0.2500.250
Cyclin B1:
Set 1 Log rank p = 0 03
p53:
Set 1 Log rank p = 0 03
Cyclin B1:
Set 1 Log rank p = 0.03
p53:
Set 1 Log rank p = 0.03
0.000 0.000
0.0 250.0 500.0 750.0 1000.0 0.0 250.0 500.0 750.0 1000.0
1 000 1 000
1.000 1.000
Low
Low
0 750
Low
0 7500.750
Low
0.7500 500 0 500
0.500
Hi h
0.500
High
High
g
High
0 250 0.250
0.250
Cyclin B1:
Set 2 Log rank p = 0.006
p53:
Set 2 Log rank p = 0.04
0.000
y
g
p
0.000
p
g
p
0.000
0.0 250.0 500.0 750.0 1000.0 0.0 250.0 500.0 750.0 1000.0
Disease-free survival (days) Disease-free survival (days) Disease-free survival (days) Disease-free survival (days)
Cumulative survival
Cumulative survival
Cumulative survival
Cumulative survival
Fig. 4 The reproducibility of clinically important breast cancer
protein biomarkers detected by reverse phase protein array (RPPA) despite intratumoral heterogeneity. In two cohorts of separate sections derived from each of 49 non-microdissected hormone
the expression of 21/82 total and
phos-phoproteins was affected by time to tumor
freezing as shown above, the functional
proteomic
“
fingerprint
”
is reproducible in
most tumors even after a delay of 24 h
before freezing.
B. Reproducibility and the Correlation of RPPA with IHC
in Human Breast Tumors:
Reproducibility
Intra- and interslide reproducibility was excellent
(see Figs.
7
and
8
for representative examples) for
validated antibodies. Antibodies with coefficients of
variation (CVs) that are not consistently <15% are
discarded and alternate antibodies are sought.
Correlations Between RPPA and IHC
In 95 breast tumors (Set C (Table
2
)), the levels of
ER
α
and PR proteins, respectively, determined by
RPPA were significantly higher in tumors that are
categorized by IHC and fluorescent in situ
hybridiza-tion as hormone receptor-positive compared with levels
in triple receptor-negative (
p
=0.00004 and
p
<0.001,
respectively) and HER2-amplified breast cancers (
p
=
0.01 and
p
=<0.001). There were significant positive
correlations between ER
α
and PR levels determined by
RPPA and the percentage positivity of these proteins as
assessed using IHC (
p
=0.002 and
p
=0.0006,
respec-tively). Among 64 hormone receptor-positive tumors in
Set C, RPPA detected a 866-fold difference in ER
α
between the tumor with the highest versus the lowest
level of ER
α
. The maximum fold change for PR was
142. This dynamic range may allow RPPA to identify
a
b
p=0.05
-5.29
+5.74
Height (p value)
Fig. 5 Stability of the primary human breast tumor functional
proteomic“fingerprint”despite variability resulting from intratumoral heterogeneity and tissue handling/time to tumor freezing. The overall total and phosphoprotein expression pattern or “signature” was determined by unsupervised hierarchical clustering of data derived from reverse phase protein array (RPPA) analysis of ten primary human breast tumors using the antibodies shown in Table 1. This
“signature”was faithfully preserved in the majority of casesaacross three separate immediately (snap) frozen (time 0) sections derived
clinically relevant biomarkers that may not be
predic-tive using IHC or that may require a larger sample set
to detect using IHC.
C. Potential Clinical Utility of RPPA for the Analysis of
the Breast Cancer Functional Proteome: Breast Cancer
Classification by Functional Proteomics
Based on the validation approaches described
above, protein quantification by RPPA in single
sections derived from human breast tumors has the
potential to provide sufficient information to faithfully
represent the tumor proteome, particularly if the tissue
is frozen expeditiously. In 128 tumors (Set A (Table
2
)),
a highly significant correlation was found on cross
tabulation (
p
< 0.000001) between six breast tumor
clusters defined by RPPA (details shown in Fig.
9a
(the six groups are described in some detail in the
legend of this figure)) and the subtypes defined by
transcriptional profiling [
1
] (Table
7
).
The proteomic differences between luminal A and
luminal B breast cancers are not well understood [
1
].
We hypothesized [
24–44
] that a metric assessing ER
α
function (ER
α
/PR/Bcl2), HER2 levels and activity
(HER2/HERp1248), apoptosis (cleaved caspase 7/
cleaved PARP/Bcl2), protein synthesis (p70S6K/S6
phosphorylation), cell cycle progression (cyclin B1),
and stroma (collagen VI) would accurately distinguish
luminal A from luminal B cancers (Fig.
9c
). The
expression levels of these markers from RPPA were
weighted equally but in opposing directions for their
association with either the luminal A (positive
weight-ing) or luminal B (negative weightweight-ing) subtype and
summed to create a classifier. This analysis yielded a
log mean centered
“
luminalness
”
score cutoff of
−
0.907, with 81% sensitivity, 90% specificity, 85%
positive predictive value, and 88% negative predictive
value for distinguishing luminal A from luminal B
breast cancers in Set A. Figure
10
demonstrates the
survival curves associated with the functional
proteo-mic breast cancer classification systems illustrated in
Fig.
9a and c
. Just as luminal A tumors as defined by
transcriptional profiling did significantly better than
luminal B tumors in terms of distant metastasis-free
survival (at
p
<0.05 (not shown)), the
“
luminalness
”
score defined by RPPA identified two groups of breast
tumors with significantly different distant
metastasis-free survival times (Fig.
10c
). The receiver operator
curves for these analyses are shown in Fig.
11
. The
ability of RPPA to assay total protein levels as well as
functional correlates (phosphorylation/cleavage) likely
contributes to the ability of RPPA to accurately
distinguish luminal A from luminal B breast cancers
(Fig.
9c
) and to predict outcomes using a limited
number of markers.
p=0.05
-4.81
+6.21
Fig. 6 Stability of a human
breast tumor functional proteo-mic“fingerprint”despite indi-vidual protein variability resulting from intratumoral heterogeneity. This figure shows unsupervised clustering of total and phosphoprotein quantifica-tion data obtained by applying reverse phase protein arrays (RPPA) to protein lysates derived from two independent sections obtained from each of 49 human hormone receptor-positive breast cancers. In only six of the 49 cases did the tumor functional proteomic
Akt inter-slide Aktp473 inter-slide p38 inter-slide p38p180_2 inter-slide
Akt intra-slide Aktp473 intra-slide p38 intra-slide p38p180_2 intra-slide
Akt inter-batch Aktp473 inter-batch p38 inter-batch p38p180_2 inter-batch
2 3 2 4
3 3
1 2 0 2 2 2
0 -2 4 0 1 1
2
-1
0 1 2 Rep 3 Rep 3 Rep 2 Rep 2 Rep 2 Rep 2 Rep 2 Rep 2 Rep 2 Rep 2 Timepoint 2 Rep 3 Rep 3 Timepoint 2 Rep 3 Rep 3 Timepoint 2 Rep 3 Rep 3 Timepoint 2 -4
2 0
2 4 0
1 2 0 0 1
2
3-2
3- 2 - 1 0
8-6
8- 6 - 4- 2
2-1
2- 1 0 1
2-1
3- 2 - 1 0 - 3 - 2 - 1 0 1 2 3-3 - 3
2
- 8 - 6 - 4 - 2 0 2 4-8 - 8 6
- 2 - 1 0 1 2 3-2 - 2 - 3 - 2 - 1 0 1 2 3-2 - 3
R e p 1 R e p 1 R e p 1 R e p 1
R = 0 9 7 0 9 7 0 9 7
R e p 1
R = 0 9 9 0 9 9 0 9 9
R e p 1
R = 0 9 2 0 9 4 0 9 2
R e p 1
R = 0 8 3 0 9 3 0 8 3
R e p 1
R = 0 . 9 7 , 0 . 9 7 , 0 . 9 7 R = 0 . 9 9 , 0 . 9 9 , 0 . 9 9 R = 0 . 9 2 , 0 . 9 4 , 0 . 9 2 R = 0 . 8 3 , 0 . 9 3 , 0 . 8 3
2 3 2 4
3
2 3
1 2 0 2 2 1 2
0 -2
4
1 0
-1
0 1
2 -4
-2 0
2 4 0
1 2 -1 0 1 2
3-2
3- 2 - 1 0
8-6
8- 6 - 4- 2
2-1
2- 1 0 1
3-2
3- 2 - 1 0 - 3 - 2 - 1 0 1 2 3-3 - 3
2
- 6 - 4 - 2 0 2 4-8 - 8 6
- 2 - 1 0 1 2 3-2 - 2 - 3 - 2 - 1 0 1 2 3-3 - 3 2
R e p 1 R e p 1 R e p 1 R e p 1
R = 0 9 6 0 9 5 0 9 7
R e p 1
R = 0 9 9 0 9 9 0 9 9
R e p 1
R = 0 8 8 0 8 6 0 9 2
R e p 1
R = 0 8 4 0 9 1 0 8 6
R e p 1
R = 0 . 9 6 , 0 . 9 5 , 0 . 9 7 R = 0 . 9 9 , 0 . 9 9 , 0 . 9 9 R = 0 . 8 8 , 0 . 8 6 , 0 . 9 2 R = 0 . 8 4 , 0 . 9 1 , 0 . 8 6
4
3 4
2 34
2 2
2 3
1 0 1 2
0 -2 1
-1 4-0 0 -2 - 6-4 -1 -1 3--6 --2 -3 -8 -2
- 2 - 1 0 1 2 - 6 - 4 - 2 0 2 - 1 0 1 2 - 2 - 1 0 1 2
Tim e p o int 1 Tim e p o int 1 Tim e p o int 1 Tim e p o int 1
R = 0 . 9 R = 0 . 9 8 R = 0 . 8 5 R = 0 . 8 6
Fig. 7 Reverse phase protein array (RPPA) reproducibility for four
antibodies. Five serial 2-fold dilutions were made from 48 protein lysates (experimental outline shown in Fig.8) and the serial dilutions were spotted in triplicate on three sets of nitrocellulose-coated slides at two time points separated by 1 month (“technical replicates”) followed
by probing of each slide set with four antibodies to determine intraslide, interslide, and interbatch reproducibility, respectively. The individual correlation coefficients (R) for pairs of replicates for intraslide, interslide, and interbatch reproducibility are shown under each correlation plot for each antibody
R
d
ibilit
i
t
Reproducibility experiment
Reproducibility experiment
48 samples prepared from 7 breast and ovarian cancer cells lines 48 samples prepared from 7 breast and ovarian cancer cells lines
Control MDAMB468 Control EGF MDAMB468 MDAMB231 EGF MDAMB231
ZR LY294002 (PI3K inhibitor) / EGF
ZR75-1 ( )
Perifosine (AKT inhibitor) / EGF T47D Perifosine (AKT inhibitor) / EGF
Rapamycin (mTOR inhibitor) / EGF T47D
MCF7 Rapamycin (mTOR inhibitor) / EGF MCF7
OVCAR3 UV irradiated OVCAR3
SKOV3 SKOV3
12 slides
T i li t lid probed with
Triplicates on slide Printed 12 slides Triplicates on slide Printed 12 slides
4 antibodies in t i li t triplicate
Freeze thaw three cycles Freeze thaw three cycles
(I 384 ll l t ) AKTpS473
(In 384 well plates)
AKT p38pT180Y182 p38pT180Y182 p38 p38
P i d 12 lid Printed 12 slides Printed 12 slides
th l t one month later
Fig. 8 Experimental outline for
a
b
c
Fig. 9 A functional proteomic classification of breast cancer. a
Unsupervised hierarchical clustering of 128 breast tumors with data derived from reverse phase protein array (RPPA) using 82 antibodies (Table1). Six groups were identified as follows: groups 1 and 2—high expression of estrogen receptor alpha (ER) ± progesterone receptor (PR); groups 3 and 4—high expression of stromal markers, including collagen VI and caveolin; group 5—high expression of proliferation markers, including cyclin B1 (CCNB1), with very low expression of ER; and group 6—high HER2 expression and phosphorylation at tyrosine 1248 (HER2p1248).bA log2 scale for the data used to generate the heat maps in a and c. c Hierarchical clustering analysis using 12 markers to
distinguish luminal A from luminal B breast cancers in Set A (see Table2). Luminal A tumors are designated by abrown colorto theright of the heat map. The 12 markers can be subdivided into three functional groups—a proliferation group (cleaved caspase 7, cleaved PARP, CCNB1, p70S6 Kinase, and phosphorylation of ribosomal S6 protein at serines 235–236 (S6p235–236) and 240–244 (S6p240_4)), a receptor tyrosine kinase (RTK) group (HER2/HER2p1248), and a functional ER alpha (“ERness”) group (ER, PR, and bcl2). The order of these 12 markers from left to right at the top of panelcare: cleaved caspase 7, cleaved PARP, p70S6 Kinase, CCNBI, S6p240_4, S6p235–236, HER2p1248, HER2, Collagen VI, PR, bcl 2, ER
Table 7 Significant correlation between subtypes of breast cancer identified by reverse phase protein array (RPPA) and by transcriptional profiling
Subtypes by transcriptional profiling Basal erbb2 Luminal a Luminal b Normal Total
Subgroups defined by RPPA
1 0 0 12 2 1 15
2 0 0 18 9 1 28
3 4 1 9 0 6 20
4 3 2 3 2 9 19
5 17 1 0 6 0 24
6 0 14 0 8 0 22
Total 24 18 42 27 17 128
Chi-square statistics section
Chi-square 170.128355
Degrees of freedom 20
Probability Level (p) 0.000000
Conclusion
Much progress has been made in genomic classification of
breast cancer, with these results already impacting patient
care [
1–10
]. However, proteins are the ultimate effectors of
cellular outcomes, and functional proteomic data represent
an under-evaluated information resource for the
identifica-tion of useful biomarkers in solid tumors. RPPA represents
an emerging functional proteomic assay that has the
potential to provide a cost- and material-effective,
high-throughput, comprehensive, sensitive, and quantitative
approach to molecular classification and pathophysiology
studies [
11–23
]. RPPA has been demonstrated to have
utility in the analysis of functional proteomic events in vitro
[
11
–
23
] and allows exploration of the intricacy of cellular
signaling in a manner that cannot be accomplished by
immunoblotting or IHC.
Although the application of RPPA to analysis of the
functional proteome in cell lines and xenografts has proven
relatively straightforward, the application of this technology
to the study of non-microdissected human tumors presents a
number of potential obstacles. These include the need to
validate a large panel of antibodies, variability in tissue
handling prior to freezing, and intratumoral heterogeneity.
In this study, 82 antibodies that recognize kinase and
steroid signaling proteins and their effectors were validated
for RPPA. Further, our study demonstrates that both
increasing time to tissue freezing and intratumoral
hetero-geneity result in variability in protein levels in breast
tumors. However, the reproducibility and robustness of
Distant metastasis free Survival Plot Distant metastasis free Survival Plota
Distant metastasis-free Survival Plotc
Distant metastasis-free Survival Plot1 000 1 000
1.000
l l 1.000
v a l v a l rvi v rvi v 0.750 S u r 0.750 S u r e S e S fre e
1
fre e s-f1
s-f 0.500 a si4
asi 0.500a st a
2
3
4
a st ai
eta
2
3
e ta
i
ii
m e5
m eii
0.250nt
5
6
nt 0.250s
ta
6
staD
is
P=0 01
DisP=0 02
0 000
D
P=0.01
0 000
D
P=0.02
0.000
0 0 66 7 133 3 200 0 266 7 333 3 400 0
0.000
0 0 66 7 133 3 200 0 266 7 333 3 400 0 0.0 66.7 133.3 200.0 266.7 333.3 400.0
Months
0.0 66.7 133.3 200.0 266.7 333.3 400.0
Months
Months Months
Overall Survival Plot Overall Survival Plot
Overall Survival Plot Overall Survival Plot
b
d
1 000 1 000
1.000 1.000
0.750 0.750
0.750
a
l 0 50
v al v iv a v iv ur v ur v 0.500
l S l S 0.500
ral l ral l v e r v e r O v O v 0.250 0.250
P 0 005
P 0 17
0 000
P=0.005
0 000P=0.17
0.000
0 0 66 7 133 3 200 0 266 7 333 3 400 0
0.000
0 0 66 7 133 3 200 0 266 7 333 3 400 0 0.0 66.7 133.3 200.0 266.7 333.3 400.0
Months
0.0 66.7 133.3 200.0 266.7 333.3 400.0
Months
Months Months
Fig. 10 Survival curves for subgroups identified by a functional
proteomic classification of breast cancer.aDistant metastasis-free and b overall survival curves for six subgroups (Fig. 9a) identified by unsupervised hierarchical clustering of 128 breast tumors (Set A) with data derived from reverse phase protein array (RPPA) using 82 antibodies. The same color scheme is used to illustrate the six breast cancer subgroups in Figs.9aand10a and b.cDistant metastasis-free
RPPA, the faithfulness with which total and
phosphopro-teins and the functional proteomic
“
fingerprint
”
are
pre-served in different sections derived from snap frozen
primary breast tumors, and the stability of this
“
fingerprint
”
with increasing time to freezing all facilitate the application
of RPPA to the study of individual and multiple protein
biomarkers in non-microdissected breast tumor specimens.
A previous study demonstrated the half-life of Aktp473
as measured by western blotting in human HT-29 human
colon tumor xenografts at room temperature to be 20 min,
whereas total Akt was lost with a half-life of 180 min [
46
].
Indeed, we also noted that the half-life for proteins on
western blotting was less than that for RPPA likely due to
RPPA being a dot blot approach that is less sensitive to the
protein degradation. During the preparation of this
manu-script, a study of protein stability in patient samples derived
from a number of human tissues and tumor types was
published [
47
]. This manuscript demonstrated transient
increases in phosphorylation of a number of proteins over
the first 30 min to 1-h post-collection with a return to the
original levels at later time points. The data showing a
post-collection increase in a number of phosphorylation events
followed by a return to the baseline steady state levels are
intriguing and will require exploration of potential
mech-anisms. In our study, we specifically assessed a larger set of
only breast cancers than in the study by Espina and
colleagues [
47
], as well as human breast xenograft tissues,
to determine the relative effect of protein stability as related
to the dynamic range of each marker across patient
samples. Our goal was to determine the effects of tissue
handling on the ability to characterize the functional
proteome in human breast tumors. For the majority of
markers characterized in breast tumors, we did not detect
early increases in phosphoprotein or other protein levels in
either human tumor or xenograft tissues that would alter our
ability to classify tumors based on protein levels. Both the
human breast tumor and xenograft tissues in our study were
left at room temperature in closed eppendorf tubes with no
added buffer until the point of freezing.
The primary purpose of this study was to address and
overcome obstacles to the successful application of RPPA
to the study of the breast cancer functional proteome.
Subsequent to our addressing a key set of potential
obstacles and our demonstration of the reproducibility of
RPPA and of significant (at
p
<0.05) correlations between
results derived using RPPA and IHC studies, we attempted
to evaluate the potential clinical utility of RPPA for the
analysis of the breast cancer functional proteome. We
selected 82 antibodies (Table
1
) that recognize multiple
kinase and steroid signaling events and their downstream
effectors implicated in breast carcinogenesis [
24–44
].
Utilizing these markers, RPPA classifies breast cancer into
six groups by assaying functional correlates (e.g.,
phos-phorylation, cleavage) in addition to total protein levels
(Fig.
9a
). The ability to assess both total levels and
functional correlates likely confers upon RPPA the ability
to accurately distinguish luminal A from luminal B breast
cancers using a limited number of markers (Fig.
9c
).
Further, the classification of breast cancer by RPPA
demonstrates a significant correlation on cross tabulation
with the well-established classification of breast cancer by
transcriptional profiling (Table
7
). Thus, the information
content captured by RPPA reflects the underlying
character-istics of breast tumors, including the likely cell of origin,
and potentially patient outcomes and tumor responsiveness
to therapy.
Fig. 11 Receiver operator (ROC) curves. These panels show ROC curves associated with prediction ofaluminal A vs. luminal B breast cancers,
As with the current study, the studies of other groups
also support the feasibility and potential utility of
compre-hensive signal pathway activation profiling using RPPA for
molecular analysis of human cancers [
19–23
,
48
,
49
]. Many
of these studies utilized microdissected human tissue and
human tumor material. Our study also validates RPPA as a
robust tool for the study of the functional proteome in
non-microdissected human breast cancers, and this is clearly
important for a number of reasons. In terms of potential
clinical utility, RPPA could potentially be used to develop
signatures that may be useful in terms of prediction of
therapy responsiveness in specific subsets of women with
breast cancer. Such signatures could conceivably resemble
the mRNA-based test, Oncotype Dx® [
44