Multinomial Logit Analysis of Injury Severity in Crashes
Involving Emotional Drivers
Kristen Hubbert, Mehrnaz Doustmohammadi*
Department of Civil and Environmental Engineering, University of Alabama in Huntsville, Huntsville, AL, United States
Abstract
Crashes involving emotional or aggressive driving pose a large problem in the United States today. This study attempts to identify significant factors influencing crash severity in crashes involving emotional drivers and their effects on the levels of severity. 3 levels of severity are considered in the study: fatal/incapacitating injuries, possible/minor injuries, and property damage only. A multinomial logit model was applied to the data with crash severity as the response variable to an initial 17 independent variables, including driver, vehicle, traffic, roadway, geometric, and environmental characteristics. Results of the model were compared against similar model results for normal driving crashes. Rural/urban, primary contributing circumstance, manner of crash, vehicle maneuvers, and speed limit were all shown to be significant factors in the severity of emotional driving crashes. Results of the study found that emotional and normal driving crashes experience similar trends in crash severity risks.Keywords
Injury Severity, Safety, Emotional Driving, Multinomial Logit Regression1. Introduction
In everyday life, people often encounter situations that alter their mental state and mood, often sending their emotions into a frenzy. Driving is an activity that requires attention to detail and a preparedness to react to any number of situations, but if a person decides to get behind the wheel of a vehicle while they are emotional, his or her focus and reaction time could be significantly impaired. In order to better understand the context and scope of this study, it must first be determined what defines an “emotional driver.” Due to the subjective nature of emotions, there is no particular test or exact measure of a person’s emotions at the time of crash. According to the “Alabama eCrash Data Element Manual (DEM) for the Alabama Uniform Traffic Crash Report (AUTCR),” the manual that guides data input for the crash data used in this study, a driver should be coded as “emotional” if he or she is depressed, angry, disturbed, or something similar [1]. Additionally, one should be coded as “emotional” only if the driver’s emotional state is believed to have contributed to the occurrence of the crash [1]. This emotional state must be classifying the driver’s condition at the time prior to the crash and not after. In order to maintain credibility for such
* Corresponding author:
[email protected] (Mehrnaz Doustmohammadi) Published online at http://journal.sapub.org/ijpbs
Copyright©2019The Author(s).PublishedbyScientific&AcademicPublishing This work is licensed under the Creative Commons Attribution International License (CC BY). http://creativecommons.org/licenses/by/4.0/
seemingly arbitrary data in reports, officers are highly trained and knowledgeable about each data element and its possible data inputs for the reports. This helps maintain accurate, consistent, and complete information regarding crashes [1].
Some effects of emotional driving have been called “aggressive driving” or “road rage.” It has been found that at least 1500 deaths occur each year in the United States solely as a result of this “aggressive driving” behavior [2]. An analysis of these types of crashes involving emotionally impaired drivers that identifies the factors influencing the crash severity could lead to changes that could potentially increase traffic safety for everyone, although little research has been performed on this subject in the past.
crashes, specifically, a similar modeling procedure was performed on a sample of normal driving crashes in the same time period and location, and the results were compared against those of the emotional driving crashes.
2. Literature Review
Several studies have been performed in order to identify some of the effects related to different emotional states. Some of the effects studied include changes in reaction time and likelihood of making risky decisions. A 2018 study by Yang et al compared the effects of anger and fear on risky decision-making [3]. A similar study performed by Coget, Haag, and Gibson in 2011examined the impacts of anger and fear on intuitiveness, rationality, and effectiveness of decision-making, finding that the intensity of emotions plays a significant role in the emotion’s effects [4]. In 2009, Gambetti and Giusberti assessed the influence of trait anger on decisions in risky situations [5]. Their results indicated that a tendency to feel anger could increase familiarity perception while decreasing the perception of salience when facing risky situations [5]. A meta-analytic study performed by Angie et al in 2011 reviewed research examining the influence of discrete emotions on both judgement and decision-making outcomes, finding that discrete emotions can have moderate to significate effects [6]. In 2014, Xing examined the role of attention in links between emotion and decision making, finding that angry individuals tended to look more and sooner toward heuristic cues than did sad individuals [7]. Bright and Goodman-Delahunty in 2006 and Nuñez et al in 2015 performed similar studies evaluating emotional effects on jurors’ sentencing decisions [8,9]. Results of these studies found that anger did play a role in the decisions, resulting in an increase in conviction rates [8,9]. Building on studies evaluating the effects of emotions on decision-making, Szasz et al investigated the effects that emotion regulating strategies played on decision-making in 2016 [10]. Findings of their study suggest that emotion regulation strategies of negative affective states do have an immediate effect on decision-making and risk-taking behavior [10]. Similarly, a 2014 study by Beatty et al found that emotional regulation strategies influence human movement, including reaction time, rate of force production, and performance accuracy [11]. In 2015, Kreibig et al evaluated the stability of results of physiological reactivity between replications of the same study [12]. Results suggested replicable differentiation of amusement, disgust, and a mixed emotional state [12].
An average of at least 1500 men, women, and children are injured or killed in the United States each year as a result of “aggressive driving” [2]. In 1997, Joint commissioned a survey that found that almost 90% of participants had experienced "road rage" in the 12 months prior to the survey and 60% admitted to losing their tempers behind the wheel [2]. Although the cause behind the frequency of road rage being so high is unknown, Connell proposed in 1997 that
driving provides a field for stress and tension to accumulate without presenting an outlet to release the stress [2]. Researchers have spent countless hours trying to better understand “road rage.” In particular, several studies have been performed in an effort to identify particular factors that may influence or increase the likelihood of angry and aggressive driving [13-18]. Some of these studies even attempt to identify people who are more likely to drive aggressively based on personality traits [13,15]. A particular study performed by Hennessy and Wiesanthal in 1999 found that driver stress and aggression are greater in high-congestion conditions than low-congestion conditions [14]. In addition to studies focused on identifying the causes of aggressive or angry driving, numerous other studies have been performed with the aim of analyzing the influence of emotions and aggression on driving behavior [19-29]. Furthermore, some researchers have even gone on to assess the effects of drivers’ emotions and aggression on their likelihood of traffic violations and crash risk [26,30,31]. One cause of the increased crash risk and likelihood of traffic violations could be explained by studies by Lemercier and Cellier in 2008 and Jallais et al in 2014 whose results indicated that negative emotions can have poor effects on the information processing system which can result in inattention [32,33].
3. Data and Variable Settings
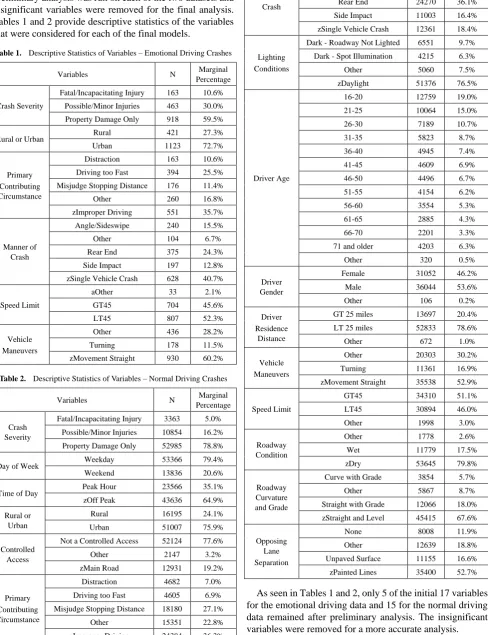
It was previously mentioned that data was extracted from CARE software. The emotional driving database was a subset of driver condition. Crashes involving only emotional drivers were considered for the first analysis, while a sample of crashes excluding emotional drivers was considered for a second analysis. Results from the two analyses were compared for a better explanation and understanding of what influences crashes involving emotional drivers. In order to reduce error and produce results that are as accurate as possible, crashes involving unknowns were excluded from the study set by grouping them into a category called “Other” that was ignored for interpretation purposes. Crash severity was separated into three separate levels: fatal/incapacitating injury, minor/possible injury, and property damage only. Afterwards, data from the independent variables was grouped into relevant factions (i.e. time of day was categorized into peak hour and off-peak). Unknowns and variables with sample sizes that were too small to be significant were grouped into the “Other” category in order to retain the crash data from the other variables without skewing the results. After this, base variables were chosen based on frequency. The subvariable with the highest frequency was set as the base for the analysis.
conditions), and crash characteristics (primary contributing circumstance, manner of crash, and vehicle maneuvers). A preliminary analysis was run on each of the two datasets and insignificant variables were removed for the final analysis. Tables 1 and 2 provide descriptive statistics of the variables that were considered for each of the final models.
Table 1. Descriptive Statistics of Variables – Emotional Driving Crashes
Variables N Marginal
Percentage
Crash Severity
Fatal/Incapacitating Injury 163 10.6%
Possible/Minor Injuries 463 30.0%
Property Damage Only 918 59.5%
Rural or Urban Rural 421 27.3%
Urban 1123 72.7%
Primary Contributing Circumstance
Distraction 163 10.6%
Driving too Fast 394 25.5%
Misjudge Stopping Distance 176 11.4%
Other 260 16.8%
zImproper Driving 551 35.7%
Manner of Crash
Angle/Sideswipe 240 15.5%
Other 104 6.7%
Rear End 375 24.3%
Side Impact 197 12.8%
zSingle Vehicle Crash 628 40.7%
Speed Limit
aOther 33 2.1%
GT45 704 45.6%
LT45 807 52.3%
Vehicle Maneuvers
Other 436 28.2%
Turning 178 11.5%
zMovement Straight 930 60.2%
Table 2. Descriptive Statistics of Variables – Normal Driving Crashes
Variables N Marginal
Percentage
Crash Severity
Fatal/Incapacitating Injury 3363 5.0%
Possible/Minor Injuries 10854 16.2%
Property Damage Only 52985 78.8%
Day of Week Weekday 53366 79.4%
Weekend 13836 20.6%
Time of Day Peak Hour 23566 35.1%
zOff Peak 43636 64.9%
Rural or Urban
Rural 16195 24.1%
Urban 51007 75.9%
Controlled Access
Not a Controlled Access 52124 77.6%
Other 2147 3.2%
zMain Road 12931 19.2%
Primary Contributing Circumstance
Distraction 4682 7.0%
Driving too Fast 4605 6.9%
Misjudge Stopping Distance 18180 27.1%
Other 15351 22.8%
zImproper Driving 24384 36.3%
Manner of Crash
Angle/Sideswipe 9670 14.4%
Other 9898 14.7%
Rear End 24270 36.1%
Side Impact 11003 16.4%
zSingle Vehicle Crash 12361 18.4%
Lighting Conditions
Dark - Roadway Not Lighted 6551 9.7%
Dark - Spot Illumination 4215 6.3%
Other 5060 7.5%
zDaylight 51376 76.5%
Driver Age
16-20 12759 19.0%
21-25 10064 15.0%
26-30 7189 10.7%
31-35 5823 8.7%
36-40 4945 7.4%
41-45 4609 6.9%
46-50 4496 6.7%
51-55 4154 6.2%
56-60 3554 5.3%
61-65 2885 4.3%
66-70 2201 3.3%
71 and older 4203 6.3%
Other 320 0.5%
Driver Gender
Female 31052 46.2%
Male 36044 53.6%
Other 106 0.2%
Driver Residence
Distance
GT 25 miles 13697 20.4%
LT 25 miles 52833 78.6%
Other 672 1.0%
Vehicle Maneuvers
Other 20303 30.2%
Turning 11361 16.9%
zMovement Straight 35538 52.9%
Speed Limit
GT45 34310 51.1%
LT45 30894 46.0%
Other 1998 3.0%
Roadway Condition
Other 1778 2.6%
Wet 11779 17.5%
zDry 53645 79.8%
Roadway Curvature and Grade
Curve with Grade 3854 5.7%
Other 5867 8.7%
Straight with Grade 12066 18.0%
zStraight and Level 45415 67.6%
Opposing Lane Separation
None 8008 11.9%
Other 12639 18.8%
Unpaved Surface 11155 16.6%
zPainted Lines 35400 52.7%
4. Methodology
When a traffic accident occurs, the severity of the crash is assigned into discrete categories based on the involved party with the most severe injury. The severity levels in the crashes range from property damage only (least severe) to fatal (most severe). In many cases, ordered response models are selected to analyze data where the outcomes can be ordered (such as in this case, where the severity could be ordered by increasing or decreasing crash severity levels). Although the ordered response models are more typical, multinomial logit models provide an alternative route that allows more flexibility and allows the independent variables to have non-monotonic effects on the dependent variable [34].
For this paper, the multinomial logistic (or logit) regression modeling approach was used. Logistic regression is used in order to explain the relationship between a selected dependent variable and one or more independent variables. Binary logistic regression can be used in cases where the response variable has only 2 possible outcomes; however, in this case, where the dependent variable has a total of 3 possible outcomes, the multinomial logistic model should be used instead and takes the following form [34]:
(1)
where
i = severity outcome,
Pn(i) = the probability of severity outcome i, n = the most injured party in the crash,
i = a vector of estimable coefficients for i,
Xni = a vector containing the explanatory variables. The model is based on the condition that a crash has already occurred and attempts to predict the severity of the crash based on the conditions at the time of the crash (given by the independent variables). For this study, the IBM software SPSS Statistics 25 was used for the analysis.
5. Results and Discussion
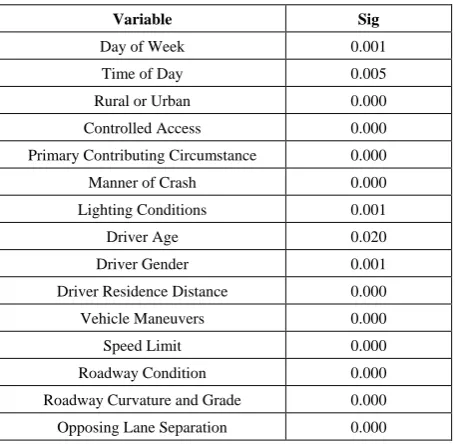
Likelihood ratio test results, given below in Tables 3 and 4, show that rural/urban, primary contributing circumstance, manner of crash, speed limit, and vehicle maneuvers were all significant factors in emotional driving crashes while 15 variables were significant in normal driving crashes.
Table 3. Likelihood Ratio Test Results – Emotional Driving Crashes
Variables Sig
Rural or Urban 0.001
Primary Contributing Circumstance 0.000
Manner of Crash 0.000
Speed Limit 0.012
Vehicle Maneuvers 0.000
Table 4. Likelihood Ratio Test Results – Normal Driving Crashes
Variable Sig
Day of Week 0.001
Time of Day 0.005
Rural or Urban 0.000
Controlled Access 0.000
Primary Contributing Circumstance 0.000
Manner of Crash 0.000
Lighting Conditions 0.001
Driver Age 0.020
Driver Gender 0.001
Driver Residence Distance 0.000
Vehicle Maneuvers 0.000
Speed Limit 0.000
Roadway Condition 0.000
Roadway Curvature and Grade 0.000
Opposing Lane Separation 0.000
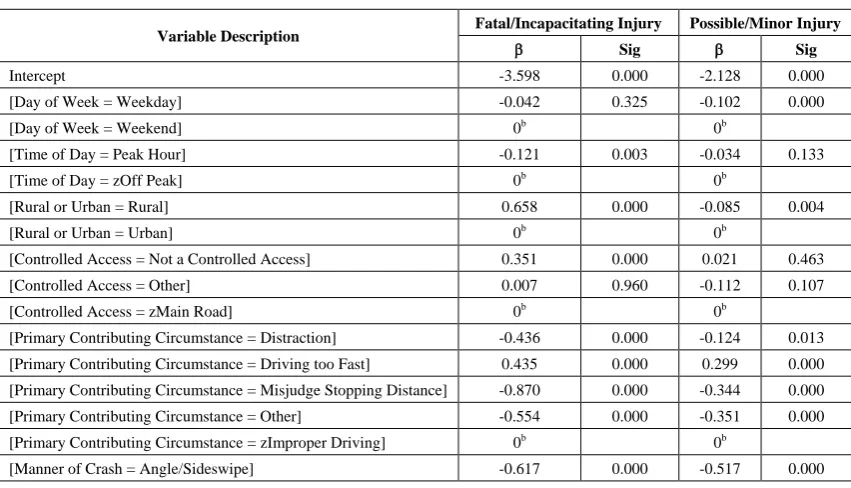
Results and model fitting statistics of the multinomial logistic regression models for analyzing crash severity in crashes involving emotional drivers and normal drivers are shown in Tables 5 and 6, respectively. “Property Damage Only” was considered as the base case in both models. The tables show all of the remaining significant independent variables utilized in the analyses.
Based on the results given in Table 5, Fatal/incapacitating injuries in crashes involving emotional drivers are more prone on rural roads and roads with speed limits greater than 45 mph. This could be a result of the lack of traffic in these areas, which allows for higher driving speeds which are common in emotional individuals as they are more prone to risky behavior [10]. Table 5 also shows that fatal/incapacitating injuries are less likely to occur as a result of distractions, misjudging stopping distances, rear end crashes, or turning crashes. These results are surprising, as studies have shown that emotional individuals suffer from decreased reaction times which could be a factor in each of these cases [11]. It is a possibility that the majority of these crashes occurred in more congested areas with lower speed limits, which would decrease the risk of fatal/incapacitating crashes in general due to lower impact upon crash. In relation to possible/minor injury crashes involving emotional drivers, distractions, misjudging stopping distance, angle/sideswipe crashes, and turning crashes all resulted in lower likelihood of minor/possible injury than of property damage only crashes. Overall, property damage only crashes appeared to be more prevalent in most cases.
normal driving case. In the cases of increased risk (fatal/incapacitating injuries on rural roads and roads with
speed limits exceeding 45 mph), the magnitudes of the effects were virtually the same ( values almost equal).
Table 5. Model Results – Emotional Driving Crashes
Variable Description
Fatal/Incapacitating Injury Possible/Minor Injury
Sig Sig
Intercept -1.604 0.000 -0.219 0.161
[Rural or Urban=Rural] 0.725 0.000 -0.012 0.934
[Rural or Urban=Urban] 0b 0b
[Primary Contributing Circumstance = Distraction] -0.816 0.023 -0.701 0.002
[Primary Contributing Circumstance = Driving too Fast] 0.250 0.271 -0.081 0.625
[Primary Contributing Circumstance = Misjudge Stopping Distance] -1.223 0.042 -0.586 0.024
[Primary Contributing Circumstance = Other] -0.361 0.201 0.195 0.268
[Primary Contributing Circumstance = zImproper Driving] 0b 0b
[Manner of Crash=Angle/ Sideswipe] -0.486 0.073 -0.626 0.001
[Manner of Crash = Other] -0.173 0.633 -0.470 0.066
[Manner of Crash=Rear End] -1.072 0.001 -0.329 0.074
[Manner of Crash=Side Impact] -0.437 0.181 0.054 0.784
[Manner of Crash=zSingle Vehicle Crash] 0b 0b
[Speed Limit=aOther] -0.229 0.764 -0.331 0.440
[Speed Limit=GT45] 0.626 0.001 0.213 0.087
[Speed Limit=LT45] 0b 0b
[Vehicle Maneuvers = Other] -0.400 0.045 -0.562 0.000
[Vehicle Maneuvers = Turning] -1.291 0.001 -0.733 0.000
[Vehicle Maneuvers = zMovement Straight] 0b 0b
Model Fitting Information
Model
Model Fitting
Criteria Likelihood Ratio Tests
-2 Log
Likelihood df p-value
Intercept Only 952.236
Final 779.482 26 0.000
Table 6. Model Results – Normal Driving Crashes
Variable Description Fatal/Incapacitating Injury Possible/Minor Injury
Sig Sig
Intercept -3.598 0.000 -2.128 0.000
[Day of Week = Weekday] -0.042 0.325 -0.102 0.000
[Day of Week = Weekend] 0b 0b
[Time of Day = Peak Hour] -0.121 0.003 -0.034 0.133
[Time of Day = zOff Peak] 0b 0b
[Rural or Urban = Rural] 0.658 0.000 -0.085 0.004
[Rural or Urban = Urban] 0b 0b
[Controlled Access = Not a Controlled Access] 0.351 0.000 0.021 0.463
[Controlled Access = Other] 0.007 0.960 -0.112 0.107
[Controlled Access = zMain Road] 0b 0b
[Primary Contributing Circumstance = Distraction] -0.436 0.000 -0.124 0.013
[Primary Contributing Circumstance = Driving too Fast] 0.435 0.000 0.299 0.000
[Primary Contributing Circumstance = Misjudge Stopping Distance] -0.870 0.000 -0.344 0.000
[Primary Contributing Circumstance = Other] -0.554 0.000 -0.351 0.000
[Primary Contributing Circumstance = zImproper Driving] 0b 0b
[Manner of Crash = Other] 0.332 0.000 -0.680 0.000
[Manner of Crash = Rear End] -0.834 0.000 -0.390 0.000
[Manner of Crash = Side Impact] 0.020 0.762 0.008 0.845
[Manner of Crash = zSingle Vehicle Crash] 0b 0b
[Lighting Conditions = Dark - Roadway Not Lighted] 0.093 0.084 -0.074 0.061
[Lighting Conditions = Dark – Spot Illumination] -0.195 0.037 0.079 0.066
[Lighting Conditions = Other] 0.160 0.021 0.036 0.387
[Lighting Conditions = zDaylight] 0b 0b
[Driver Age=16-20] -0.688 0.001 0.158 0.355
[Driver Age=21-25] -0.684 0.001 0.095 0.581
[Driver Age=26-30] -0.621 0.002 0.138 0.423
[Driver Age=31-35] -0.550 0.007 0.167 0.335
[Driver Age=36-40] -0.702 0.001 0.098 0.573
[Driver Age=41-45] -0.463 0.025 0.098 0.575
[Driver Age=46-50] -0.640 0.002 0.140 0.422
[Driver Age=51-55] -0.623 0.003 0.129 0.459
[Driver Age=56-60] -0.622 0.003 0.159 0.364
[Driver Age=61-65] -0.795 0.000 0.092 0.602
[Driver Age=66-70] -0.580 0.008 0.100 0.578
[Driver Age=71 and older] -0.429 0.039 0.153 0.379
[Driver Age=Other] 0b 0b
[Driver Gender=Female] 1.003 0.107 0.700 0.108
[Driver Gender=Male] 1.028 0.099 0.628 0.150
[Driver Gender=Other] 0b 0b
[Driver Residence Distance = GT 25 miles] 0.152 0.515 0.141 0.261
[Driver Residence Distance = LT 25 miles] 0.306 0.185 0.248 0.045
[Driver Residence Distance = Other] 0b 0b
[Vehicle Maneuvers = Other] -0.606 0.000 -0.432 0.000
[Vehicle Maneuvers = Turning] -0.294 0.000 -0.158 0.000
[Vehicle Maneuvers = zMovement Straight] 0b 0b
[Speed Limit=GT45] 0.651 0.000 0.390 0.000
[Speed Limit=LT45] 0.263 0.101 0.100 0.204
[Speed Limit=Other] 0b 0b
[Roadway Condition=Other] -0.888 0.000 -0.406 0.000
[Roadway Condition=Wet] -0.448 0.000 -0.160 0.000
[Roadway Condition=zDry] 0b 0b
[Roadway Curvature and Grade = Curve with Grade] 0.622 0.000 0.309 0.000
[Roadway Curvature and Grade = Other] 0.504 0.000 0.283 0.000
[Roadway Curvature and Grade = Straight with Grade] 0.218 0.000 0.048 0.100
[Roadway Curvature and Grade = zStraight and Level] 0b 0b
[Opposing Lane Separation=None] -0.245 0.000 -0.151 0.000
[Opposing Lane Separation=Other] -0.276 0.000 -0.090 0.004
[Opposing Lane Separation = Unpaved Surface] 0.005 0.925 -0.102 0.001
[Opposing Lane Separation = zPainted Lines] 0b 0b
Model Fitting Information
Model
Model Fitting
Criteria Likelihood Ratio Tests
-2 Log
Likelihood df p-value
Intercept Only 74737.421
6. Conclusions
Deaths resulting from vehicle crashes is a big issue in the United States, with more than 1500 deaths per year resulting from aggressive driving alone [2]. It is not safe to get behind the wheel of a car when one is emotionally impaired resulting in changes in reaction time, intuitiveness, rationality, and effectiveness of decision-making [4,11]. More research relating to crash severity in emotional driving crashes could result in safer roads for everyone. This study attempted to identify factors influencing different levels of severity associated with crashes involving emotional drivers. A comprehensive set of independent variables was used for the analysis including driver, vehicle, traffic, roadway, geometric, and environmental characteristics. A multinomial logit model was fitted to the data in order to identify factors with significant effects on crash severity where emotional driving is involved.
Overall, rural/urban, primary contributing circumstance, manner of crash, speed limit, and vehicle maneuvers were all significant factors in the severity of emotional driving crashes. After comparing the results with results from normal driving data, it could be seen that both cases follow the same crash trends, with emotional driving crashes experiencing greater magnitudes of the trends.
As both datasets showed such highly similar results, it appears that emotional drivers experience virtually the same crash severity risks as normal drivers. Based on the findings of the study, it could be proposed to reduce speed limits on rural roads in order to decrease the risk of fatal/incapacitating injury crashes, as both cases experienced increased risk of severe injury crashes in this case.
Future research using a larger sample size of emotional driving crashes could be useful in adding to the findings here, as the current sample had only 1544 crash cases. Also, other factors such as traffic volumes could be considered to identify more influential factors on the crash severity in crashes involving emotional drivers.
ACKNOWLEDGEMENTS
The authors would like to thank the Center for Advanced Public Safety.
REFERENCES
[1] N.a. (2011). Alabama eCrash Data Element Manual for the Alabama Uniform Traffic Crash Report.
[2] Mizell, L., Joint, M., & Connell, D. (1997). Aggressive Driving: Three Studies. PsycEXTRA Dataset. doi:10.1037/e 366972004-001.
[3] Yang, Q., Zhao, D., Wu, Y., Tang, P., Gu, R., & Luo, Y.J. (2018). Differentiating the influence of incidental anger and fear on risk decision-making. Physiology & Behavior, 184, 179-188. doi: 10.1016/j.physbeh.2017.11.028.
[4] Coget, J., Haag, C., & Gibson, D.E. (2011). Anger and fear in decision-making: The case of film directors on set. European Management Journal, 29(6), 476-490.
doi.org/10.1016/j.emj.2011.06.003.
[5] Gambetti, E. & Giusberti, F. (2009). Dispositional anger and risk decision-making. Mind & Society, 8(1), 7-20.
doi: 10.1007/s11299-008-0052-z.
[6] Angie, A.D., Connelly, S., Waples, E.P., & Kilgyte, V. (2011). The influence of discrete emotions on judgement and decision-making: a meta-analytic review. Cognition & Emoti on, 25(8), 1393-1422. doi: 10.1080/02699931.2010.550751. [7] Xing, C. (2014). Effects of anger and sadness on attentional
patterns in decision making: an eye-tracking study. Psychological Reports, 114(1), 50-67. doi:10.2466/01.04.PR 0.114k14w3.
[8] Nuñez, N., Schweitzer, K., Chai, C.A., & Myers, B. (2015). Negative emotions felt during trial: The effect of fear, anger, and sadness on juror decision making. Applied Cognitive Psychology, 29, 200-209. doi: 10.1002/acp.3094.
[9] Bright, D.A. & Goodman-Delahunty, J. (2006). Gruesome evidence and emotion: anger, blame, and jury decision-making. Law and Human Behavior, 30(2), 183-202. doi: 10.1007/s10979-006-9027-y.
[10] Szasz, P.L., Hofmann, S.G., Heilman, R.M., & Curtiss, J. (2016). Effect of regulating anger and sadness on decision-making. Cognitive Behavior Therapy, 45(6), 479-495. doi: 10.1080/16506073.2016.1203354.
[11] Beatty, G. F., Fawver, B., Hancock, G. M., & Janelle, C. M. (2014). Regulating emotions uniquely modifies reaction time, rate of force production, and accuracy of a goal-directed motor action. Human Movement Science, 33, 1-13. doi:10.1016/j.humov.2013.12.001.
[12] Kreibig, S.D., Samson, A.C., & Gross, J.J. (2015). The psychophysiology of mixed emotional states: Internal and external replicability analysis of a direct replication study. Psychophysiology, 52(7), 873-886. doi: 10.1111/psyp.12425. [13] Depasquale, J. P., Geller, E., Clarke, S. W., & Littleton, L. C. (2001). Measuring road rage: Development of the Propensity for Angry Driving Scale. Journal of Safety Research, 32(1), 1-16. doi:10.1016/s0022-4375(00)00050-5.
[14] Hennessy, D. A., & Wiesenthal, D. L. (1999). Traffic congestion, driver stress, and driver aggression. Aggressive Behavior, 25(6), 409-423. doi:10.1002/(sici)1098-2337(1999 )25:63.0.co;2-0.
[15] Paleti, R., Eluru, N., & Bhat, C. R. (2010). Examining the influence of aggressive driving behavior on driver injury severity in traffic crashes. Accident Analysis & Prevention, 42(6), 1839-1854. doi:10.1016/j.aap.2010.05.005.
[16] Harder, K. A., Kinney, T. A., & Bloomfield, J. (2008). Psychological and roadway correlates of aggressive driving. Minneapolis, MN: University of Minnesota, Center for Transportation Studies, Intelligent Transportation Systems Institute.
[18] Shinar, D. & Compton, R. (2004). Aggressive driving: an observational study of driver, vehicle, and situational variables. Accident Analysis & Prevention, 36(3), 429-437. doi.org/10.1016/S0001-4575(03)00037-X.
[19] Bumgarner, D. J., Webb, J. R., & Dula, C. S. (2016). Forgiveness and adverse driving outcomes within the past five years: Driving anger, driving anger expression, and aggressive driving behaviors as mediators. Transportation Research Part F: Traffic Psychology and Behaviour, 42, 317-331. doi:10.1016/j.trf.2016.07.017.
[20] Precht, L., Keinath, A., & Krems, J. F. (2017). Effects of driving anger on driver behavior – Results from naturalistic driving data. Transportation Research Part F: Traffic Psychol ogy and Behaviour, 45, 75-92. doi:10.1016/j.trf.2016.10.019. [21] Zhang, T., Chan, A. H., Ba, Y., & Zhang, W. (2016). Situational driving anger, driving performance and allocation of visual attention. Transportation Research Part F: Traffic Psychology and Behaviour, 42, 376-388. doi:10.1016/j.trf.20 15.05.008.
[22] Roidl, E., Frehse, B., & Höger, R. (2014). Emotional states of drivers and the impact on speed, acceleration and traffic violations—A simulator study. Accident Analysis & Prevention, 70, 282-292. doi:10.1016/j.aap.2014.04.010. [23] Roidl, E., Siebert, F. W., Oehl, M., & Höger, R. (2013).
Introducing a multivariate model for predicting driving performance: The role of driving anger and personal characteristics. Journal of Safety Research, 47, 47-56. doi:10.1016/j.jsr.2013.08.002.
[24] Berdoulat, E., Vavassori, D., & Sastre, M. T. (2013). Driving anger, emotional and instrumental aggressiveness, and impulsiveness in the prediction of aggressive and transgressive driving. Accident Analysis & Prevention, 50, 758-767. doi:10.1016/j.aap.2012.06.029.
[25] Sani, S. R., Tabibi, Z., Fadardi, J. S., & Stavrinos, D. (2017). Aggression, emotional self-regulation, attentional bias, and cognitive inhibition predict risky driving behavior. Accident Analysis & Prevention, 109, 78-88.
doi:10.1016/j.aap.2017.10.006.
[26] Smorti, M., & Guarnieri, S. (2016). Do aggressive driving and negative emotional driving mediate the link between impulsiveness and risky driving among young Italian drivers?
The Journal of Social Psychology, 156(6), 669-673. doi:10.1080/00224545.2016.1165169.
[27] Dula, C. S., & Ballard, M. E. (2003). Development and Evaluation of a Measure of Dangerous, Aggressive, Negative Emotional, and Risky Driving1. Journal of Applied Social Psychology, 33(2), 263-282. doi:10.1111/j.1559-1816.2003.t b01896.x.
[28] Eboli, L., Mazzulla, G., & Pungillo, G. (2017). The influence of physical and emotional factors on driving style of car drivers: A survey design. Travel Behaviour and Society, 7, 43-51. doi:10.1016/j.tbs.2017.02.001.
[29] Ellison-Potter, P., Bell, P., & Deffenbacher, J. (2001). The Effects of Trait Driving Anger, Anonymity, and Aggressive Stimuli on Aggressive Driving Behavior. Journal of Applied Social Psychology, 31(2), 431-443. doi:10.1111/j.1559-1816 .2001.tb00204.x.
[30] Habtemichael, F. G., & Santos, L. D. (2014). Crash risk evaluation of aggressive driving on motorways: Microscopic traffic simulation approach. Transportation Research Part F: Traffic Psychology and Behaviour, 23, 101-112. doi:10.1016/j.trf.2013.12.022.
[31] Herrero-Fernández, D., & Fonseca-Baeza, S. (2017). Angry thoughts in Spanish drivers and their relationship with crash-related events. The mediation effect of aggressive and risky driving. Accident Analysis & Prevention, 106, 99-108. doi:10.1016/j.aap.2017.05.015.
[32] Jallais, C., Gabaude, C., & Paire-Ficout, L. (2014). When emotions disturb the localization of road elements: Effects of anger and sadness. Transportation Research Part F: Traffic Psychology and Behaviour, 23, 125-132. doi:10.1016/j.trf.20 13.12.023.
[33] Lemercier, C. & Cellier, J.M. (2008). Attention deficits in car driving: Inattention, distraction, and interference. Le Travail Humain, 71(3), 96. doi: 10.3917/th.713.0271.