6298 OPTIMIZATION OF RP-HPLC METHOD FOR SIMULTANEOUS ESTIMATION
OF DOLUTEGRAVIR AND RILPIVIRINE IN BINARY MIXTURE BY USING DESIGN OF EXPERIMENTS
Dasari Vasavi devi1*, Dugasani Swarnalatha2, Gopireddy Venkata Subbareddy3
1Research Scholar, JNTUA Anantapuramu-515002, Andhra Pradesh, India.
2Annamacharya College of Pharmacy, Rajampeta-516126, Andhra Pradesh, India.
3JNTUA College of Engineering, Pulivendula- 516390, Andhra Pradesh, India.
*Corresponding author E-mail: [email protected]
ARTICLE INFO ABSTRACT
Key Words
RP-HPLC, Central composite design,
Chemometric, Dolutegravir,
Rilpivirine.
The present study describes the simultaneous assessment of the antiretroviral drugs in the binary mixture with the help of design of experiments for enhancing the robustness. The column employed was Kromosil 250 ×2.1mm, 1.7µ with temperature 30°C. The ranges of the independent variables used for the optimization were flow rate 0.9 to 1.1, wavelength 255 to 265 nm and composition of buffer in the mobile phase is 55 to 65 %. The influence of these independent variables on the output responses: retention time, peak area and resolution were evaluated. The three responses were simultaneous optimized by using central composite design. Optimum conditions chosen for the assay were flow rate 0.998ml/min, wavelength 257 nm and buffer and Acetonitrile taken in the ratio 57.4: 42.6 respectively. The retention time of Dolutegravir and Rilpivirine are 3.962 and 2.977 minutes respectively by employing the optimum conditions given by the design experiments. All the system suitability parameters were satisfied. Further the method has been validated by the regulatory guidelines framed by the ICH. The limit of detection and the limit of quantification were found to be 0.24 and 0.72 for Rilpivirine and 0.10 and 0.30 for Dolutegravir respectively. The method was found to be simple, linear, accurate, precise and robust. Hence the proposed method can be used for routine quality control of Dolutegravir and Rilpivirine in its tablet dosage forms.
INTRODUCTION
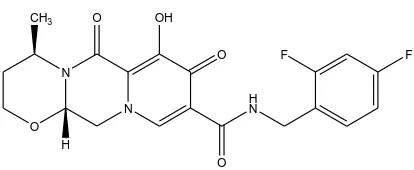
Dolutegravir sodium chemically,
(4R,12aS)- 9- {[(2,4-difluorophenyl)
methyl] carbamoyl} -
4-methyl-6,8-dioxo- 3,4,6,8,12,12a-
Hexahydro-2H-pyrido [1',2':4,5] pyrazino
[2,1-b][1,3]oxazin-7-olate, is a novel integrase stand transfer inhibitor active against Human Immunodeficiency Virus as shown in Figure 1. Dolutegravir (DTG) promoted
name as Tivicay is an antiretroviral prescription utilized together with other drug to treat human immunodeficiency
infection (HIV)- acquired immune
deficiency syndrome. The drug is active against HIV type 1 (HIV-1) and also has some in vitro activity against HIV type 2 (HIV-2) (drug bank DB08930). It is taken through rally. DTG is a HIV integrase
An Elsevier Indexed Journal ISSN-2230-7346
6299 strand exchange inhibitor which hinders
the working of HIC integrase which is required for viral replication (Steigbigel et al., 2008; Takao M, 2011).
N N
H N
O
F F
OH O
O H CH3
O
Fig 1. Structure of Dolutegravir
Rilpivirine is chemically known as
4-{[4-({4-[(1E)-2- cyanoeth-1-en-1-yl]-2,
6-dimethylphenyl} amino) pyrimidin-2-yl] amino} benzonitrile was shown in fig 2 (drug bank DB08864). It is non-nucleoside reverse transcriptase inhibitor (NNRTI), it had been developed for treatment of ARV naïve HIV-I infected patients to have better safety/ tolerability profile compared to other NNRTIs (such as nevirapine, efavirenz and etravirine) (Goebel F et al.,2006 ; Poznaik A et al., 2009). It is a di-amino pyrimidine derivative. It acts by binding to reverse trancriptase which results in block in RNA and DNA- dependent DNA polymerase activities. One such activity is HIV-I replication. It is an E-isomer (M.Sharma et al., 2013; R.
Schrijversa et al., 2011).
H N
N
N HN
C N
C
N
Fig 2. Structure of Rilpivirine
Previously, the normal practice to build up an analytical method in liquid chromatography was performed by a trial and error approach, for instance by shifting one-factor-at- a- time (OFAT) and examine at the resolution of peaks until the
best technique was found. This
methodology was tedious and required a huge amount of manual data elucidation. It regularly came about in a non-robust
performance when moved into another lab since interactions between factors were not considered. The OFAT approach should possibly be utilized if the client needs to
comprehend selectivity changes, for
example in the event that everything is fixed and just one factor is shifted and if the factor of interest is known not to have an intuitive impact with any other factor studied. Hence chemometric technique have been progressively seen as valuable complements to high performance liquid
chromatographic practices, since an
extensive number of factors can be at the same time controlled to accomplish the
ideal separations. A fruitful
implementation of experimental design in HPLC can be executed through four common stages; choosing the conventional design, suitable software, experimental trails, data analysis and interpretation (Sahu et al., 2018). This design of experiments was applied for the quality analysis of the antiviral drugs in standards and in dosage for m after a vast literature
survey. Either individually or in
combination with other dosage forms there is some spectrophotometer (Masthanamma Sk et al., 2014), HPLC (A.Yasodha et al.,
2017; Raj Kumar et al., 2014;
6300 Experimental
Material and reagents
Dolutegravir reference standard is procured from Dr.Reddy’s Laboratory and
Rilpivirine reference standard were
procured as gift sample from Hetero, Hyderabad, India. HPLC grade reagents were purchased from Rankem chemicals.
HPLC equipment and chromatographic conditions
The chromatographic separation was carried out by Waters Acquity HPLC with binary solvent manager, equipped with PDA detector and auto sampler. The Empower 2 software was used for signal monitoring, data collection and data processing. In addition, an electronic
balance (BL-220H; Shimadzu
Corporation), a pH meter (ELICO® LI 120), a sonicator (PCi, Mumbai) has been employed in this study.
Optimization of analytical variables by employing software
After initial screening of the conditions like stationary phase, mobile phase the method has been gone for optimization by using Design Expert 10.0.0.8 trail version software. In this software, Central composite design under
the category of Response surface
methodology (RSM) have been employed to design a set of experimental runs by concerning the three independent variables i.e., flow rate, wavelength and % of buffer in the mobile phase. Here the independent variables ranges were entered along with their actual levels. The levels used were tabulated in (Table.1). In the experimental design central composite design was followed with three factors, 2 levels, responses and 20 experimental runs. These three factors have an effect on the dependent variables i.e., retention time, resolution and peak area for both Rilpivirine and Dolutegravir.
Chromatographic conditions: The final conditions optimized by the software include 0.99ml/min. flow rate, 257.06nm of wave length and buffer ratio 57.4% in the mobile phase. The HPLC analysis was
performed on reverse phase high
performance liquid chromatographic
systems with using a mobile phase of Acetonitrile and buffer (0.01N Potassium dihyrogen ortho phosphate buffer) on Kromosil 250 X 2.1mm, 1.7m with flow rate 0.998ml/min at 257 nm using TUV detector. The column temperature has been maintained at 30°C with an injection volume 10 mL. flowed by the run time of 7 minutes, the comparison of initial HPLC method and optimized HPLC method from Design Expert experiments are drawn in the (Table.2). Design- Expert 10 trail
version have been used for the
experimental design, data analysis and desirability function calculations. The rest of the calculations for the analysis were performed with the help of Microsoft Excel 2007 software (Microsoft, USA).
Standard solutions preparations: Accurately weighed and transferred 25mg of Dolutegravir and 12.5 mg of Rilpivirine working Standards into a 50ml clean dry volumetric flask, add 3/4th volume of diluent, sonicated for 5 minutes and make up to the final volume with diluents. 1ml from the above two stock solutions was taken into a 10ml volumetric flask and made up to 10ml.
Mobile phase preparation: The mobile
phase used was 0.01N Potassium
dihydrogen ortho phosphate and
Acetonitrile in the ratio of 57.4: 42.6 respectively. The buffer have been prepared by accurately weighed 1.36 gm of Potassium dihydrogen ortho phosphate in a 1000ml of volumetric flask add about 900ml 0f milli-Q water and sonicate to degas and finally make up the volume with water then add 1ml of Triethylamine then
pH adjusted to 3.0 with dil.
6301 Assessment of validation parameters:
As per ICH guidelines, analytical method was known to be validated if it has been evaluated through characteristics such as accuracy, precision, linearity, limit of detection, limit of quantification and
robustness. The characteristics of
analytical method should be within prescribed limit and defined standards to confirm its accuracy and authenticity. Spiking, mean, standard deviations and relative standard deviation are the terms used to measure the characteristics for a validation of an analytical method.
Accuracy as recovery : The accuracy of the technique was dictated by computing percentage recovery of Dolutegravir and Rilpivirine. By applying standard addition strategy for both the drugs recovery studies have been carried out at three unique concentrations such as 50, 100 and 150% of label claim. At each dimension ICH recommendation for performing accuracy
was minimum triplicate at each
concentration and results acquired were compared.
Table1. Variables selected in Central Composite Design
Factors Levels used
Low(-1) Medium(0) High(+1)
Independent variables Flow rate
Buffer in mobile phase Wavelength
Dependent variables tR- Dolu
tR- Ril
Area-Dolu Area-Ril Resolution
0.9 55 255
3.07 2.53
2.77679E+006 532918 3.5
1 60 260
4.06 3.09
3.58319E+006 668730 5.16025
1.1 65 265
4.9 3.6
4.66929E+006 898096 6.4
Table2. A comparison of initial HPLC method, optimized HPLC method from Design Expert Experiments
Parameter Initial method Optimized method
Column
Injection volume Column temperature Flow rate
Detection Mobile phase
Run time
Kromosil 250 X 2.1mm, 1.7m 10µL
30°C 1 ml/min 257 nm
40:60 ACN & 0.01N Potassium dihyrogen ortho phosphate
7 minutes
Kromosil 250 X 2.1mm, 1.7m 10µL
30°C
0.998ml/min 257.06 nm
42.6:57.4 ACN & 0.01N Potassium dihyrogen ortho phosphate
7 minutes
6302 Table3. Experimental factors and responses by using Central Composite Design data matrix Design point Factor 1 Flow rate ml/min Factor 2 Buffer % Factor 3 Wavelength nm Response 1 tR Dolu
Response 2 tR- Rilp
Response 3 Area- Dolu Response 4 Area- Rilp Response 5 Resolution 1 2 3 4 5 6 7 8 9 10 11 12 13 14 15 16 17 18 19 20 0.9 0.9 1 1 1.1 1 1 1 1 1.1 1.1 1 1.16818 0.831821 0.9 0.9 1 1 1 1.1 65 65 51.591 68.409 55 60 60 60 60 55 65 60 60 60 55 55 60 60 60 65 265 255 260 260 255 260 260 260 260 265 265 260 260 260 265 255 260 251.591 268.409 255 3.774 3.772 4.9 3.2 3.9 3.7 3.78 3.78 3.79 3.94 3.08 3.79 3.23 4.52 4.86 4.85 3.79 3.78 3.79 3.07 2.962 3.107 3.5 2.7 2.9 2.9 2.97 2.94 2.97 2.93 2.54 2.97 2.57 3.53 3.6 3.59 2.98 2.96 2.97 2.53 3166485 3970276 3552648 3664394 3304412 3535505 3547858 3571523 3559023 2783926 2846777 3633533 3093037 4669293 3464634 3476003 3601976 3445156 2776791 3371198 649616 711927 674074 700268 588815 674041 674697 680631 678365 580472 584659 690714 589500 898096 716025 705644 684113 575147 532918 602934 5.2 4.4 6.4 3.5 5.7 5 4.9 4.9 4.9 5.6 3.8 4.7 4.1 4.8 5.3 5.1 4.8 4.7 4.7 3.7
Precision: Precision is the closeness agreement between series of measurement obtained from multiple sampling of homogenous sample under prescribed conditions. Precision includes repeatability and intra laboratory repeatability; both were performed for six replicates at concentration of and 50 ppm Dolutegravir and 25 ppm Rilpivirine, respectively.
Linearity and calibration range: Linearity was established from 25 to 150 % of working standard concentration using minimum of six calibration levels (25, 50, 75, 100, 125 and 150 %) having a range of 12.5 to 75 ppm for Dolutegravir and 6.25
to 37.5 ppm for Rilpivirine. The
calibration curve was plotted as the concentration of the reference standard of substance against peak area and linearity of the method was evaluated by regression analysis.
Limit of detection and Limit of quantification: The detection limit and quantification limit of method were obtained from the following formulae:
LOD = 3.3× (σ/S) LOQ = 10× (σ/S)
Where
σ = standard deviation of response and S = slope obtained from calibration
curves of linear study.
Robustness: A few parameters like flow rate, percentage of organic phase and temperature were changed deliberately for the robustness evaluation using HPLC method. One factor was changed at one time to estimate the effect. Each factor selected was changes at three levels (-1, 0, +1) with respect to the optimized parameters. Robustness of the method was done at the concentration level 50 ppm and 25 ppm Dolutegravir and Rilpivirine, respectively.
6303 Acid degradation: For the determination
of acid stress conditions 1 ml of stocks solution Rilpivirin and Dolutegravir 1ml of 2N Hydrochloric acid was added and refluxed for 30mins at 60°C .The resultant
solution was diluted to obtain
(25ppm&50ppm) solution and 3 µl solutions were injected into the system and the chromatograms were recorded to assess the stability of sample.
Alkaline degradation: To 1 ml of stock solution Rilpivirin and Dolutegravir 1 ml of 2 N Sodium hydroxide was added and refluxed for 30mins at 60°C. The resultant
solution was diluted to obtain
(25ppm&50ppm) solution and 3 µl were
injected into the system and the
chromatograms were recorded to assess the stability of sample.
Peroxide degradation (oxidation): To 1 ml of stock solution of Rilpivirin and Dolutegravir 1 ml of 20% hydrogen peroxide (H2O2) was added separately. The
solutions were kept for 30 min at 60°C. For HPLC study, the resultant solution was diluted to obtain (25ppm&50ppm) solution and 3 µl were injected into the system and the chromatograms were recorded to assess the stability of sample.
Photolytic degradation (photo stability studies): The photochemical stability of the drug was also studied by exposing the (250ppm&500ppm) solution to UV Light by keeping the beaker in UV Chamber for 7days or 200 Watt hours/m2 in photo stability chamber. For HPLC study, the resultant solution was diluted to obtain (25ppm&50ppm) solutions and 3 µl were
injected into the system and the
chromatograms were recorded to assess the stability of sample.
Thermal degradation (Dry heat degradation studies): The standard drug solution was placed in oven at 105°C for 6 h to study dry heat degradation. For HPLC study, the resultant solution was diluted to (25ppm&50ppm) solution and 3µl were
injected into the system and the
chromatograms were recorded to assess the stability of the sample.
Hydrolytic degradation (neutral degradation): Stress testing under neutral conditions was studied by refluxing the drug in water for 6hrs at a temperature of 60ºC. For HPLC study, the resultant solution was diluted to (25ppm&50ppm) solution and 3 µl were injected into the system and the chromatograms were recorded to assess the stability of the sample.
Analysis in the marketed dosage form: About 20 tablets were weighed and calculate the average weight of each tablet then the weight equivalent to one tablet was transferred into a 100mL volumetric flask, 50mL of diluent added and sonicated for 25 min, further the volume made up with diluent and filtered. From the filtered solution 1ml was pipetted out into a 10 ml volumetric flask and made upto 10ml with diluent.
RESULTS AND DISCUSSION
Optimization of Central composite design (CCD): The method optimization was performed by employing design expert software. Three factors and five responses were selected for randomized
response surface central composite
quadratic design using 20 experimental runs tabulated in (Table.3). Various factors optimized were flow rate, wavelength and % buffer in the mobile phase. The limits of these variables were set to yield specific desired numerical conditions for retention time, peak area and resolution. The effects of independent variables on the responses
for the 20 experimental runs are
summarized in (Table.4). The polynomial equations for the response generated by ANOVA are depicted below: Retention time (tR Dolu) = +3.77 -0.40 * A -0.49* B
+5.771E-003 * C +0.059 * AB
6304 +0.035 * A2 +0.097 * B2 +3.539E-003
* C2
Retention time (tR Ril) = +2.96 0.29 * A
-0.24 * B -5.725E-003 * C +0.045 * AB +0.022 * AC -0.022 * BC +0.029 * A2 +0.046 * B2 -1.426E-003 * C2
Peak area (Dolu)= +3.582E+006
3.238E+005 * A +37614.42 * B -2.185E+005 * C -8310.87 * AB -28718.37 * AC 99544.62 * BC +59094.27 * A2 -37299.94 * B2 -2.132E+005 * C2
Peak area (Rilp) = +6.810E+005
-69219.93 * A +163.50 * B
-10951.89 * C +9804.00 *AB
+3164.00* AC -10328.00 * BC
+18602.92* A2 -1417.75 * B2
-48489.31* C2. Resolution = +4.81
-0.17 * A -0.69 * B +0.073 * C -0.38 *
AB -0.12 * AC +0.100 * BC
The above equations in terms of coded factors can be used to make predictions about the response for given levels of each factor. By default, the high levels of the factors are coded as +1 and the low levels of the factors are coded as -1. The coded equation is useful for identifying the relative impact of the factors by comparing the factor coefficients.
With the help of design expert software the model was obtained and it was validated by using ANOVA. The results are depicted in (Tables.5, 6&7). By using a lack of fit test, the model was examined which indicated a significant lack of fit value corresponding with a lower p-value as compared to the model F-value. From the ANOVA results, the model F-value of D and R implied that the model was significant.
Table 4. Summary results for responses in Quadratic model
Response Models Adjusted
R2
Predicted R2
SD PRESS %
CV
Adequate precision tR- Dolu
tR- Rilp
Area-Dolu Area- Rilp Resolution Quadratic Quadratic Quadratic Quadratic 2FI 0.9965 0.9908 0.7413 0.8837 0.8780 0.9928 0.9755 -0.0556 0.5393 0.7396 0.032 0.031 2.155E+005 26856.61 0.24 0.040 0.049 3.601E+012 5.430E+010 2.38 0.83 1.03 6.24 4.07 5.04 79.005 48.534 11.039 17.093 17.138
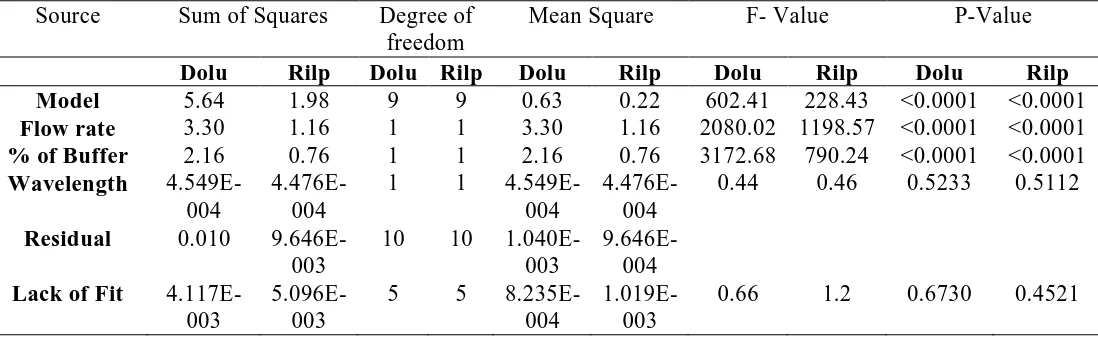
Table 5. Summary results of ANOVA statistical analysis for models and response (tR) for finally suggested Quadratic model
Source Sum of Squares Degree of
freedom
Mean Square F- Value P-Value
Dolu Rilp Dolu Rilp Dolu Rilp Dolu Rilp Dolu Rilp
Model Flow rate % of Buffer Wavelength
Residual
Lack of Fit
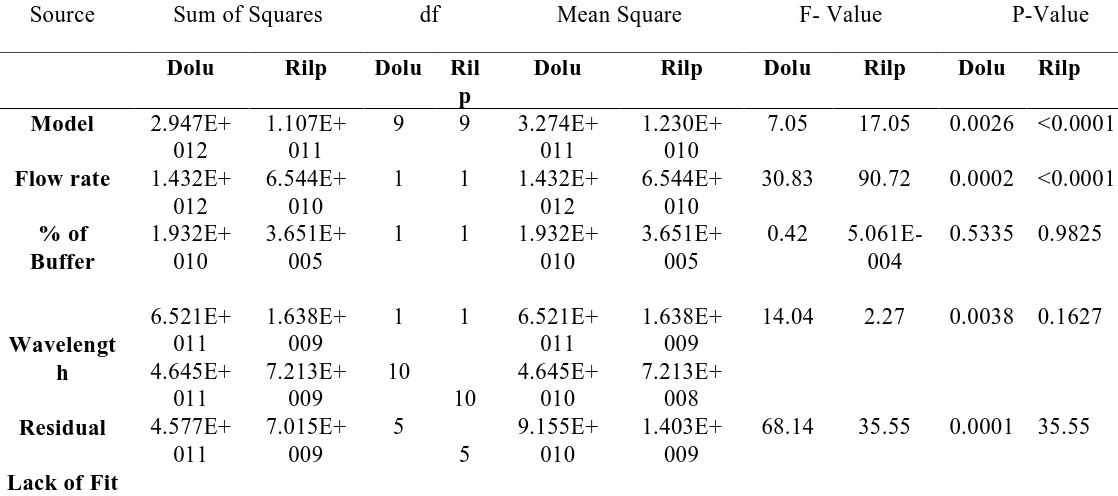
6305 Table 6. Statistical analysis for factors and response (Peak area) by ANOVA for response
surface quadratic model
Source Sum of Squares df Mean Square F- Value P-Value
Dolu Rilp Dolu Ril p
Dolu Rilp Dolu Rilp Dolu Rilp
Model
Flow rate
% of Buffer
Wavelengt h
Residual
Lack of Fit
2.947E+ 012 1.432E+
012 1.932E+
010
6.521E+ 011 4.645E+
011 4.577E+
011
1.107E+ 011 6.544E+
010 3.651E+
005
1.638E+ 009 7.213E+
009 7.015E+
009
9
1
1
1
10
5 9
1
1
1
10
5
3.274E+ 011 1.432E+
012 1.932E+
010
6.521E+ 011 4.645E+
010 9.155E+
010
1.230E+ 010 6.544E+
010 3.651E+
005
1.638E+ 009 7.213E+
008 1.403E+
009
7.05
30.83
0.42
14.04
68.14
17.05
90.72
5.061E-004
2.27
35.55
0.0026
0.0002
0.5335
0.0038
0.0001
<0.0001
<0.0001
0.9825
0.1627
35.55
Table7. Statistical analysis for factors and response (Resolution) by ANOVA for response surface quadratic model
Source Sum of Squares Degree of freedom Mean Square F- Value P-Value
Model Flow rate % of Buffer Wavelength Residual Lack of Fit
8.39 0.41 6.58 0.073
0.76 0.71
6 1 1 1 13
8
1.40 0.41 6.58 0.073 0.059 0.089
23.80 7.04 111.87
1.25
8.33
<0.0001 0.0199 <0.0001
0.2846
0.0159
6306 Table8. Optimized method- Report card
Response Variable Initial method Optimized method
Predicted by DE Experimental values Retention time- Ril
Retention time- Dolu Peak Area- Rilp Peak Area- Dolu Resolution
2.973 3.802 670712 3595513 5.5
3.096 4.062 668730 3583196 5.16
2.970 3.958 661335 3625220 5.2
Table9. Linearity Concentration (ppm)
Rilpivirine
Concentration (ppm) Dolutegravir
Linearity Range 6.25
12.5 18.75
25 31.25
37.5
12.5 25 37.5
50 62.5
75
25 50 75 100 125 150
Table10. Validation summary and SST parameters
Parameter Rilpivirine Dolutegravir
Linearity range
Correlation coefficient Slope
Intercept LOD(ppm) LOQ (ppm)
Accuracy (Recovery %) Precision (% RSD) Repeatability
Intermediate precision Robustness
Retention time (min) USP Resolution USP Plate Count Asymmetry factor
25- 150% 0.999 26403
2860 0.24 0.72 100.19
0.335 0.4509 Robust 2.977
_ 4640
1.21
25- 150% 0.999 70991 5343
0.10 0.30 99.86
0.361 0.499 Robust
3.962 5 5293
1.23
Table11. Results of Robustness studies
Robustness parameter % RSD for Dolutegravir % RSD for Rilpivirine Flow rate (0.898mL/min)
Flow rate (1.198mL/min) Mobile phase (- 5%) Mobile phase (+5%) Temperature (28°C) Temperature (32°C)
1.32 1.5 0.9 1.2 1.42 1.89
6307 Table12. Summary of forced degradation results
Stress conditions
Dolutegravir Rilpivirine
Degradation (%)
Purity of angle
Purity of Threshold
Degradation (%)
Purity of angle
Purity of Threshold
Acid 6.11982 1.041 1.251 5.96 0.224 0.428
Alkali 5.55613 0.932 1.265 5.65 0.193 0.430
Peroxide 3.15966 0.778 1.010 3.95 0.209 0.406
Neutral 1.05 0.199 0.390 1.93 1.185 1.139
Thermal 0.81 0.231 0.3851 2.18 0.979 1.175
Photolytic 0.14 0.212 0.413 0.49 0.931 1.134
Table13. Assay results obtained by the proposed method for the drugs in pharmaceutical preparations
Parameter Rilpivirine Dolutegravir
Mean peak area Recovery (%)
RSD (%)
667360 100.26
0.36
3595957 99.59
0.39
Table14. System suitability parameters of Drug product Peak name Retention
time (min)
Peak area USP tailing USP plate count
USP resolution
Rilpivirine 2.987 3718205 1.29 4916 4.9
Dolutegravir 3.976 616699 1.24 4403 -
The perturbation plots are constructed to evaluate the effect of the factors on the retention time, peak area of each drug and resolution. The chromatogram of standard Dolutegravir and Rilpivirine at optimized conditions obtained by the design is shown in (fig 3). The results of system suitability parameters like resolution, plate count, peak area and asymmetric factor were measured to verify optimum conditions are within the limit. The comparison of initially developed method and optimized method predicted by the design and experimental values are reported in (Table.8).
Results of validation parameters: The optimized method was validated in compliance with ICH guidelines. Average percentage recovery for Dolutegravir and Rilpivirine were found to be 99.86 and 100.19% respectively, while % RSD values are less than 1% indicating accuracy of the repeated method. The calibration curve was found to be linear
over the range of 25- 150% with concentration range of Dolutegravir was 12.5-75 ppm and of Rilpivirine was 6.25-37.5 ppm respectively (Table.9). The limit of detection and limit of quantification for Dolutegravir was found to be 0.10 and 0.30 ppm and for Rilpivirine 0.24 and 0.72 ppm, respectively. The precision data
representing both repeatability and
intermediate precision are summarized in (Table.10). The % RSD values for both repeatability and intermediate precision were less than 2% which indicates that the proposed method is precise. The results for
validation and system suitability
6308 robust. The % RSD was calculated, which
was found to be in permissible limit.
Stability studies results: The sample was subjected to various stress conditions and the stability of the method was observed. The results of stability studies (Table.12) revealed that the method is stability indicating.
Analysis of tablet formulation:The validated method conditions has been employed for the estimation of the Dolutegravir and Rilpivirine content in a commercially available brand of the tablet containing 50 mg of Dolutegravir and 25 mg of Rilpivirine (Juluca). The potency of the tablet formulation sample was found to be 99.47 % of Dolutegravir and 99.62% of Rilpivirine, respectively (Table.13). and the system suitability parameters of drug product is shown in (Table.14). The amount measured was in good agreement with the label claims. The results of the assay indicated that the method was selective for analysis of Dolutegravir and Rilpivirine without interference from the excipients (fig 4).
CONCLUSION
A fruitful, simple, robust chemometric
approach for RP-HPLC method
development technique has been utilized
for Dolutegravir and Rilpivirine.
Comparison of experimental results with predicted results illustrated the preciseness of the design. The stability of the developed technique was shown by exposing the drug to different stress conditions. The acquired results revealed that the stability indicating power of the strategy. Further validation was performed in consistence with ICH guidelines and robustness of the method was checked by
changing three chromatographic
parameters. The validation result indicates strategy meets the regulatory aspects; henceforth concerning the method done, it very well may be utilized in the routine
quality control examination of the
pharmaceutical formulation.
REFERENCES
1. Addepalli V Raju, Appala Raju
Nemala., Development and
Validation of a LC-MS/MS
Method for the Determination of Rilpivirine in Sprague Dawley Rat Serum and Its Application to
Pharmacokinetic Study. Asian
Journal of Biomedical and
Pharmaceutical Sciences. 2013; 3(21): 23-29.
2. Brahmaiah Marineni, Vangala
Krishna, T.Sreenivasulu reddy., A validated stability indicating HPLC assay method for Rilpivirine Hcl in bulk drug. International Journal of Pharmacy and Biological Sciences. 2013; 3(4): 278-287.
3. Girija B. Bhavar, Sanjay S.
Pekamwar, Kiran B. Aher,
Ravindra S. Thorat, Sanjay R.
Chaudhari., High-performance
liquid chromatographic and
high-performance thin-layer
chromatographic method for the
quantitative estimation of
Dolutegravir sodium in bulk drug and pharmaceutical dosage form. Sci Pharm. 2016; 84: 305–320.
4. Goebel F, Yakovlev A, Pozniak
AL, Vinogradova E, Boogaerts G, Hoetelmans R, et al. Short-term antiviral activity of TMC278-a novel NNRTI-in treatment-naive
HIV-1-infected subjects. AIDS
2006; 20:1721-6
5. http://www.drugbank.ca/drugs/DB
08864
6. http://www.drugbank.ca/drugs/DB
08930
7. International Conference on
6309 Requirements for Registration of
Pharmaceuticals for Human use.
Validation of analytical
procedures: text and methodology ICH Q2 (R1), 2005.
8. Masthanamma Sk and Alekhya
Gottumukkala., Development and
validation of UV
spectrophotometric methods for estimation of Rilpivirine in bulk and pharmaceutical formulation.
International Journal of
Pharmaceutical Sciences and
Research. 2014; 5(2): 69-70.
9. Nitin Charbe, Sara Baldelli, Valeria Cozzi, Simone Castoldi, Dario Cattaneo,
10.Emilio Clementi., Development of an HPLC–UV assay method for the simultaneous quantification of nine antiretroviral agents in the plasma of HIV-infected patients. Journal of Pharmaceutical Analysis. 2016; 6: 396–403.
11.Poznaik A, Ramirez M, Mohap L. 48-week Primary Analysis of Trail
TMC 278-C204: TMC 278
Demonstrate Potent and Sustained Efficacy in ART-Naive Patients. 14th Conference on Retroviruses and Opportunistic Infections; 2007
12.Prafulla Kumar Sahu, Nageswara Rao Ramisetti, Teresa Cecchi, Suryakanta Swain, Chandra Sekhar
Patro, Jagadeesh Panda., An
overview of experimental designs in HPLC method development and
validation. Journal of
pharmaceutical and biomedical
analysis. 2018; 147: 590-611.
13.Raj Kumar. B, Subrahmanyam. K. V., A validated stability-indicating
RP-HPLC method for the
determination of Rilpivirine.
Journal of Global Trends in
Pharmaceutical Sciences. 2014; 5(3): 1822 – 1826.
14.Saidulu. P, Mastanamma. Sk.,
Stability indicating gradient RP-HPLC method for the simultaneous
estimation of Lamivudine,
Abacavir and Dolutegravir in bulk and their combined dosage form. Int. J. Pharm. Sci. Rev. Res. 2016; 37(2): 249-257.
15.Sandeep Reddy Katla, Venisetty Raj Kumar and Sridhar Thota., Estimation of Rilpivirine in bulk and pharmaceutical dosage form. Der Pharmacia Lettre. 2014; 6 (1): 146-151.
16.Schrijversa.R, Desimmiea. B,
Debysera. Z., Rilpivirine: a step forward in tailored HIV treatment, J Lancet, 2011; 378: 201-3.
17.Sharma.M and Saravolatz. L.D., Rilpivirine: a new nonnucleoside reverses transcriptase inhibitor,
Journal of Antimicrobial
Chemotherapy, 68(2); 250-256: 2013.
18.Somsubhra Ghosh, Sowjanya
Bomma, V. Laxmi Prasanna, S. Vidyadhar, David Banji, Subhadip Roy., Method development and validation of Rilpivirine in bulk and Tablet doses form by RP-HPLC method. Research J. Pharm. and Tech. 2013; 6(3): 240-243.
19.Sonam Patel, Krishnaveni
Nagappan, Gouru Santhosh
Reddy., A new quantitative reverse
phase high-performance liquid
chromatographic method for the
quantification of Rilpivirine
hydrochloride in bulk and dosage
form. Journal of Applied
Pharmaceutical Science. 2018;
6310
20.Steigbigel RT, Cooper DA, Kumar
PN, Eron JE, Schechter M, Markowitz M, et al. Raltegravir with optimized background therapy for resistant HIV-1 infection. N Engl J Med 2008; 359:339-54.
21.Takao M. Non-enzymatic functions
of retroviral integrase: The next target for novel anti-HIV drug
development. Virology 2011;
2:210.
22.Uttam Prasad Panigrahy and A. Sunil Kumar Reddy., A novel validated RP-HPLC method for the
simultaneous estimation of
Emtricitabine, Tenofovir
Disoproxil Fumarate and
Rilpivirine in bulk and
pharmaceutical tablet dosage
forms. Der Pharmacia Lettre, 2015; 7 (1):303-314
23.Veeraswami B, Naveen Vmk.,
Development and validation of RP-HPLC method for the estimation of Dolutegravir and Rilpivirine in bulk and Pharmaceutical dosage form and its application to rat plasma. Asian J Pharm Clin Res. 2019; 12(2):267-271.
24.Venkatesan.S, Kannappan. N, and
Sai Sandeep Mannemala.,
Stability-indicating HPLC method for the simultaneous determination
of HIV tablet containing
Emtricitabine, Tenofovir
Disoproxil Fumarate, and
Rilpivirine Hydrochloride in
pharmaceutical dosage forms.
International Scholarly Research Notices. 2014; 1-9.
25.Yasodha .A, Rani. J, Venkataih. G, Sivakumar.A., RP-HPLC method development and validation of Rilpivirine. Int. J. of Pharmacy and
Analytical Research. 2017;