Available Online At www.ijpret.com
INTERNATIONAL JOURNAL OF PURE AND
APPLIED RESEARCH IN ENGINEERING AND
TECHNOLOGY
A PATH FOR HORIZING YOUR INNOVATIVE WORK
MULTILEVEL DATA HIDING FOR REVERSIBILITY USING HISTOGRAM SHIFTING
P.H.PAWAR
Computer Department, SGBAU, Amravati,BNCOE, Pusad, INDIA.
Accepted Date:
27/02/2013 Publish Date:
01/04/2013
Keywords
Data Hiding,
Reversible,
Watermarking,
Multilevel,
Pure Payload
Corresponding Author
Mr. P. H. Pawar
Abstract
Available Online At www.ijpret.com I.INTRODUCTION
Development of computer technology and
widespread use of internet have driven this
world into fast-changing digital place. With
digitization of multimedia contents,
everybody can access multimedia contents
more easily than in analog age. Even if
digitization of multimedia contents provides
more opportunities to media contents, it
also provide easy access paths to copy and
distribution of digital contents, because of
characteristics of the digital data,
represented by 0 and 1. As the copy and
distribution of digital contents are widely
conducted illegally in internet environment,
the copyright holders began to pay
attention to copyright protection
technologies. Off the technologies that can
protect copyright of digital contents, data
hiding technology has received keen
interests from research communities Data
hiding process is to be such that the
modifications of the media are
imperceptible. For images same as digital
watermarking, is the process of embedding
information into a digital signal which may
be used to verify its authenticity or the
identity of its owners. In digital
watermarking, it describes methods and
technologies that hide information, for
example a number or text, in digital media,
such as images, video or audio. The
embedding takes place by manipulating the
content of the digital data, which means the
information is not embedded in the frame
around the data. The hiding process has this
means that the modifications of the pixel
values have to be invisible. The signal may
be audio, pictures, or video. If the signal is
copied, then the information also is carried
in copy. Reversible data embedding [7],
which is also called lossless data
embedding, embeds invisible data (which is
called a payload) into a digital image in a
reversible fashion. As a basic requirement,
the quality degradation on the image after
data embedding should be low. An
intriguing feature of reversible data
embedding is the reversibility, that is, one
can remove the embedded data to restore
the original image. From the information
hiding point of view, reversible data
embedding hides some information in a
digital image in such a way that an
authorized party could decode the hidden
Available Online At www.ijpret.com
its original, pristine state. The performance
of a reversible data-embedding algorithm
can be measured by the following.
1) Payload capacity limit: what is the
maximal amount of information can be
embedded?
2) Visual quality: how is the visual quality on
the embedded image?
3) Complexity: what is the algorithm
complexity?
The motivation of reversible data
embedding is distortion-free data
embedding [1]. Though imperceptible,
embedding some data will inevitably
change the original content. Even a very
slight change in pixel values may not be
desirable, especially in sensitive imagery,
such as military data and medical data. In
such a scenario, every bit of information is
important. Any change will affect the
intelligence of the image, and the access to
the original, raw data is always required.
From the application point of view,
reversible data embedding can be used as
an information carrier. Since the difference
between the embedded image and original
image is almost imperceptible from human
eyes, reversible data embedding could be
thought as a covert communication
channel. In this paper, we present a
high-capacity, high visual quality, low
computational complexity and reversible
data embedding method for digital images.
We divide the image into non-overlapping
blocks (e.g.4,16,etc.) and then generating
the intensity histogram of each block and
with it utilizes maximum point and
minimum point to embed the data.
A. Existing Methods: Most of the existing
data hiding techniques are not reversible.
The well-known least significant bit plane
(LSB) based schemes [4] are not lossless
owing to bit replacement without
“memory”. Secondly, Circular interpretation
on histogram for reversible watermarking
[5] uses modulo 256 addition data hiding
scheme, but it also suffers from noise.
Thirdly, Distortion-free data embedding for
images [6] suggested that the method is
suitable for a large amount of data hiding.
Still the payload is not large enough for
some applications. Specifically , the
embedding capacity estimated by
Available Online At www.ijpret.com
512x512x8 image & the PSNR of the
Marked Image Vs. Original Image is 39
dB. Fourthly, “Distortion less data hiding based on Integer Wavelet Transform” [7]
suggested that the method is suitable
for increasing the payload dramatically
as ranges from 15 to 94 kb for
512x512x8 grayscale image at the same
24-36 dB a relatively low PSNR of the
marked image compared with the
original image. This indicates the quality
of a marked image is degraded & not
satisfies aim at authentication.
Fifthly,“Reversible Data Embedding “ by
Ni et.al[1] is onethe most capacity efficient data hiding system while keeping good
visual quality for all natural images .
But compared to our proposed method, its
data hiding capacity is less as well as visual
quality of image is low and its
computational complexity is also high. The
propose method solve these problems.
II.PROPOSED METHOD
The proposed method based on block
division is used here to improve the data
hiding capacity, the marked image quality
and to improve in hiding places of
information in the image. The method is
explained in a block diagram shown in
Figure 1 below.
This technique divides the system into 3
stages as 1) Dividing the original image into
non-overlapping 4-tiles. 2) Processing stage
and 3) Embedding stage
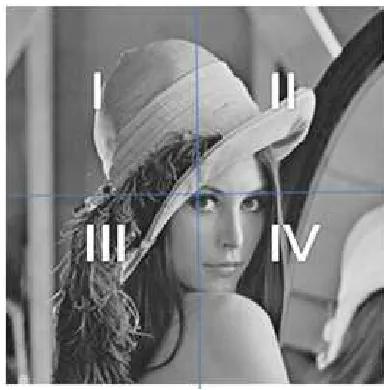
In first stage, we have to divide the original
image into non-overlapping blocks (called
as tiles) as shown in following Figure 2 and
then apply the steps of processing stage
(i.e. generating of intensity histogram for
each image tile as shown in Figure 3 and
then finding of pair/pairs [1] based on pure
payload to each block and embedding stage
(i.e. shifting of histogram and embedding
hidden data at peak point of histogram
generated), considering each tile as a
separate image.
A. Embedding algorithm with one pair of
maximum and minimum Points
This algorithm [1] uses minimum point as
overhead bookkeeping information and is
explain in detailed as follows.
For an M×N image, each pixel grayscale
value x∈ [0,255].
Available Online At www.ijpret.com
2. In the histogram H(x), find the
maximum point h(a) a∈ [0,255] ¸ and the
minimum point
Fig. 1 Block diagram of data embedding
using proposed method
3. If the minimum point h(b) > 0, recode
the coordinate (i, j) of those pixels and the
pixel grayscale value bas overhead
bookkeeping information). Then set h(b)
=0.
4. Without loss of generality, assume a<b.
Move the whole part of the histogram H (
x) with x∈ (a,b) to the right by 1 unit.
This means that all the pixel grayscale
values (satisfying x∈ (a,b)) are added by
1.
5. Scan the image, once meet the pixel
(whose grayscale value isa), check the
to-be-embedded bit. If the to-to-be-embedded
bit is “1”, the pixel grayscale value is
changed to a+ 1. If the bit is “0”, the pixel
value remainsa.
Now, if the image is partitioned into
sub-images, the so-called image tiles, and the
histogram shifting is applied to each image
tile, not only the below drawbacks are
overcome but some additional benefits can
be gained.
Drawbacks as
1) If the intensity of the pixels in a region of
the maximum and minimum range of the
histogram, then their values are also
modified.
2) If the minimum frequency of the
histogram is non-zero, the coordinates of all
the pixels with minimum frequency have to
be embedded as side information. This
restricts the data hiding capacity of the
system.
Available Online At www.ijpret.com
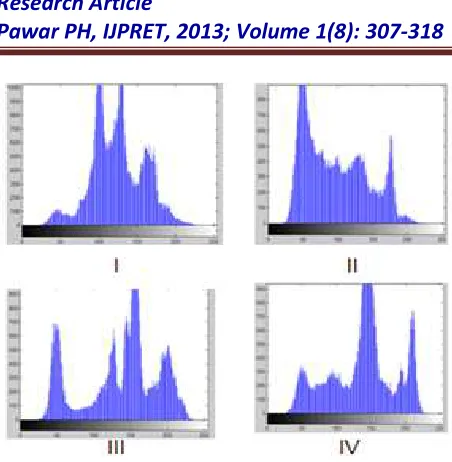
Fig. 3 Histogram of each block
Benefits include
1) High payload
In the shifted-histogram based data hiding
method, the maximum number of hidden
bits is equal to the maximum frequency of
the pixel intensity histogram. When the
histograms of the image tiles are
considered separately, it is known that the
sum of individual maxima is greater than
the maximum of the original image
intensity histogram. Hence shifted
histograms of the image tiles can hide more
data.
2) Narrower histogram
Most image tiles have much narrower
histogram than that of the whole image.
This leads to the important properties for
data hiding.
a) In the histogram of the whole image the
minimum frequency may not be zero.
Hence for reversible data hiding, their
positions need to be identified and given as
side information, which reduce the data
hiding capacity. On the other hand, in the
narrower histograms of the image tiles, the
minimum frequencies are more likely to be
zero. b) Narrower histograms provide the
opportunities of selecting the most suitable
pairs of peaks-zeros that will increase the
quality of the marked images.
c) Individual histogram
Individual histogram makes it possible to
distribute the embedded bits among the
whole image. This improves the level of
hiding places.
The two steps of our embedding of
watermark and its detection will be as
follows
B. Embedding
1. The image is first divided into Nb
Available Online At www.ijpret.com
intensity histogram of each image tile is
generated.
2. In each image tile, for a given number of
pure payload to be embedded and n (peak,
zero) pairs, the pairs are chosen such that
the image quality is either maximized (least
distances between the chosen pairs).
3. For each of these pairs for each image
tile, apply Steps 3-5 described in section II A
above. That is, we treat each of these pairs
for each image tile as a case of one pair of
maximum and minimum points.
The number of image tiles, Nb, number of
(peak, zero) pairs n, their positions will be
treated as side information that needs to be
transmitted to the receiving side for data
retrieval.
C. Detection
For the given Nb, and n, the following
process is used to extract the secret
message from marked image and the
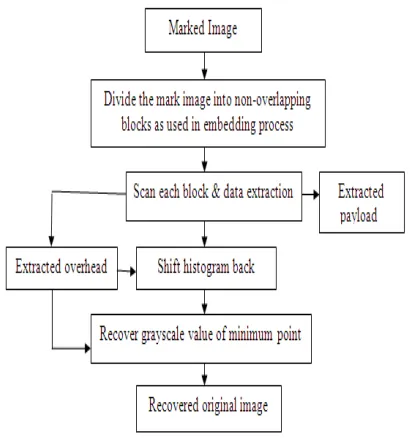
lossless recovery of the host image. The
process is explained with flow diagram
shown in figure 4 and algorithm below.
Firstly, the image is divided into Nb image
tiles. Then apply the extraction algorithm
[1] presented below to each image tile.
Assume the grayscale value of the
maximum point and the minimum points
are a andb, respectively. Without loss of
generality, assume a<b. The marked image
is of sizeM × N , each pixel grayscale value
x∈ [0, 255].
1. Scan the marked image in the same
sequential order as that used in the
embedding procedure. If a pixel with its
grayscale value a+1 is encountered, a bit
“1” is extracted. If a pixel with its value ais
encountered, a bit “0” is extracted.
2. Scan the image again, for any pixel whose
grayscale value x∈ [a,b] ¸ the pixel value
x is subtracted by 1.
3. If there is overhead bookkeeping
information found in the extracted data, set
the pixel grayscale value (whose coordinate
(i, j) is saved in the overhead) asb.
From the step 1, we can able to extract the
payload and overhead information. With
step 2, histogram comes to its original
Available Online At www.ijpret.com
value whose coordinate ( i,j) is saved in
the overhead as b, if there is overhead
bookkeeping information found in the
extracted data. As, it recovers grayscale
value of minimum point, original image is
recovered.
Fig. 4 Block diagram for data extraction
algorithm for one pair of maximum and
minimum point applying to one tile.
In this way, the original image can be
recovered without any distortion for each
of these pairs for each image tile. Treat
each of these pairs for each image tile of
maximum and minimum points aandb,
respectively. The marked image is of size
M xN , each pixel grayscale value x∈ [0,
255].
III.EXPERIMENTAL RESULTS AND ANALYSIS
We have tested the performance of the
proposed method for 4 image tiles of
different size and format commonly used
test images, texture images, medical
images, aerial images and coral images.
Here, results are discuss and analysis for
test images only. The original image sizes
shown in figure.5 were 512× 512 pixels
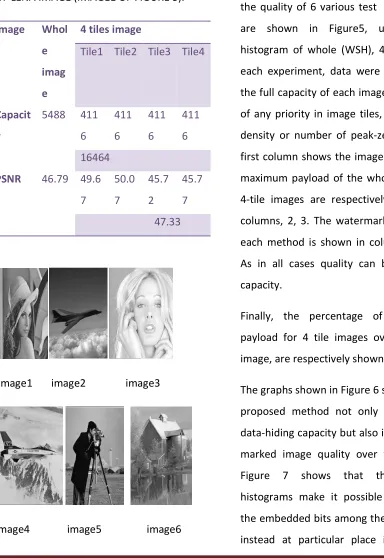
with 8 bit resolution.Table1 summarizes the
results of Lena image (image1 of Figure 5)
tiles , with respect to that of whole image
.As the table shows, tiled images have
higher data hiding capability and still do
have a better watermarked image quality.
By using four tiles the overall capacity is
16,464 bits/whole image, which is almost
more extra payload compared to using the
whole image and average marked image
quality of 47.33 dB, or 0.015 dB
improvement in quality. The number of
peak-zero pairs can vary from one tile to
another and they can be arranged such that
for instance, the watermarked image
Available Online At www.ijpret.com
TABLE I- MAXIMUM CAPACITY AND
MARKED QUALITY OF WHOLE AND 4TILES
OF LENA IMAGE (IMAGE1 OF FIGURE 5).
Image Whol
e
imag
e
4 tiles image
Tile1 Tile2 Tile3 Tile4
Capacit
y
5488 411
6
411
6
411
6
411
6
16464
PSNR 46.79 49.6
7
50.0
7
45.7
2
45.7
7
47.33
image1 image2 image3
image4 image5 image6
Fig. 5 Six original test images
Table 2 shows the maximum payload and
the quality of 6 various test images which
are shown in Figure5, under shifted
histogram of whole (WSH), 4-tile(TSH-4).In
each experiment, data were embedded at
the full capacity of each image, without use
of any priority in image tiles, their spectral
density or number of peak-zero pairs. The
first column shows the image used and the
maximum payload of the whole image and
4-tile images are respectively depicted in
columns, 2, 3. The watermarked quality of
each method is shown in columns 4 and5.
As in all cases quality can be traded for
capacity.
Finally, the percentage of increase in
payload for 4 tile images over the whole
image, are respectively shown in columns 6.
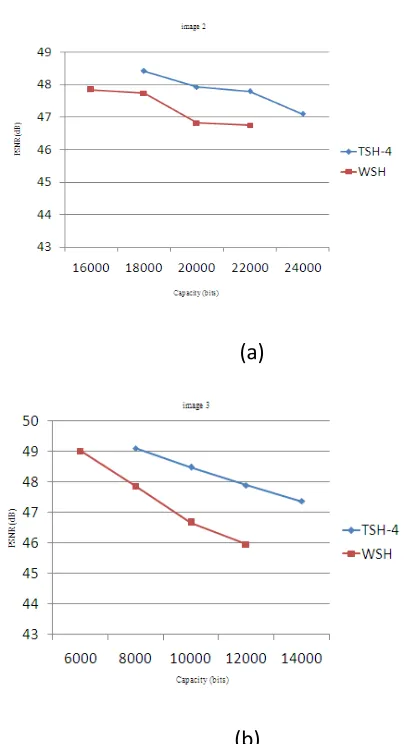
The graphs shown in Figure 6 states that the
proposed method not only improves the
data-hiding capacity but also improves the
marked image quality over whole image.
Figure 7 shows that the individual
histograms make it possible to distribute
the embedded bits among the whole image
Available Online At www.ijpret.com
improves the level of hiding places as well
as level of security in images. Table 2 also
indicates that 5%-200% capacity
improvement with still better image quality,
depending on the image content. In all
improving the marked image quality, while
maintaining high data embedding capability
as well as levels of hiding places.
TABLE II- MAXIMUM CAPACITY & MARKED
QUALITY OF WHOLE AND 4 TILES OF
GENERALLY USED IMAGES
Image Pure payload
PSNR of
marked images (dB)
% chang
e in
increa
se in
capaci ty
WSH TSH-4 WS H TSH-4 image 1
5488 1646 4 46.7 9 47.3 3 200 image 2 1616 8 1828 8 47.8 3 48.4 1 12 image 3
8776 1113 6 47.3 0 48.1 5 30 Image 4 5998 2 6298 2 45.5 6 45.6 3 05 Image 5 2000 0 2250 0 45.9 8 46.2 9 12.5 Image 6 1431 2 2227 2 46.1 9 46.2 9 50 (a) (b)
Fig 6 PSNR versus capacity of two tiled
images (a) image 2 (b) image 3
Available Online At www.ijpret.com
Fig 7 (a) Histogram of embed image by WSH
(b) Histogram of embed image by TSH-4
IV .CONCLUSIONS
We have shown that data-hiding based on
the shifted histogram is better to be applied
to image tiles than the image itself. This not
only improves the data-hiding capacity, but
also improves the marked image quality.
Improvement in payload capacity is due to
the fact that sum of the peaks of the
individual pixel intensity histogram is
greater than the single peak of the image
histogram itself and the individual
histograms are much narrower and sharper
than the histogram of the image itself,
creating more possibility for zeros, it helps
in the coordinates of all the pixels with
minimum frequency have not to be
embedded; it also helps in increasing the
data hiding capacity, as well as making
distances between the peaks zeros, such
that data can be free from disturbance. As a
result, less displacement between pairs of
maximum point and minimum point, it
improves the quality of an image. Finally
individual histograms make it possible to
distribute the embedded bits among the
image. This improves the level of hiding
places and as equally pure payload to each
tile of image, for low embedding rate also it
is useful to distribute the embedded bits
among the whole image. This results in
more robustness of system.
REFERENCES
1. Zhicheng Ni , Yun-Qing Shi, Nirwan
Ansari, and Wei Su,”Reversible Data
Embedding”,IEEE Transactions on Circuits
and Systems for Video Technology, vol.16,
no.3, 2006.
2. Wen-Chung Kuo , Po-Yu Lai and
Lih-Chyau Wuu,”Adaptive Reversible
3. Data Hiding Based on Histogram”,10th
IEEE International Conference on Intelligent
Systems Design and Applications,
pp.1376-1381, 2010.
4. Shiuh-Jeng Wang, Chi-Yao Weng,
Dushyant Goyal, “Multilevel Data Hiding for
Embedding Reversibility Upon Improving
Histogram Shifting”, IEEE, pp.137-141,
2010.
5. M. M. Yeung and F. C. Mintzer, “Invisible
Available Online At www.ijpret.com Electron. Image., vol. 7, no. 3, pp. 578–591,
1998.
6. C. De Vleeschouwer, J. F. Delaigle, and B.
Macq, “Circular interpretation on
histogram for reversible watermarking,” in
IEEE International Multimedia Signal
Processing Workshop, France, pp. 345–350,
2001.
7. M. Goljan, J. Fridrich, and R. Du,
“Distortion-free data embedding,” in
Proceeding. 4th Information. Hiding
Workshop, Pittsburgh, PA, pp. 27–41.
8. G. Xuan, J. Zhu, J. Chen, Y. Q. Shi, Z. Ni, and W. Su, “Distortionless data hiding based
on integer wavelet transform,” IEE Electron.
Letters, vol.38, no. 25, pp. 1646– 1648,