Lech Kipiński
1, 2, Andrzej Maciejowski
1Analysis of Brain Evoked Potentials
Based on Digital Registered Single-Trial Responses
Analiza wywołanych potencjałów mózgowych
na podstawie archiwizowanych cyfrowo pojedynczych odpowiedzi
1 Department of Pathophysiology, Wroclaw Medical University, Poland
2 Institute of Biomedical Engineering and Instrumentation, Wroclaw University of Technology, Poland
Abstract
Studies of brain evoked responses variability (e. g. habituation effect, relationships between spontaneous brain activity and evoked potentials (EPs) or ongoing EEG-noise analysis) need non-averaged, single-trial signals, which were rarely registered in Poland. The Department of Pathophysiology of Wroclaw Medical University was for many years gathering a lot of digital, binary data acquired by STELLA and NEUROMIC own-constructed measurement systems. This data are very interesting for planned research. In this paper the authors present a review of brain evoked responses variability and describe modern methods of analysis of non-averaged, single-trial responses. In order to achieve this, the authors want to take advantage of progressive mathematical tools, e.g. time-frequency analysis methods and advanced statistical techniques as well as high-tech IT tools. Selected methods are illustrated with the use of own measurement material. They will be used in research of the function of human nervous system based on recorded single-trial responses. In the future, it will be used in verification of their clinical applications (Adv Clin Exp Med 2010, 19, 3, 289–299).
Key words: single-trial EPs, averaging, variability of brain evoked responses, ongoing EEG-noise, maximum likeli-hood method, EPs mapping, time-frequency analysis.
Streszczenie
Aby badać zmienność mózgowych potencjałów wywołanych, w tym zjawisko habituacji, korelacje między odpo-wiedziami wywołanymi mózgu (EPs) a jego aktywnością spontaniczną (EEG) oraz zanalizować charakter szumu w pomiarach encefalograficznych, potrzeba sygnałów nieuśrednionych, które w Polsce rzadko były rejestrowane i archiwizowane. W Katedrze i Zakładzie Patofizjologii Akademii Medycznej we Wrocławiu przez lata zgroma-dzono liczny zbiór zapisanych binarnie danych, pochodzących z opracowanych tam autorskich systemów pomia-rowych STELLA i NEUROMIC. Zgromadzone dane stanowią wyjątkowo interesujący materiał badawczy. W pracy przedstawiono przegląd literatury na temat zagadnień dotyczących zmienności odpowiedzi wywołanych mózgu oraz metod analizy nieuśrednionych, pojedynczych sygnałów mózgowych z zastosowaniem nowoczesnych narzędzi matematycznych, obejmujących analizę sygnałów w dziedzinie czasu i częstotliwości, a także zaawansowane meto-dy statystyczne i informatyczne. Wybrane metometo-dy zilustrowano z wykorzystaniem własnego materiału badaw-czego autorów. Znajdą one zastosowanie w badaniach poznawczych ośrodkowego układu nerwowego opartych na zarchiwizowanych, pojedynczych sygnałach mózgowych. W przyszłości posłuży to do weryfikacji ich przydatności klinicznej (Adv Clin Exp Med 2010, 19, 3, 289–299).
Słowa kluczowe: pojedyncze potencjały wywołane, metoda uśredniania, zmienność odpowiedzi wywołanych mózgu, szum pomiarowy EEG, metoda największej wiarogodności, mapowanie EPs, czasowo-częstotliwościowa analiza sygnałów.
Adv Clin Exp Med 2010, 19, 3, 289–299 ISSN 1230-025X
EDITORIAL
© Copyright by Wroclaw Medical University
It is extremely difficult to describe the mecha-nism of action of the human brain. Many years of studies on the activity of central nervous system
is especially important, is the analysis of associa-tion processes, which is necessary to understand numerous neurological and mental disorders, as well as to conduct studies on human intelligence. Experiments based on the newest diagnostic tools like magnetoencephalography (MEG) [1], or func-tional magnetic resonance imaging (fMRI) [2] give a lot of hope for the future. However, such studies are very expensive and require the most advanced measuring devices, which means they may be per-formed only in the world’s leading institutions. Another hope for medicine is development of new analytical tools that would allow drawing conclu-sions on the basis of previously collected research material. This would be possible thanks to cooper-ation between medical circles and representatives of various fields of science.
In recent years, a remarkable progress in devel-opment of mathematical tools used in analysis of numerical data may be observed, which brought a new quality to studies of biomedical signals. This is possible thanks to development of compu-ter technology allowing to implement advanced mathematical algorithms, which was still impos-sible a few years ago.
This paper is a review of non-standard meth-ods of evoked potentials (EPs) analysis based on digital registered non-averaged measurement data. The Department of Pathophysiology of Wroclaw Medical University is in possession of a large set of single-trial responses, mainly visual evoked poten-tials (VEP), which were collected from subjects suffering from various disorders, as well as from healthy volunteers. The use of modern mathemati-cal tools and computer techniques allows to take full advantage of information contained in the reg-istered data.
The main part of this paper presents results of studies being part of medicine, biology and other fields of science. The studies concerned methodol-ogy of description and modelling of brain activ-ity based on non-averaged single-trial evoked responses. This approach makes it possible to obtain information that was being lost during the commonly used averaging procedure. According to many authors, the procedure is based on assump-tions which are not correct from the physical point of view.
The paper also presents current knowledge on evoked potential variability, the character of measurement artefacts and methods of their elim-ination, as well as correlations between evoked responses and spontaneous brain activity, which are unjustifiably omitted in clinical studies. Since measurement data availability and free access to records is often a problem in studies, the paper also discusses issues related to conversion of
regis-tered signals to commonly used data formats. The example presented in the paper shows that digital recording techniques allow long-term storage of information and its usage for scientific purposes in the future, when more advanced analytical and diagnostic methods will be developed.
The discussed research techniques are illus-trated with non-standard graphic presentation developed on the basis of the authors’ own research material. Some of the visualisation techniques used are original designs.
Averaging
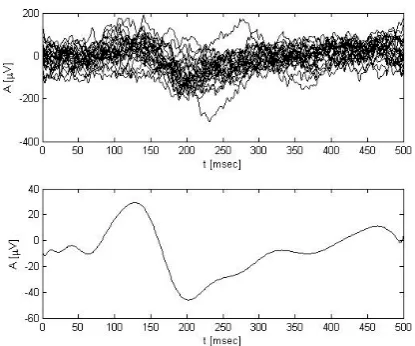
Measurement of brain evoked potentials is accompanied by high level of background noise. Therefore, separation of useful signals from meas-urement data requires averaging of a series of sin-gle-trial responses to a repeated stimulus [3]. This aim is achieved by repeated stimulation of recep-tors with identical stimuli, and averaging is applied to a series of trials (each of which is a combina-tion of single response to applied stimulacombina-tion and noise) synchronized with measurement exposure. In theory, the average obtained in measurements is a good estimator of evoked response, in case of fulfilment of assumptions concerning additivity and independence of evoked response and meas-urement background, as well as stochastic, station-ary and stimulation-independent noise character and strictly deterministic brain response to the repeated stimulus [4]. The idea of the averaging technique is shown in Fig. 1.
Averaging is a method used in EP studies all over the world due to its simplicity, which allows its application in common clinical diagnostics. However, it has also some disadvantages related to technical aspects of measurement [3] and the character of the measured signal [4–8]. First of all, the postulated reproducibility of responses evoked by an identical stimulus is actually only approximation. It should also be mentioned that averaging suppresses a lot of important informa-tion about the nervous system contained in single registrations.
Variability of Evoked
Responses
par-ticular waves. This situation may result from two physiological processes taking place in the human brain processing the same piece of information. These processes are called sensitization and habit-uation.
Sensitization is a phenomenon defined as activation of brain which is repeatedly stimulat-ed by one stimulus. It is manifeststimulat-ed by increasstimulat-ed amplitude of the measured potential in the course of subjecting the nervous system to subsequent stimuli. Wave latency undergoes shortening, too. This effect is usually observed in the first stage of the study (several or several dozens of first stimu-lations) and disappears with time. It is known that stimulus frequency is the factor of greater impor-tance for the occurrence of sensitization that stim-ulus intensity.
The other phenomenon, habituation, reflects the process of brain adaptation to repeated identi-cal external stimuli. It is manifested as a decrease in brain evoked response to a stimulus. The pro-cess becomes more intense in the course of time. Literature describes four basic types of this phe-nomenon [5]: late habituation occurring a few minutes after exposure to stimulus; early habitu-ation observed in the second response (out of two) evoked by stimuli occurring in less than 10
seconds, as a decrease in relation to the preced-ing response; a decrease of response resultpreced-ing from time overlap of potentials evoked by two stimuli (with a very short interval between subsequent stimulations), and habituation conditioned by the applied stimulus and resulting from a psychologi-cal reaction following a stimulus of a semantic type. It has been observed that late habituation is usually related to waves of the latency 100–300 ms and is best observed in visual evoked potentials (VEPs), whereas early habituation depends to a great extent on the length of interval between subsequent stim-ulations and may involve the effect mentioned in the third subsection. The last of the above-men-tioned habituation types depends on the influence of association processes on brain evoked response and is related to long-latency potentials.
It must be emphasised that habituation is not a global process, but rather occurs in brain areas specific to a particular stimulation. For example, Ravden and Poich [9] have shown that habitua-tion of the P300 wave observed for visual stimula-tion is especially intense at electrodes Fz and Cz). Therefore, precise observation of habituation is possible only with multi-channel measurements, which was noticed by Sielużycki [10].
Noise Type in EPs
Measurements
The noise occurring during EP measurements comes from electromagnetic waves which are not related to evoked brain response to a given stimu-lus. Autogenous and exogenous artefacts must be taken into account. The former are generated dur-ing all electrophysiological processes takdur-ing place in the human body during the examination. Their values often exceed the useful signal. One example may be provided by α waves, whose amplitude is 30–100 μV, i.e. more than the amplitude of evoked potentials. Miopotentials and heart electrical activ-ity are also common autogenous artefacts. Many of them are difficult to eliminate. Endogenous artefacts come from electrical devices working in the measurement laboratory or in its close prox-imity or even from vibrations of steel (ferromag-netic) building materials. They are eliminated by effective separation of measurement devices from the background [3]. The procedures will not be discussed here.
The assumption of averaging is that ongoing noise has normal distribution with the expected value zero. However, according to Gaura [10] this assumption may be wrong, and the character (distribution) of noise depends on localization. Another assumption of averaging is that the
meas-Fig. 1. Single-trial electrical brain responses evoked by the same visual stimulus, hidden in the spontaneous brain activity (EEG) and random noise (graph one). The same VEP signal presented as averaged corti-cal response to visual stimulus from 300 trials, after removal of low- and high-pass disturbances and elec-trical network disturbances (graph two). Own research
ured signal constitutes linear combination of back-ground and typical evoked response, which are not correlated to one another. Numerous experiments reveal, however, that EPs depend in a sense on other coinciding processes taking place in human brain. These may include responses evoked by stimuli having different modality than stimula-tion, especially spontaneous activity.
The paper [11] has described the influence of θ waves on the amplitude of visual evoked potentials occurring in the cortical region and generating this kind of spontaneous activity. Also δ [12] and α [13] waves are in a sense functionally related to accompanying reception and processing of stimuli. Chacron and his partners have obtained results indicating that spontaneous activity has an influence (usually strengthening) on the observed variability of nervous cell response during numer-ous repetitions of activation [14]. On the other hand, Polich reports relationships between brain waves and evoked activity, emphasizing an indi-vidual type of correlation [15]. At the same time, he has observed a correlation between δ, θ and α waves and the P300 component, both with visual and acoustic stimulation [16]. What is interest-ing, these studies have not revealed a correlation between EEG and the remaining waves of evoked response, and it should be mentioned that P300 is
considered to be a component related to the pro-cesses of cognition and association.
These and numerous other studies have led to formulation of the oscillatory brain theory pro-posed for the first time by Sayers et al in [17]. It postulates that evoked brain responses result from phase and frequency reorganization of sponta-neous activity, which serves as a background for brain processing of information contained in the external stimulus. One may distinguish event related synchronisation (ERS) and desynchronisa-tion (ERD) of brain waves, depending on the fre-quency and amplitude of brain spontaneous activ-ity, as well as on the mutual phase between evoked response and basic EEG activity [18]. These phe-nomena are related to more advanced brain activ-ity such as remembering, keeping attention and processing semantic stimuli [19].
The above considerations show that EPs variability and the correlation between EEG and evoked responses (which also cause a certain vari-ability of curve record morphology) can no lon-ger be omitted in studies. Attempts to estimate evoked responses with regard to their amplitude variability, which the authors are familiar with, are still based on oversimplifications such as the assumption of stochastic and Gaussian character of the noise and additivity and independence of
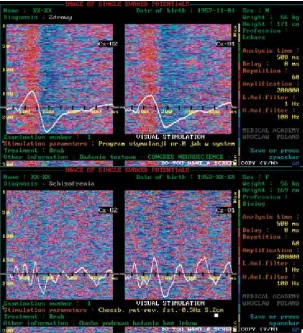
Fig. 2. Method of presentation of single brain responses in the form of colour images comprising lines (each line in the picture correspond to one single-trial), whose ampli-tude is matched by the colour scale. Synchronization of nervous struc-ture responses to a visual stimuli is much greater in a healthy subject (top) that in a subject with schizo-phrenia (bottom). Printout from STELLA computer system. Own research
responses resulting from the measurement back-ground. Nevertheless, analysis with the use of such algorithms may be conducted, since they may also lead to new interesting conclusions. On the other hand, verification of commonly made assumptions seems to be important. It involves a careful exami-nation of the nature of the analysed phenomenon and the necessity to find a better method of estima-tion evoked by the stimulus of brain activity. Only precise knowledge about the correlation between EPs and their electrophysiological background will be able to improve correctness of this diagnostic method in the future.
Variability of brain potentials registered directly after stimulation with an external stimu-lus may be presented graphically, e.g. by means of colour images comprising lines, whose signal amplitude is matched by the colour scale. It gives a lot of additional information about variability of evoked responses. For instance, it allows monitor-ing of instability of smonitor-ingle responses to the repeated stimulus and determination of their change topog-raphy in normal and pathological conditions. The authors have created sample images for a healthy subject and a subject with schizophrenia (Fig. 2) with the use of own computer programme.
For example, a healthy subject is character-ized with stability of electrical potential registered during interaction with a visual stimuli, showing the development of particular waves of evoked response, e.g. P100. This stability confirms physi-ological reproducibility of single evoked respons-es, which are the effect of processing of one and the same stimulus in the brain. Analogical picture obtained from a subject with recognized schizo-phrenia reveals significant differences in single evoked potentials, which after averaging produce a curve of changed morphology. Synchronization of nervous structure responses to a visual stimuli is much greater in a healthy subject that in a subject with schizophrenia.
Pre-Processing
of Registered Data
According to literature, all studies should be based on non-averaged, single brain responses to identical external stimuli. Such signals were vir-tually not registered in Poland due to commonly used methods of averaging. One exception is the Department of Pathophysiology of Wroclaw Medical University, where such signals were reg-istered under the supervision of Professor Józef Jagielski with the use of the STELLA (STimulated ELectroencephalogram on-Line Analyser) and NEUROMIC (NEUROn – MICrocomputer)
sys-tems [20, 21]. The syssys-tems were used to register and analyse auditory (from the brain cortex and stem), visual and somatosensoric EPs. STELLA used a unified CAMACsystem and the processing computer was MERA 400 microcomputer, which was replaced by the IBM PC in the NEUROMIC system. Data from both system were regularly stored in the computer library in 1985–2000. At present, there are more than 600 studies with com-plete medical documentation. Some of these stud-ies were already used in the past to observe EPs habituation, which was signalled in [22, 23].
Each study is represented by three archive files: file with information data; file with measurement data from the left hemisphere; file with measure-ment data from the right hemisphere.
The data have large clinical value, since the information files contain a full record identifying the study and the patient. A sample information file is recorded as follows:
NAME AND PRENAME : Jan Kowalski DATE OF BIRTH : 1957–02–30 SEX : M
CLINICAL DIAGNOSIS : healthy …
… …
LEADS : Cz–O1, Cz–O2 STIMULATION PARAMETERS : Stimulation programme No 0. TREATMENT:...
In order to use the data, it should be primarily converted from a specific binary system to one of the most common data codes used for programming and computing environments. The simplest and at the same time the most common code is ASCII, which may be read by means of basic applications of operating systems. It is also a natural method of data saving among programming and computing environments, out of which the package Matlab by MathWorks Inc. is worth mentioning. In practice, data is loaded into the workspace and subjected to segregation to the matrix form, in which lines con-stitute subsequent requests and columns are signal trials. Then they are saved as ASCII file. The matrix notation of measurement data helps in further data processing, also with the use of computing modules of the Matlab environment.
Mathematical Methods
of Data Analysis
groups, depending on the methodology used. The first group comprises studies based on math-ematical models used strictly to describe EPs variability that mainly use advanced methods of statistical inference. Papers belonging to this group use already existing techniques and stud-ies exploring the problem of EPs estimation on the basis of non-averaged measurement record. A separate issue is related to methods of interfer-ence filtration and signal decomposition, which are alternative to averaging. These methods are based on the Fourier transform, the Wigner transform, the wavelet transform, matching pur-suit algorithm, independent components analysis and others. Some of them are briefly presented below. Methods presented in this paper can and should be used also in other aspects of single EPs studies, such as verification of assumptions on the independence of EPs and background noise, and on the strictly deterministic character of evoked potential.
Estimation of EPs Variability
by Means of Maximum
Likelihood Method
If one uses the assumptions of the averaging technique, it is not difficult to show that the aver-age of registered data from all trials is the estima-tor of maximum likelihood (ML) for the evoked response [6]. When a more realistic assumption about trial-to-trial variability of evoked response is made, one may develop a maximum likeli-hood model to estimate the response by defining parameters for its variability. An example of such behaviour is presented in [24], where the proposed model accounts for both variability of amplitude and latency in single responses. However, this model is based on multi-channel measurements with an incorrect assumption of uncorrelated noise in different channels [25].
Truccolo et al. has proposed an alternative method [7]. In his study, ongoing noise elimina-tion and analysis of EPs variability are performed with the use of such statistical methods as analysis of variance and signal spectrum, as well as cor-related measurements: own correlation and spec-trum coherence. Its advantage is accounting for variability of component amplitude of EPs signal and variable wave latency.
A similar, although numerically simpler, mathematical model was proposed by de Munk et al. [6]. It may be used to eliminate noise from the measured signal and to study physiological variability of EPs, which should bring interesting results, also due to a very rich collection of various
measurement data gathered by the authors. Gaura [10] has indicated that it may also prove useful in the analysis of noise parameters.
The authors are also interested in continua-tion of the study developed by Sielużycki [4]. In order to successfully eliminate noise, the author uses information about its spacial and time cor-relation. However, in contrast to the original model, he enables estimation of variability of EPs amplitude characterizing each measurement channel
The measured response is described as:
,
) ( )( )
( k
ij ij k ii k
ij
R
R
=
α
+
ε
(1)where i indexes measurement channels, and j is
the sample number in the trial k. The R(k) value
represents the ongoing signal (of the k trial) and
is the sum of the brain response R (modulated
by the coefficient of amplitude variability α(k))
and random background noise ε (which has nor-mal distribution with the expected value zero). Maximum likelihood method was used to deter-mine the evoked response estimator R, the evoked
response amplitude variability estimator α(k), and
the estimators of noise time covariance matrix
T and noise space covariance matrix X with the
following formulas:
; 1 ( ) (k)
k k R K
R=
∑
+α (2); )] (
)[
( ( ) 1 1 1 1 1 )
(k =diag RkT−RTX− diag RT−RTX− −
α (3)
); (
) (
1 R() ( )R X 1 R() ()R
IK
T k T k k
k k
α
α −
−
=
∑
− (4). ) (
) (
1 () (k) 1 (k) (k) T k
k RT R R
R JK
X =
∑
−α − −α (5)Estimator values are determined with the use of the iterative method, which was shown in [4].
EPs Variability Mapping
The method used to visualise trends of habitua-tion and evoked response stimulahabitua-tion based on the above-mentioned procedures is presented in [26]. The mapping technique is based on recognised methods used in imaging of brain evoke response parameters, such as stereographic projection and interpolation with splines on the plane.
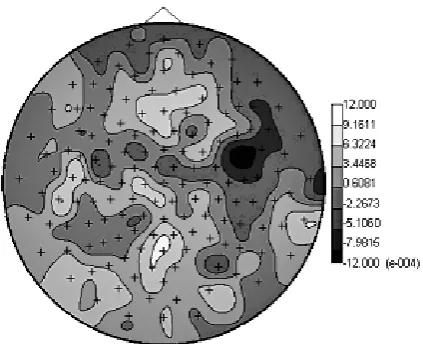
variability of evoked response characterizing par-ticular brain areas, as long as such correlations exist. The map presented in Fig. 3 suggests the presence of such correlations. It may be seen that habituation (dark area) is limited to those regions of cerebral cortex, where responses to the acoustic stimulus are generated. During stimulation of one ear, habituation of response was observed in only one hemisphere.
It should be emphasised that the technique of brain signal mapping is still being developed. One example is provided by our own computer programme for dynamic imaging of EEG signal variability in time, presented by one of the authors of the present study in [27]. It may be successfully used in the suggested studies.
Methods of Spectral Analysis
Spectral analysis is of special importance among methods of EEG analysis. The primary aim of spectral analysis of a physical process is the study of its frequency structure, which in turns provides important information about basic characteristics of the studied physical systems. The distribution of signal in the frequency functions describes spec-tral density of random signal strength (within the
frequency range of 0 to ∞) with the use of spectral
density of mean square value. A commonly used
estimate of spectrum strength is the Fourier trans-form, which in computer systems is determined with the use of the algorithm of Fast Fourier Transform (FFT). This method is used to perform frequency analysis of EPs in order to determine spectral structure of the signal. At the same time it enables determination of frequencies generated by neuronal structures of brain in response to exter-nal stimulus in healthy subjects and in subjects with different pathological conditions [19]. Due to its usefulness, the Fourier transform is commonly used in scientific studies.
A disadvantage of spectrum strength estima-tion with the Fourier transform method is the fact that it is designed to describe stationary signals, i.e. signals with parameters which do not change with time. Description of signal whose frequency characteristic changes with time requires more complex analytical algorithms. A simpler method is to divide the signal into sections and calculate the Fourier transform separately for each section. Such Short-Time (window) Fourier Transform (STFT) may be expressed as:
( ) ( )
, ),
( 2
∫
−∞∞−
−
= x t t e dt
f
W i f
x τ ω τ πτ (6)
where ω(t) is the window function. The wider the
window (longer sections to which one divides the signal), the highest resolution is used to calcu-late the strength spectrum, to the disadvantage of localization in time. Shorter fragments are charac-terised with a reverse correlation.
What is problematic in brain signal analysis is the choice of a proper window width in relation to the signal of unknown qualities [28]. It should be noticed here, that aside to the rectangular win-dow, other window shapes may also be used, e.g. the Gauss window.
Below the authors discuss some alternative mathematical tools used to transform signal in the time and frequency domain.
The Wigner-Ville Transform
This is the oldest method of presenting signals in the time-frequency domain. It goes as follows:
. 2
2 )
,
(
∫
∞ 2∞ −
−
∗
− +
= x t τ x t τ e π dτ
f t
W i f
x (7)
Although it maintains signal energy and bor-der values, its role in determination of unknown signal qualities is limited due to mixed informa-tion hampering interpretainforma-tion [28].
Fig. 3. Coefficients of trends matched to the estima-tor of amplitude variability α (3) for the P100 wave of single evoked response administrated to one ear by means of sound at the frequency of 1 kHz. Own studies (modification from [25] with the co-author’s consent)
The Wavelet Transform
Discrete wavelet transform (DWT) of the sig-nal x(t) may be defined as the scalar product of this
signal with the functions ψa,b(t):
, ) ( ), ( ) ,
(a b x t , t
x
Wψ = ψab (8)
where ψa,b(t) are called wavelet functions (WF).
The trans form is obtained in the process of trans-lation and saling of single primary (mother) wave-let ψ(t):
). ( )
( 12 ,b t a tab
a = −
−
ψ
ψ (9)
In this formula, a is the parameter denoting
scale and b is the shift. The wavelet transform is
usually defined for discrete parameter values aj =
2–j and bj
, k = 2–jk, where (j, k) ∈ Z2:
). 2 ( 2 ) ( 2
,k t j jt k
j = ψ −
ψ (10)
By changing the value of j and k parameters, wavelets are shifted in time with different width. This allows presentation of signal in various scales, i.e. its multi-resolution analysis. A suitable selection of a basic wavelet allows conduction of measurement signal decomposition into a useful part (with energy focused on a small number of scales) and noise scattered over numerous levels of decomposition. After thresholding of selected wavelet coefficients and calculation of reverse dis-crete wavelet transform, the obtained signal will be free of ongoing noise (except for background hav-ing the same time-frequency correlations as EPs). The most common basic wavelets include: Morlet wavelet, Daubechies wavelet, Gauss wavelet and Mexican hat wavelet [29].
Wavelet transform was introduced as a meth-od of signal transformation by S. Mallat [30]. It has found numerous applications in several fields of sci-ence, such as astronomy, geophysics and analysis of images and biomedical signals, including brain sig-nals. Examples of such applications may be found in papers [31, 32]. Signals obtained from wavelet transformation are perfectly suitable for the analy-sis of EPs variability, which was shown in [33].
Matching Pursuit Algorithm
The method of Matching Pursuit (MP) was also proposed by Mallat [34]. To some extent it has been used in the analysis of brain signals, and in Poland it is developed in the Institute of Medical Physics at the Warsaw University of Technology [e.g. 28, 35, 36].
This method is used to obtain signal represen-tation by selection of familiar set of component functions, which carries the largest amount of energy of the described signal. The aim is to mini-mize the number of functions forming the repre-sentation. Component functions are selected form the set (dictionary) of functions, which are well-established in the time-frequency plane and whose size is much greater than the size of the orthogonal base of the approximate signal. Since the selection of the best representation is in practice impossible to perform, the algorithm is to select such a func-tion form the dicfunc-tionary that would represent the largest percentage of the signal energy, and after matching to repeat the same action with reference to the rest of the signal. The procedure is iterative-ly repeated for subsequent residues until the fixed final criterion is fulfilled. The criterion is usually the number of functions used to describe the signal or reaching a satisfactory proportion of the signal energy in its representation. This way, matching of the following formula is obtained:
∑
=
+
+
= M
n
n
nx g g R x
R
x n n
0
1 ,
, γ γ (11)
where x stands for the approximate signal, gγn –
wave being matched, Rnx – subsequent residues of
the process.
A typical function dictionary consist of the Gabora functions, which gives optimal localization in the time-frequency plane from the perspective of the uncertainty principle [35].
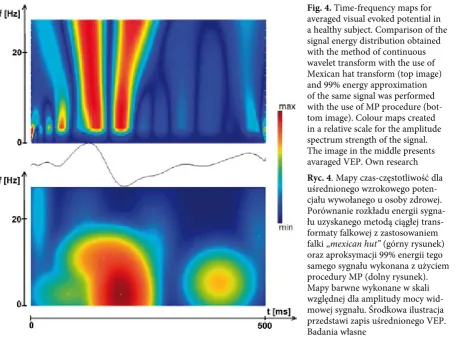
Although the above-mentioned methods of time-frequency signal analysis have been described in relation to studies with the use of non-averaged signal, they may also be used to present the time-frequency characteristics for many types of signals. Sample visualisation of such distribution is shown in Fig. 4, in the form of maps presenting energy density of averaged (i.e. denoised) VEP. Visible differences in the obtained time-frequency distri-butions result from qualities of the implemented mathematical methods. A very important feature of wavelet transform is its good frequency resolu-tion (with poor time resoluresolu-tion) for slowly-vari-able signals and good time resolution (with poor frequency resolution) for high-frequency com-ponents. This feature is not present in the Gabor functions used in approximation of time-varying spectral signal in MP [36].
Modern IT Tools
Advanced techniques of= signal processing require implementation of modern information technology tools. For obvious reasons, typical soft-ware used in clinical evaluation of EPs does not have such means and the implementation of com-plex algorithms “from scratch” is quite difficult. One option is to use environments of a general use to analyse signals, but reaching for specialist soft-ware seems to be a better solution. A perfect exam-ple is a free package EEglab for MATLAB environ-ment developed in many interdiscipline scientific centres under the supervision of Swartz Center for Computational Neuroscience at the University of San Diego, California [43]. Its description may be found in [39] and its sample applications in the Polish language are presented in [40].
In the Internet, one can also find tools for brain signal analysis with the use of wavelet trans-formations and MP algorithms, such as the ones used in this paper, i.e. MP-3.1 and MPview [41, 44]. The planned studies may also involve autho-rial software written in Fortran, C, C++ languages and using calculation models of Matlab.
Conclusions
Progress in techniques of digital sound process-ing that has been observed in recent years enables detailed analysis of EEG signals and evoked poten-tials. Mathematical analyses allow capturing essential cognitive and diagnostic information, which cannot be obtained via visual assessment of amplitude-time graphs. The analyses give new quality of informa-tion about brain activity, activainforma-tion spread and its phase correlations in both cerebral hemispheres during reaction to stimulus. Registration and analy-sis of single evoked responses should make it pos-sible to derive them more quickly for the registered signal. This would result in significant reduction of time of study, which is very important in subjects with whom verbal contact is very difficult or impos-sible, e.g. newborns or small children [42].
A lot of methods of EPs digital analysis that were developed have been used only in biocyber-netics studies or experimental neurophysiological studies, and so far they have not been used in clini-cal studies. It seems that mediclini-cal circles are quite sceptical with regard to complicated methods of mathematical analysis of brain signals. Another reason for this situation is that representatives of science dealing with EEG and EPs studies have limited access to signals collected from subjects
Fig. 4. Time-frequency maps for averaged visual evoked potential in a healthy subject. Comparison of the signal energy distribution obtained with the method of continuous wavelet transform with the use of Mexican hat transform (top image) and 99% energy approximation of the same signal was performed with the use of MP procedure (bot-tom image). Colour maps created in a relative scale for the amplitude spectrum strength of the signal. The image in the middle presents avaraged VEP. Own research
presenting pathological conditions, especially to digitally recorded signals.
The Department of Pathophysiology of Wroclaw Medical University is in possession of a large set of binarily registered evoked brain responses to external stimuli in the form of non-averaged records of brain potentials. Additionally, access to computer software offering many mod-ern methods of analysis of single brain responses is not a big problem nowadays. Although certain analytical algorithms are available only in expen-sive commercial systems of acquisition and brain signal analysis, many useful calculation procedures are included in free software. Some algorithms of data processing and presentation have been imple-mented in own computer software.
The present paper discusses basic issues relat-ed to variability of evokrelat-ed brain potentials. On the basis of literature review it has been concluded
that there is a need of further studies concerning correlation between the morphology of evoked response and spontaneous brain activity preced-ing stimulation and noise parameters in encepha-lographic measurements. The paper has presented a series of analytical methods that may be used to achieve this aim. They are based on the newest mathematical tools, which are perfect for descrip-tion of non-linear and non-stadescrip-tionary biomedical signals, including encephalographic signals. Also, the authors have indicated insufficient material for studies on variability of evoked brain potentials in the form of properly taken measurement data. The authors intend to use digital registered non-aver-aged EPs signals collected in the Department of Pathophysiology of Wroclaw Medical University in a period when mathematical processing was not very well established. These issues will be dis-cussed in subsequent publications.
References
[1] Hämäläinen M, Hari R, Ilmoniemi RJ, Knuutila J, Lounasmaa OV: Magnetoencephalography – theory, instru-mentation, and applications to noninvasive studies of the working human brain. Rev Modern Phys 1993, 65, 2, 413–497.
[2] Owen AM, Epstein R, Johnsrude IS: FMRI: applications to cognitive neuroscience. In: Functional MRI: an intro-duction to methods. Eds.: Jezzard P, Matthews PM, Smith SM, Oxford University Press, Oxford 2001, 311–328.
[3] Walerjan P, Kołodziejak A, Tarnecki R: Cyfrowe metody analizy EEG i potencjałów wywołanych. In: Biocybernetyka i inżynieria biomedyczna, vol. 2 Biopomiary. Ed.: Nałęcz M, Akademicka Oficyna Wydawnicza EXIT, Warszawa 2001, 443–462.
[4] Sielużycki C: Identification of the parameters of brain evoked responses for repeated stimulus paradigm, PhD thesis, OWPW, Warszawa 2003.
[5] Callaway III E: Habituation of averaged evoked potentials in man. In: Habituation. Eds.: Peeke HVS, Herz MJ, Academic Press, New York and London 1973, vol. 2, 153–147.
[6] De Munck JC, Bijma F, Gaura P, Sielużycki C, Branco MI, Heethaar RM: A maximum likelihood estimator for trial-to-trial variation in noisy MEG/EEG data sets, IEEE Transactions on Biomedical Engineering 2004, 51, 12, 2123–2128.
[7] Truccolo WA, Mingzhou D, Knuth HK, Nakamura R, Bressler SL: Trial-to-trial variability of cortical evoked responses: implications for the analysis of functional connectivity. Clin Neurophysiol 2002, 113, 206–226.
[8] Salajegheh A, Link A, Elster C, Burghoff M, Sander T, Trahms L, Peoppel D: Systematic latency variation of the auditory evoked M100: from average to single trial data, Neuroimage 2004, 23, 288–295.
[9] Ravden D, Polich J: Habituation of P300 from visulal stimuli. Int J Psychophysiol 1998, 30, 359–365.
[10] Gaura P: Statystyczna analiza sygnałów w badaniach wywołanej aktywności mózgu, PhD thesis, OWPW, Warszawa 2004.
[11] Başar E, Rahn E, Demiralp T, Schürmarnn M: Spontaneous EEG theta activity controls frontal visual evoked potential amplitudes. Electroencephalography Clin Neurophysiol 1998, 108, 101–109.
[12] Schürmarnn M, Başar-Eroglu C, Kolev V, Başar E: Relationship between EEG delta response and P300 analysed in single trial event-related potentials (ERPs). Int J Psychophysiol 1998, abstracts, 30, 14.
[13] Schürmarnn M, Başar E: Alpha oscillations shed new light on relation between EEG and single neurons. Neurosci Res 1999, 33, 79–80.
[14] Chacron MJ, Longtin A, Maler L: The effects of spontaneous activity, background noise, and the stimulus ensem-ble on information transfer in neurons. Network 2003, 14(4), 803–824.
[15] Polich J: On the relationship between EEG and P300: individual differences, aging, and ultradian rhythms. Int J Psychophysiol 1997, 26, 299–317.
[16] Polich J: EEG and ERP assessment of normal aging. Electroencephalography Clin Neurophysiol 1997, 104(3), 244–256.
[17] Sayers B, Mc A, Beayley HA, Henshall WR: The mechanism of auditory evoked EEG responses. Nature 1974, 247, 481—483.
[18] Pfurtscheller G, Lopes da Silva FH: Event-related EEG/MEG synchronization and desynchronisation: basic prin-ciples.Clin Neurophysiol 1999, 110, 1842–1857.
[19] Klimesch W: EEG alpha and theta oscillations reflect cognitive and memory performance: a review and analysis.
[20] Maciejowski A: Rejestracja i analiza wywolanych potencjalów z kory i pnia mózgu czlowieka w systemie kompute-rowym. Praca doktorska, Akademia Medyczna we Wrocławiu, Wrocław 1986.
[21] Jagielski J, Maciejowski A: Badania układu nerwowego metodą wywołanych potencjałów. in: Problemy Biocybernetyki i Inżynierii Biomedycznej, vol. 1 Biosystemy. Ed.: Nałęcz M, Wydawnictwa Komunikacji i Łączności, Warszawa 1991, 12–43.
[22] Maciejowski A, Bakalarczyk M, Jagielski J, Bednarski W: Changes in the single cortex evoked potentials during long-term stimulation, The 2nd World Congress of Neuroscience (IBRO), Budapest, August 16–21, Neuroscience 1987, 22 (supl.), 370.
[23] Maciejowski A: Topography of changes of single visual evoked potentials in time and frequency domain, The 2nd International Congress on Brain Electromagnetic Tomography, Toronto, July 29 – August 1, 1991, Abstracts, 2–8. [24] Jaškowski P, Verleger R: Amplitudes and latencies of single-trial ERPs estimated by a maximum likelihood
meth-od. IEEE Transactions on Biomedical Engineering 1999, 46, 987–993.
[25] de Munck JC, Huizenga HM, Waldorp LJ, Heethaar RM: Estimating stationary dipoles from MEG/EEG data contaminated with spatially and temporally correlated background noise. IEEE Transactions on Signal Processing 2002, 50, 7, 1565–1572.
[26] Kipiński L, Sielużycki C: Visualisation of trial-to-trial variability of brain evoked responses. Elektronika 2004, 8–9, 89–92.
[27] Kipiński L, Sielużycki C: Dynamiczny mapping EEG – autorski program komputerowy. Materiały XIII Krajowej Konferencji KOWBAN’2006, Polanica Zdrój, 25–27.10.2006.
[28] Blinowska KJ, Kamiński M, Durka PJ: Metody analizy sygnałów niestacjonarnych, w: Biocybernetyka i inżynieria biomedyczna, Ed. M. Nałęcz, Akademicka Oficyna Wydawnicza EXIT, Warszawa 2005, Vol. 1 Biosystemy, 81–106.
[29] Białasiewicz J.T.: Falki i aproksymacje. WNT, Warszawa 2000.
[30] Mallat S.G.: A wavelet tour of signal processing. Academic Press, New York, 1999.
[31] Blinowska K.J., Durka P.J.: Single evoked potential reconstruction by means of wavelet transform. Biol Cybernetics 1992, 67, 175–181
[32] Quin Quiroga R: Obtaining single stimulus evoked potentials with wavelet denoising, Physica D 2000, 145, 278–292.
[33] Quin Quiroga R, van Luijtelaar ELJM: Habituation and sensitisation in rat auditory evoked potentials: a single-trial analysis with wavelet denoising. Int J Psychophysiol 2002, 43, 141–153.
[34] Mallat SG, Zhang Z.: Matching Pursuit with time-frequency dictionaries. IEEE Transactions on Signal Processing 1993, 41, 3397–3415.
[35] Durka PJ, Ircha D., Blinowska KJ: Stochastic time-frequency dictionaries for Matching Pursuits. IEEE Transactions on Signal Processing 2001, 49, 507–510.
[36] Durka P: Matching pursuit and unification in EEG analysis, Artech House, Boston and London 2007.
[37] Żygierewicz J, Sielużycki C, Konig R, Durka P.: Event-related desynchronization and synchronization in MEG: framework for analysis and illustrative datasets related to discrimination of frequency-modulated tones. J Neurosci Meth 2008, 168, 239–247.
[38] Durka PJ, Ircha D, Neuper C, Pfurtscheller G: Time-frequency microstructure of event-related desynchroniza-tion and synchronizadesynchroniza-tion. Med Biol Eng Comput 2001, 39, 315–321.
[39] Durka PJ, Żygierewicz J, Klekowicz H, Ginter J, Blinowska K: On the statistical significance of event-relat-ed EEG desynchronization and synchronization in the time-frequency plane. IEEE Transactions on Biomevent-relat-edical Engineering 2004, 51, 1167–1175.
[40] Delrome A, Makeig S: EEGLAB: an open source toolbox for analysis of single-trial EEG dynamics including inde-pendent component analysis. J Neurosci Meth 2004, 134, 9–21
[41] Kipiński L: Zastosowania darmowego toolbox’a EEGLAB do analizy sygnałów mózgowych w środowisku MATLAB, Materiały XIII Krajowej Konferencji KOWBAN’2006, Polanica Zdrój, 25–27.10.2006, 277–280.
[42] Pilecki W: Ustalenie się dróg słuchowych u noworodka w świetle badańwywołanychpotencjałów z pnia mózgu.
Praca doktorska 1989, AM Wrocław 1989.
[43] http://eeg.pl/software.
[44] http://sccn.ucsd.edu/eeglab.
Address for correspondence:
Andrzej Maciejowski
Department of Pathophysiology Wroclaw Medical University
Marcinkowskiego 1 Conflict of interest: None declared 50-368 Wrocław
Poland Received: 13.04.2010
E-mail: [email protected] Accepted: 7.06.2010
Lech Kipiński