Correlations of Biomechanical Characteristics with Ball Speed in Penalty Corner Push-In
Measurement the Parameters of Cadmium Oxide Plasma Induced by Laser
Ahmed K.Abbas1 & Saif I. Muslim2
1, 2 College of Science, University of Wasit, Wasit, Iraq.
Received 15th September 2017, Accepted 20th October 2017
Abstract
In the present work, we studied the optical emission spectra of cadmium oxide (CdO) plasma produced by the fundamental (1064 nm) wavelength of an Nd: YAG laser at vacuum in the range 200-800 nm, The plasma parameters such as electron temperature and electron number density have been extracted using Boltzmann plot method and Stark broadened line profile, respectively. The lines at 347.354 nm, 361.757 nm, 468.467 nm, 480.469, 509.274 nm and 644.79 nm are taken for the temperature calculations and also election of OI line 777.5388 nm to Calculate electron density. The change in electron temperature and the number of densities was studied as a function of the laser energies. In addition, the plasma frequency, the length of Debye and the Debye number were calculated as a function of the laser energies.
Keywords: Optical Emission Spectra, Plasma, Laser, Parameters.
© Copy Right, IJRRAS, 2017. All Rights Reserved.
Introduction
In especially laser plasmas have extreme properties not found in more conventional plasmas (e.g., densities characteristic of solids). Fusion energy known as inertial confinement fusion is a major application of laser plasma physics, in this approach, high energy laser beams were focused towards to a small solid target to explode its until the densities and temperatures characteristic reaches to nuclear fusion. Another field of using laser plasma physics was in the particle accelerators, where a extremely strong electric fields was generated when a high intensity laser pulse passes through plasma to accelerate particles. High-energy physicists hope to reduce the size and cost of particle accelerators by using plasma acceleration techniques [1]. Laser-induced plasmas (LIPs) have acquired great advantage in recent years as spectroscopic sources. The optical emission spectroscopy (OES) of LIPs, which has been called induced plasma spectroscopy or laser-induced breakdown spectroscopy (LIBS) has become a powerful tool for the basic studies of the interaction of laser beams with materials.. LIPs and laser ablation have found applications in fields such as analytical spectroscopy, pulsed laser deposition of thin films or inertial confined fusion [2].
In this method (LIPs) a highly intense laser pulse interacts with a target material leading to the formation of plasma in 1064 nm due to high intensity plume propagate. The initial part of the plasma is re-heated by the inverse bremsstrah lung (IB) absorption
Correspondence Saif I. Muslim
E-mail: [email protected], Ph. +9194445 13257
[3,4]. The nature of the laser-induced plasma from a solid target material depends on wavelength, intensity, pulse duration as well as the chemical composition target material and atmospheric conditions such as pressure, space and time [5,6]. The elemental analysis of the sample based on the optical emission spectra from an laser-induced plasma (LIP) is known as laser-induced plasma spectroscopy (LIPS), also called as laser-induced breakdown spectroscopy (LIBS). [7,8].
For this purpose LIP should be optically thin and under local thermodynamic equilibrium (LTE) condition, the excitation temperature governing the distribution of energy level excitation through the Boltzmann equation and the ionization temperature governing the ionization equilibrium through the Saha equation should be equal to the electronic temperature describing the Maxwellian distribution of electron velocities. Thus, one describes the plasma in LTE by a common temperature (T), called the plasma temperature [9]. Optical emission spectroscopy has recently attracted a lot of attention for characterization based on LIP. The most widely used spectroscopic method for the determination of T is the Boltzmann plot method which employs the ratio of integrated line intensities for two or more atomic lines. Among several diagnostic methods for measuring the plasma electron density, the plasma spectroscopy based on either Stark broadening of spectral lines or the Saha-Boltzmann equation[10]. The elemental analysis and plasma parameters such as electron number density and electron temperature can be determined from the emission spectrum of the plume[9] .
Experimental
A Q-switched Nd:YAG pulsed laser was used for laser beam source, having pulse duration of 10 ns and 6
International
Ahmed et al. 2017 ISSN: 2349 – 4891
Hz energies 400mJ…900 mJ at 1064nm. The laser pulse energy was varied using flash lamp Q-switch delay through laser controller and measured by energy meter. The laser beam was focused on the target makes an angle of 45° with it the laser beam evaporates and ionizes the target material, creating a plasma plume above the target surface. Optical emission spectroscopy (OES) technique for the determination of electron temperatures, densities and mathematically we can determined plasma frequency, the length of Debye and Debye number in vacuum. To investigate the ionic species present in the plasma in detail OES of plasma plume generated by laser of CdO target was recorded using spectrometer (Surwit technology V1200-UVNIR). The OES were recorded through the side window of the chamber and then by using Boltzmann plot and Stark- broadening to calculate
the electron temperature and density of the plasma.
Results and Discussion
The plasma formed during high power laser irradiation contains atoms and ions in different excited states, free electrons and radiation. The analysis of this plasma can be done through the measurement of plasma temperature (Te) and free electron density (ne). The plasma temperature describes the plasma state and the free electron density determines the thermodynamic equilibrium state of the plasma. The knowledge of the plasma temperature and density of the plasma species is important for understanding the atomic ionization and excitation processes occurring inside the plasma. The emitted spectrum is shown in figure (I).
Figure I
Recorded emission spectra from plasma at λ= 1064 nm
Light emitted from plasma generate by 1064 nm pulse laser with different powers are detected, then the resulting spectrum distribution is plotted as intensity against wave length. Fig (I) shows in the spectral range 250- 800 nm and a comparison with strong standard lines for Cd I, and Cd II. In addition it is clear that the laser peak power has a strong and important effect on the emission lines intensities, where the intensities of the spectral lines increase with increasing in the laser peak energy because of the increasing the mass ablation rate, which leads to increasing the number of excited atoms and hence the peaks of spectral lines intensities. The electron temperature measurement can be done by either
of the following methods, namely; the relative intensity of two or more lines emitted from the same kind of species and same ionization stage or more general Boltzmann plots. Determination of the electron temperature Te, using optical emission spectroscopy technique, By using Boltzmann plot method. from fig (I) Cd I (347.354 nm, 361.757 nm, 468.467 nm,
480.469,509.274 nm and 644.79 nm) were
chosen(originated from the same atomic species and the same ionization stage) to calculate Te when laser
Ln(𝐼𝑗 𝑖𝜆𝑗𝑖
𝐴𝑗𝑖𝑔𝑗
)=-𝐸𝑗
𝑘𝐵𝑇+ 𝑐………(1)
Where I, λ, A,𝐸𝑗, 𝑔𝑗= 2𝐽𝐾+1are the spectral intensity,
wavelength, transition probability, upper level energy and statistical weight of the upper state respectively.
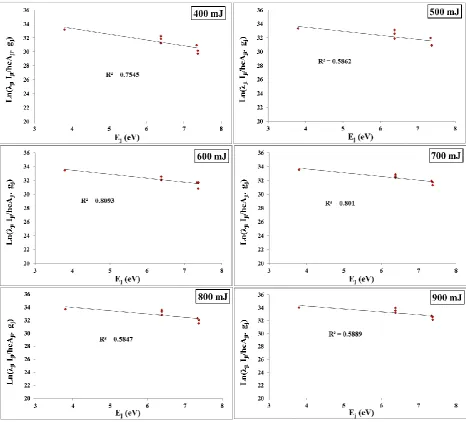
Figure II
Boltzmann plot for induced plasma using 1064 nm laser with different laser energies
In LTE all temperatures are assumed to be equal, i.e. Te≈ Ti≈ Tplasma. The spectral line wavelength,
transition probabilities, statistical weight and energies of the upper levels are obtained from National Institute of Standard and Technology (NIST)[11]. The lines at 347.354nm, 361.757 nm, 468.467 nm, 480.469, 509.274 nm and 644.79 nm are taken for the temperature calculations. In fig (II) where the electron temperature is equal to the invert of slope of fitting line. The fitting equations and the R2 are shown in the figure for all fitting lines. R2 is a statistical coefficient indicating the goodness of the linear fit which takes a value between (0, 1). The better one have R2 value closer to 1. The better one have R2 value closer to 1. Table (1) shows the results
of electron temperature with different laser energies. The electron density is determined by measuring the broadening of a suitable emission line of the laser-plasma spectrum. Fig III shows the Gaussian curve fitting of O I line 777.5388 nm and the variation of the FWHM broadening with the laser energy. The Stark broadening of a well isolated spectral line and the FWHM of that line the electron density (in cm-3) could be determined from the formula,
Ne=(
𝛥𝜆
2ω)×10
16 ……….(2)
Ahmed et al. 2017 ISSN: 2349 – 4891
Figure III
The Gaussian curve fitting of Cd line 777.5388 nm and the variation of its broadening with the laser energies
As the laser energy increases, the observed increase in Ne and Te is due to the absorption and/or reflection of the laser photon by the plasma, which depends upon the plasma frequency [12].
Now it is easy to calculate the length of Debye after calculating the temperature of the electrons and the electron density through the following equation:
λD=(
Ɛ𝑜 𝐾𝐵𝑇𝑒
𝑛𝑒𝑒2 )………(3)
Where KB is Boltzmann constant is equal to
1.38 * 10-34, e is the charge of an electron, it is equal to 1.6 *10-19 C, Te is the electron temperature, ne is the
electron density and Ɛo is the vacuum permittivity (8.85 x
10 -12 F/m); the equation above can be simplified to:
λD= 743 𝑇𝑒
𝑛𝑒 ………….(4)
Plasma frequency is also calculated from the expression below:
Fp = 𝑒2𝑛2
Ɛ𝑜𝑚𝑒………(5)
when e is the charge of an electron , and Ɛo is
the permittivity (8.85 x 10 -12 F/m), also me is mass of an
electron (9.1*10-31).
The Debye number was also calculated from the relationship below:
ND= 4𝜋
3 𝜆𝐷 3𝑛
𝑒………(6)
Where : ne: Electron density, λD: Debye length.
Table 1
Illustrates the Results of plasma parameters with laser energies
Laser energy Te (eV) ne*10 17
(cm-3) fp (Hz) *10
12 λ
D *10 -5
(cm) Nd
400 1.208 4.16 5.791 1.266 3538
500 1.683 4.23
5.839 1.477 5700
600 1.736 4.32 5.901 1.484 5909
700 1.860 4.48
6.009 1.508 6437
800 1.994 4.66 6.130 1.531 7001
900 2.265 4.73
6.174 1.620 8418
Table 1 display the calculated electron density (ne), electron temperature (Te), plasma frequency (fp),
Debye length (λD) and Debye number (ND) for CdO
target at different laser pulse energies. All calculated plasma parameters (λD, fp and ND) were satisfied the
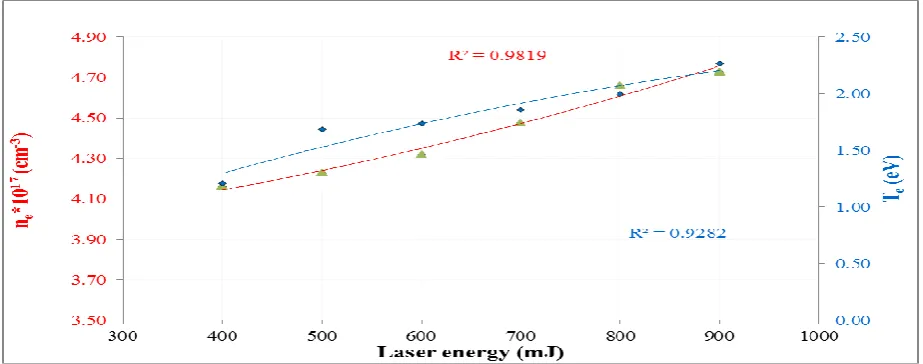
criteria for the plasma. It shows that Te, ne increase with
laser energy such as in Ref [12] other plasma parameters have the same behavior because its proportional with Te,
ne the fig below shows the behavior of plasma
temperature and electron density versus the laser energy.
Figure IV
Variation of the plasma temperature and electron density with laser energies
Ahmed et al. 2017 ISSN: 2349 – 4891
Figure V
Variation of the Debye length and plasma frequency with laser energies
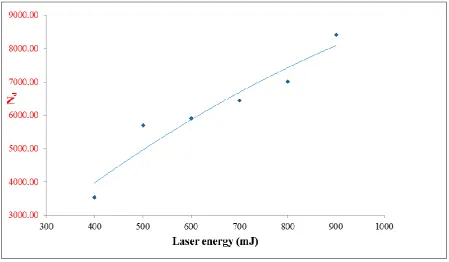
The diagram below also shows a change in the number of Debye with changing laser energies.
Figure VI
Variation of the Debye number with laser energies
Conclusion
It is found that the intensities at different laser peak powers increase with increasing laser peak power. The results reveal the relationship of electron number density and electron temperature is directly related to
References
1. A. Keloth, “Laser Induced Breakdown
Spectroscopy (Libs) And Time-Resolved Studies of Copper Plasma Excited by Nanosecond and Femtosecond Laser Pulses” , Cochin University of Science and Technolog, M.Sc. thesis,(2012) 2. A.W. Miziolek, V. Pallesschi and I. “Schecchter
Laser-Induced Breakdown Spectroscopy”, Cambridge University Press, Cambridge (2006). 3. C. Aragón J.A. Aguilera”Characterization of laser
induced plasmas by optical emission
spectroscopy”(2008)
4. D.A. Cremers and L.J. Radziemski, “Laser-Induced Breakdown Spectroscopy”, John Wiley & Sons Ltd., West Sussex (2006).
5. E.D. Ali, H.A. Vural, B. Ortaç and T. Uyar, Mater. Lett., 65, 2941 (2011).
6. H.R. Griem, “Principles of Plasma Spectroscopy”, Cambridge Uni. Press, Cambridge (1997).
7. J Jovović “Spectroscopic study of plasma during electrolytic oxidation of magnesium-aluminium alloy” University of Belgrade, Faculty of Physics, Students kitrg 12-16, 11001 Belgrade, Serbia(2014).
8. M. HANIF, M. SALIK, M. A. BAIG“Spectroscopic
Studies of the Laser Produced Lead Plasma“Plasma Science and Technology, Vol.13, No.2, Apr. 2011. 9. M.A. Naeem ,M. Iqbal,N. Amin,M. Musadiq,Y.
Jamil and F. Cecil ”Measurement of Electron Density and Temperature of Laser-Induced Copper Plasma” Department of Physics, University of Agriculture(2013).
10. National Institute of Standards and Technology (NIST) Atomic Spectra Database, (version 5). Available at http://physics.nist.gov/asd3, last updated: September 16, (2014).
11. P. Stavropoulos, C. Palagas, G.N. Angelopoulos, D.N. Papamantellosand S. Couris, Spectrochim. Acta B, 59, 1885 (2004).