ISSN 2466-4294 (online) | rad-journal.org Vol. 3 | Issue 2 | pp. 133–137, 2018 doi: 10.21175/RadJ.2018.02.022 Original research paper
PARAMETRIC STOCHASTIC MODEL OF BONE STRUCTURES TO BE USED IN
COMPUTATIONAL DOSIMETRIC PHANTOMS OF HUMAN SKELETON
*E.A. Shishkina
1,2**, V.I. Zalyapin
3, Yu.S. Timofeev
1, M.O. Degteva
1, M. Smith
4, B. Napier
41Urals Research Center for Radiation Medicine, Chelyabinsk, Russia 2Chelyabinsk State University, Chelyabinsk, Russia
3Southern Urals State University, Chelyabinsk, Russia 4Pacific Northwest National Laboratory, Richland, Washington, USA
Abstract. The estimation of dose factors for active marrow exposed to bone-seeking beta-emitters, such as 89Sr and 90Sr/90Y (0 – 1.5 MeV and 0 – 2.4 MeV, respectively), is an important task of bone dosimetry. Monte Carlo simulations of electron – photon transport to calculate the active marrow doses are based on the geometrical modeling of bone structures. The model geometry should consist of accurate descriptions of spongiosa fine structure and cortical bone thickness (because of the high probability of low energy electron emission) as well as descriptions of bone macro-dimensions (because the maximum electron path length in spongiosa is about 5-9 mm). New computer tomography (CT) -based methods are widely applied to develop computational dosimetric phantoms. The advantage of the CT-based method is in high realism of the description of complex bone shape as well as in the possibility of an adequate description of bone microstructure with µCT. However, the method has a number of disadvantages, viz.: (1) the method is laborious and expensive; (2) the use of cadavers is associated with organizational difficulties; (3) one cadaver –based model can be non-representative and does not allow estimation of the uncertainties associated with individual variability of human anatomy; (4) cortical bone thickness is fixed based on the CT, for which resolution is worse than the measurand; (5) in practice, the limitation in voxel resolution of the computational phantom often results in narrowing down the strong points given by µCT because of an inadequate representation of the microstructure. Moreover, high individual variability of bone shapes and macro-dimensions negates the advantages of the above-mentioned high realism. The aim of the presented study is to elaborate the algorithm of parametric bone modeling, which allows for the generation of phantoms of hematopoietic bone segments based on known micro- and macro dimensions. We propose an approach that permits easy subdivision of bones into small segments, which may be described by simple-shape geometric figures with appropriate voxel resolution. Spongiosa structure (presented by a stochastic rod-like model and calibrated by literature-derived bone volume-to-total volume ratio) is covered by a homogenous cortical layer. All parameters of the proposed cadaver-free model can be obtained from the literature on morphometry and hystomorphometry. Moreover, the parametric modeling allows the simulation of individual variability of bone-specific dimensions.
Key words:Bone marrow dosimetry, strontium isotopes, computational phantoms
*This paper was presented at the Sixth International Conference on Radiation and Applications in Various Fields of Research (RAD 2018), Ohrid, Macedonia, 2018.
1.INTRODUCTION
The study was motivated by the improvement of internal dosimetry in the frame of epidemiological studies being conducted for populations exposed to radiation in the Southern Urals [1]. The Mayak Production Association, which began the operation in 1948, was the first facility within the former Soviet Union for plutonium production. The environmental radioactive contamination in the Urals was the result of faulty technologies at the beginning of Mayak operation, viz.:
- the discharges of about 115 PBq of liquid wastes into the Techa River (1949–1956) [2];
- an explosion in the radioactive waste-storage facility in 1957 (the so-called Kyshtym Accident) that formed the East Urals Radioactive Trace (EURT) due to dispersion of 74 PBq into the atmosphere [3];
- windblown dust in 1967 (about 0.22 PBq) from Lake Karachay to which effluents had been discharged [4].
A significant radionuclide fraction of these releases consisted of long-lived (T1/2=28.79 years) bone-seeking 90Sr. It is the main source of chronic bone marrow
exposure of victims. Short-lived bone seeking 89Sr
(T1/2= 50.57 days) also contributed to absorbed dose in
134
MeV, respectively), is an important task of bone dosimetry to improve the radiation risk estimates.
The current strategy of risk analysis considers the transition from analytical (deterministic) approaches to stochastic (probabilistic) modeling of dose-response. Such an approach needs probabilistic dose estimates and involves Monte Carlo simulations to provide insight regarding the degree of certainty of the risk estimates, as well as how the risk varies among members of an exposed population depending on dose rate, age, sex etc. [6]. In other words, the stochastic Monte Carlo implementation of the TRDS (TRDS-2016MC) provides both dose estimates and associated uncertainty information, in contrast to the traditional deterministic approach where only point estimates are given. Bone marrow dosimetry is based on the biokinetic modeling of radionuclide intake and turnover as well as on the dosimetric modeling providing conversion factors (DFs) from radionuclide concentration in bone tissues to dose in bone marrow depending on age and sex.
The current study is focused on the dosimetric modeling to elaborate the method of estimation of population-average DFs as well as their respective uncertainties.
The evaluation of energy deposition in the bone marrow targets per an emitted particle from bone-seeking radionuclides is performed through radiation transport simulation using computational phantoms created based on the geometrical modeling of bone structures. Ideally, the model of bone geometry should consist of accurate descriptions of spongiosa fine structure and cortical bone thickness (because of the high probability of low energy electron emission) as well as descriptions of bone macro-dimensions (because the maximum electron path length in spongiosa is about 5-9 mm). The evolution of computational phantoms was from simplest chord-based infinite spongiosa [7] to paired-image chord-based voxel description (combination of CT and µCT images) [8] of hematopoietic sites of the human skeleton.
The advantage of the paired-image based method is in high realism of the description of complex bone shape as well as in the possibility of an adequate description of bone microstructure. However, the method has a number of disadvantages, viz.:
- the method is laborious and expensive;
- the use of cadavers is associated with organizational difficulties;
- cortical bone thickness is fixed based on the CT, for which the resolution is insufficient;
- in practice, the limitation in voxel resolution of the computational phantom often results in narrowing down the strong points given by µCT;
- one cadaver-based model can be non-representative and does not allow estimation of the uncertainties associated with individual variability of human anatomy.
Moreover, high individual variability of bone shapes and macro-dimensions negates the advantages of the above-mentioned high realism of the models.
Therefore, the aim of this study was to elaborate on the cadaver-free algorithm for parametric bone modeling, which allows for generating the phantoms of hematopoietic bone segments to calculate both unbiased population-average DFs and corresponding uncertainties.
We were supposed to create the generator of bone segment geometry based on literature-derived micro- and macro dimensions.
2.TERMS AND DEFINITIONS
Basic parameters of bone microstructure model were fixed as follows:
- Tb.Th – trabecular thickness (µm); - Tb.Sp – trabecular separation (µm);
- BV/TV – bone volume fraction of spongiosa (%) - Ct.Th – cortical thickness (µm)
All the terms are in agreement with histomorphometry nomenclature [9].
3.MODEL DESCRIPTION
3.1. Basic approaches
We proceed from the following assumptions: - two separate sources are cortical bone and
trabecular bone; the target is bone marrow; - subdivision of bones into small segments,
which could be described by simple-shape geometry (stylized phantoms);
- the cortical layer is a homogeneous and isotropic substance located between two surfaces, one of which is the outer boundary of the stylized phantom, and the other is separated from it inside the phantom by a distance equal to the Ct.Th;
- the trabecular bone can be described by an isotropic rod-like model based on a three-dimensional deformable-grid with stochastically perturbed nodes and randomly varied edge thickness;
- the model parameters and their variability can be derived from publications on morphometry and hystomorphometry widely presented in the biomedical literature;
- the data on intra-specimen variability of Tb.Th and Tb.Sp can be used for simulation of bone microarchitecture;
- the data on BV/TV and its individual variability can be used for calibration of simulated microstructure;
135
3.2. Geometries of stylized phantoms
A number of simple-shape figures can describe bone segments, such as box, elliptic cylinder, truncated elliptic cone, hemi ellipse, pyramid, elliptic-based tube. Literature-derived dimensions of real bones were associated with corresponding stylized phantoms.
3.3. Stochastic model of the trabecular bone microstructure
The microstructure of the trabecular bone is modeled in four stages: (1) creation of 3-dimentional grid; (2) randomization of the grid nodes; (3) stochastic modeling of rod-like trabeculae; and (4) calibration of the model.
The initial three steps are shown in the Figure 1.
1)
2
)
3
)
Figure 1. Three steps of stochastic model of the trabecular bone microstructure: 1) creation of the grid based on Tb.Sp; 2)
node randomization; 3) Modeling of rod-like trabeculae.
The basic grid represents the cubic lattice with increment equal to the mean bone-specific Tb.Sp. The nodes of the grid are randomized according to the assumption of a normal distribution of Tb.Sp (Norm[0;σTb.Sp]). The rod-like trabeculae along the edges of deformed grid are the space bounded by truncated cones, which are based on the cross sections of the spheres at the nodes of the lattice. The diameters of the spheres are randomly drawn according to the assumption of a lognormal distribution of Tb.Th (LogNorm[µTb.Th; σTb.Th]). Actually, the assumptions of
normality of Tb.Sp and lognormality of Tb.Th are not contradicted by literature data [10]-[11].
It should be noted, Tb.Sp is a highly uncertain parameter, which is very sensitive to the measurement method. In other words, the model obtained with 3 above mentioned steps can be considered as a first approximation only. An important stage is fitting the BV/TV of the generated model to a literature-derived value. This is the 4th step called the model calibration.
For this purpose, a special multi-step procedure for calibrating of Tb.Sp has been developed. The mathematical description of this model was published [12].
3.4. Model voxelization and cortical layer description
Unlike the analytically modeled trabecular structures and bone segment shape, the homogeneous cortical layer is generated in the process of voxelization (at a given resolution). The voxel belonging to a particular structure was defined according to the central point of the voxel. Each voxel contains one of four possible homogeneous fillings: (1) bone marrow; (2) bone substance of trabeculae; (3) bone substance of the cortical layer; (4) empty space. Figure 2 presents the 2D image of a cross-section of generated and voxelized model of a rib segment.
Figure 2. Visualization of the cross-section of a rib segment
3.5. Simulation of individual variability
The simulation of individual variability is realized by perturbing the input parameters of the model. The drawing of micro- and macro-parameters is carried out with lognormal and normal approaches, respectively, within the 90%CI. Each of the resulting models is subjected to verification; viz., the calculated BV/TV ratio must fall into the range of possible values.
4.APPLICATION OF NEW METHOD FOR SIMULATION OF ADULT MALE EXPOSURE
Segment-specific DFs were calculated using the MCNP6.2 code based on the generated geometric models. Next, DFs related to the same bone were averaged with weights equal to the normalized inverse of bone marrow volumes (see Equation 1)
(1)
where i- number of a site; j – number of a segment (n- number of segments of ith site); and respective
dose factors calculated for population-average parameters; - weights (BMV – bone marrow volume).
136
under consideration (i=12). Weights (wi) were assigned according to Campbell et al. [13] to be equal to the site-specific fraction of active marrow.
,
(2)
There is no correlation between and (for a source in the trabecular bone rs=-0.126, p=0.683; for a source in the cortical bone rs=-0.182, p= 0.557). Therefore, the relative standard uncertainty of can be expressed by Equation (3) that describes the propagation of uncertainty.
,
(3)
where are site-specific coefficients of variation for wi (expressed in relative value units), which was taken according to Campbell et al. [13]. The values of correspond to coefficients of variation for , which were estimated in the frame of this study.
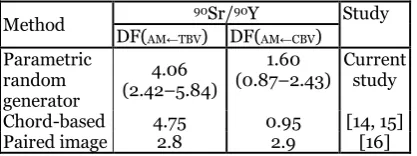
As a result, the skeletal average DFs and corresponding 90% confidence interval were estimated for Sr isotopes incorporated into the cortical bone volume (CBV) and trabecular bone volume (TBV) of an adult male. Table 1 presents the example of dose factors estimated for 90Sr/90Y in comparison with
preview estimates with chord-based and paired-image methods.
Table 1. Skeletal average dose factors *10-11, Gy/s per Bq/g
Method DF( 90Sr/90Y Study
AM←TBV) DF(AM←CBV)
Parametric random generator
4.06 (2.42–5.84)
1.60
(0.87–2.43) Current study
Chord-based 4.75 0.95 [14, 15]
Paired image 2.8 2.9 [16]
As it can be seen from the table, the calculation results (corresponding to the current study) are presented in form of population-average and 90%CI (shown in the parenthesizes). The confidence interval was estimated for the first time since the earlier performed calculations [14]-[16] were focused on radiation protection and dealt with the concept of a reference man. The previous one-cadaver based estimates mainly fall into the 90%CI. However, the population average DF(AM←TBV) can differ from point estimates by up to 30%; the population average DF(AM←CBV) can differ from point estimates by up to 80%.
5.CONCLUSION
The proposed cadaver-free method avoids the disadvantages of non-parametric individual modeling based on CT/µCT scans.
For the first time, the simulation of individual variability provides the uncertainty of dose factors.
Acknowledgement: This work was funded by the U.S. Department of Energy (International Health Studies Program Department) and the Federal Medical Biological Agency of the Russian Federation.
REFERENCES
1. L. Yu. Krestinina et al., “Leukaemia incidence in the Techa River Cohort: 1953-2007,” Brit. J. Cancer, vol. 109, no. 11, pp. 2886 – 2893, Nov. 2013.
DOI: 10.1038/bjc.2013.614 PMid: 24129230
PMCid: PMC3844904
2. M. O. Дегтева и др, “Современное представление о радиоактивном загрязнении реки Теча в 1949–1956 гг.,” Радиационная биология. Радиоэкология, т. 85, no. 5, стр. 532-534, 2016 (M. O. Degteva et al., “Contemporary understanding of radioactive contamination of the Techa River in 1949–1956,”
Radiat. Biol. Radioecol., vol. 85, no. 5, pp. 532 – 534, 2016.)
DOI: 10.7868/S0869803116050039
3. A. V. Akleev et al., “Consequences of the radiation accident at the Mayak production association in 1957 (the 'Kyshtym Accident'),” J. Radiol. Prot., vol. 37, no. 3, pp. R19 - R42, Aug. 2017.
DOI: 10.1088/1361-6498/aa7f8d PMid: 28703713
4. A. Aarkrog et al., “Radioactive inventories from the Kyshtym and Karachay accidents: estimates based on soil samples collected in the South Urals (1990-1995),”
Sci. Total Environ., vol. 201, no. 2, pp. 137 – 154, Aug. 1997.
DOI: 10.1016/S0048-9697(97)00098-3
5. M. O. Degteva et al., “Development of an improved dose reconstruction system for the Techa River population affected by the operation of the Mayak Production Association,” Radiat. Res., vol. 166, no. 1, e0174641, Aug. 2006.
DOI: 10.1667/RR3438.1 PMid: 16808612
6. Z. Zhang et al., “Correction of confidence intervals in excess relative risk models using Monte Carlo dosimetry systems with shared errors,” PLOS ONE, vol. 12, no. 4, pp. 255 – 270, Apr. 2017.
DOI: 10.1371/journal.pone.0174641 PMid: 28369141
PMCid: PMC5378348
7. J. R. Whitwell, F. W. Spiers, “Calculated beta ray dos factors for trabecular bone,” Phys. Med. Biol., vol. 21, no. 1, pp. 16 – 38, Nov. 1976.
DOI: 10.1088/0031-9155/21/1/002 PMid: 1257296
8. A. Shah et al., “A paired-image radiation transport model for skeletal dosimetry,” J. Nucl. Med., vol. 46, no. 2, pp. 344 – 353, Feb. 2005.
Retrieved from: http://jnm.snmjournals.org/content/4
6/2/344.full.pdf+html;
Retrieved on: May 20, 2018
9. D. W Dempster et al., “Standardized nomenclature, symbols, and units for bone histomorphometry: a 2012 update of the report of the ASBMR Histomorphometry Nomenclature Committee,” J. Bone Miner. Res., vol. 28, no. 1, pp. 2 – 17, Jan. 2013.
137
10. D. M. Connor et al., “Comparison ofdiffraction-enhanced computed tomography and monochromatic synchrotron radiation computed tomography of human trabecular bone,” Phys. Med. Biol., vol. 54, no. 20, pp. 6123 – 6133, Oct. 2009.
DOI: 10.1088/0031-9155/54/20/006 PMid: 19779219
11. A. M. H. Da Silva et al., “Two and three-dimensional morphometric analysis of trabecular bone using X-ray microtomography (µCT),” Rev. Bras. Eng. Biomed., vol. 30, no. 2, pp. 93 – 101, Jun. 2014.
DOI: 10.1590/rbeb.2014.011
12. V. I. Zalyapin et al., “A parametric stochastic model of bone geometry,” Bulletin SUSU MMCS, vol. 11, no. 2, pp. 44 – 57, Jun. 2018.
DOI: 10.14529/mmp180204
13. B. A. Campbell et al., “Distribution Atlas of Proliferating Bone Marrow in Non-Small Cell Lung Cancer Patients Measured by FLT-PET/CT Imaging. With Potential Applicability in Radiation Therapy Planning,” Int. J. Radiat. Oncol. Biol. Phys., vol. 92, no. 5, pp. 1035 – 1043, Aug. 2015.
DOI: 10.1016/j.ijrobp.2015.04.027 PMid: 26194679
14. F. W. Spiers et al., “Mean skeletal dose factors for beta-particle emitters in human bone: Part I: Volume-seeking radionuclides,” Brit. J. Radiol., vol. 51, no. 608, pp. 622 – 627, Aug. 1978.
DOI: 10.1259/0007-1285-51-608-622 PMid: 678757
15. J. Le Grand et al., “Calculated dose factors for the radiosensitive tissues in bone,” in Proc. Second Int. Conf. on Strontium Metabolism National Technical Information Service, Washington, USA, 1972,p. 49.
16. W. Hough et al., “An image-based skeletal dosimetry model for the ICRP reference adult male – internal electron source”, Phys. Med. Biol., vol. 56, no. 8, pp. 2309 – 2346, Apr. 2013.
DOI: 10.1088/0031-9155/56/8/001 PMid: 21427487