Claroline, an Internet Teaching and Learning Platform
to Foster Teachers’ Professional Development and
Improve Teaching Quality : First Approaches
Marcel lebrun, Françoise Docq anD Denis sMiDts
Université Catholique de Louvain, Belgium
their learning. after a presentation of the pedagogic principles underlying the development of the claroline platform, this ar-ticle describes the most interesting findings of this study and presents some differences between teachers’ and students’ perceptions.
this article discusses the use of an elearning hybrid configuration in a belgian Higher education institution (the université catholique de lou-vain (ucl) in loulou-vain-la-neuve). this institution is developing and using a technological platform, claroline, to sustain and foster pedagogic innova-tions. since 2000, the managers of the university have been trying to en-courage the development of pedagogic styles closer to the needs of society in terms of student competences, recent advances in techno-pedagogy, and innovation studies (learner-centred activities, professional development for teachers, etc.). this article describes some quantitative tools which may be useful in monitoring the development of such a pedagogy within an institu-tion. briefly we will focus on two main ideas:
the relationship between the types of tools used and their develop-•
ment as an indicator of the development of value-added pedagogy; the relationship between the technological richness of a pedagogy •
and teachers’ and students’ perceptions of the learning quality.
Fostering Pedagogic Innovations?
to build a technological tool devoted to student learning, which will give teachers opportunities to develop pedagogic situations with added-val-ue learning, and to assess their impacts, it is necessary to have a pragmatic model of pedagogy. this must cover various levels: (a) teachers, (b) facul-ties, and (c) the institution. it is difficult to assess the impact of a techno-logical tool (or, indeed, pedagogical innovations in general) without a model against which to measure the impact of the innovations on pedagogy and the pedagogical involvement of teachers. lebrun (2007) proposed such a mod-el, particularly adapted for information communication technology (ict) uses, which consists of three different and coherent inputs:
society’s needs (as expressed by universities, businesses and politi-•
this is mainly a question of objectives.
the findings of educational research about learning factors such as •
motivation and interaction which promote quality learning. this is mainly a question of methods.
the results of studies of the added value of educational technology •
tools in mainstream education. this is mainly a question of the de-velopment of tools.
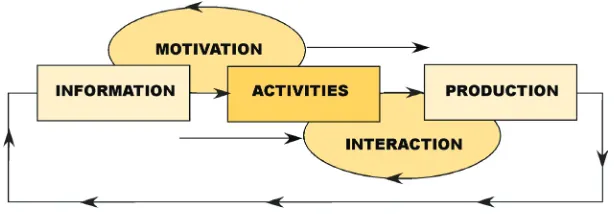
the model may be described as follows: if it is useful that informa-tion (very often the only result of ict) is made available (saljo, 1979), it is equally important that learning takes place in a genuine, motivational context (biggs & telfer, 1987). High level cognitive activities (abstraction, analysis, synthesis, evaluation, and critical thinking) can then be activated. these activities are sustained by the interactivity of the pedagogic setup (savoie & Hughes, 1994) and lead to the contents and methods being ab-sorbed by the learner, who constructs knowledge, who constructs itself (lebrun & Viganò, 1995a; 1995b).
Figure 1 shows the synthetic results of this analysis presented as a dy-namic picture. this Figure may also act as a check-list for the design and evaluation of educational resources (their nature, structure and attributes, and the lay-out of the information), pedagogic software (the context of the proposed activities or directives to be followed), educational web sites (the activities suggested to the students or the place of the web site in the peda-gogic scenario), pedapeda-gogic plans (carefully considered individual and col-laborative activities), students’ output and, finally, the development and eval-uation of pedagogic innovation inside an institution (lebrun, 2002; 2005; 2007).
the three rectangles in the centre, are inspired by the constructivist ap-proach: information is transformed into knowledge by the students’ activi-ties and this new knowledge feeds into the next set of information gather-ing (a systemic loop). this process is enabled by motivational factors and sustained by interactions with the environment (functional interactions) and with other students and teachers (relational interactions).
An eLearning Platform to Sustain Pedagogy Within Institutions?
in the academic year 2001-2002, a decision was made by the Université Catholique de Louvain to develop an elearning tool with basic functional-ities. the interface was to be kept as simple as possible so that the teachers could focus their attention where it mattered most: on students’ learning.
since the beginning of the project, the platform has been developed ac-cording to the main components of the pedagogic model: (a) tools covering information and motivation such as “Documents and links” and “agenda”; (b) tools on interactions between students and teachers such as “announce-ments,” “Groups” and “Forums”; and (c) finally, tools allowing and sustain-ing students’ activities and production such as “exercises,” “Works” and “Wiki.”
claroline’s development team (initially located in louvain-la-neuve and rapidly supplemented by a team at ecaM, a higher education insti-tution located in brussels) has continued to work on emphasising student learning, the autonomy of teachers, and avoiding “technological acne” (the development, which is a feature of many platforms, of more and more but-tons and functionalities, which allow complicated things to be done but make simple things complicated). our general hypothesis is that such a plat-form should release teachers from technical difficulties and give them time to enable student learning and their own pedagogical development (Docq, lebrun, & smidts, 2007).
pedagogy.
to test this hypothesis, we undertook two studies:
longitudinal observation of the use of the platform tools by teach-•
ers. We have already suggested that the development of this intui-tive platform will encourage teachers to adopt different pedagogical methods. the alternative hypothesis is that teachers will reproduce their traditional ways of teaching by just putting documents or re-sources onto the platform.
students’ perception of their own learning. We often hear that “the •
tool is only a tool” and that the most important thing is the peda-gogical environment developed by the teacher “around” the tool. this appears to be true; however a technologically rich environ-ment may be a sign of a pedagogically rich environenviron-ment especially if the tool was developed to induce pedagogical transformations. Do students’ perceptions of their own learning depend on the rich-ness of the technological environment created by their teachers? For us, this is an important factor in the perceived quality of the learning. the alternative hypotheses is that students’ perceptions of learning are independent of the tools on the platform.
Hypothesis 1: The usage of tools by students and teachers and the development of this usage is a sign of pedagogical innovation
in our institution, the main teaching method is still lecturing. Pedagogi-cal innovation involves encouraging the teacher to adopt more interactive and active methods, that is, a more student-centred pedagogy. by observing the tools activated and used on the platform from year to year, it should be possible to detect any movement towards these more innovative pedagogical methods. technology only offers an occasion for the teacher to experiment and develop different methods, it cannot force a change to occur.
ques-tion : “Have you already used this tool?”
0% 20% 40% 60% 80% 100%
Learning Path Wiki Chat Exercises Works Groups Forums Stats Agenda Users Course description Announcements Documents and Links
Prs Sts
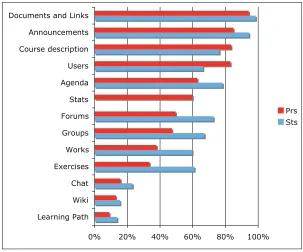
Figure 2. The use of tools by teachers (Prs; N=153) and students (Sts; N=1179)
the differences between the teachers’ and the students’ responses are significant. For “Documents and links,” the difference between teachers (94% yes) and students (98% yes) has a χ2 value of 10.8 with p= 0.001. For “Forums” and “Groups,” the p value is <.0001.
except for tools mainly dedicated to teacher use (course Description, list of users, course statistics, etc.), Figure 2 indicates a good knowledge of the tools by students, especially in the interactive (Forums, Groups) and proactive categories (Works and exercises).
are more interested in the transmission of content (information). after some years, they pay more attention to the pedagogical setup (interaction with stu-dents), and as mature professionals teachers become more concerned with student differences and activities (activity and production). these findings are compatible with recent developments such as the “scholarly teaching” proposed by shulman (1999) as a foundation for the “scholarship of teach-ing and learnteach-ing” (the way of excellence).
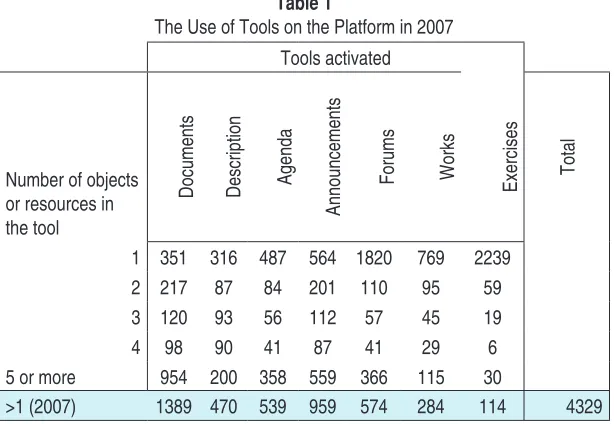
over the years, we have investigated the logons to the platform and measured the “density” of the uses of the various tools within one course. the density is measured by the number of resources in a given tool com-pared to the total number of resources: for example, the number of docu-ments and links uploaded to the “Docudocu-ments and links” tool, the number of exercises in the “exercises” tool, or the number of subjects in the “Forums” tool, compared to the overall total. table 1, below, shows the most recent results, those for 2007. these results cover all the 2446 “courses” which were identified on the platform when the data were taken1. the cells of the table give the number of courses in which each tool contains the given num-ber of objects (for instancee.g., there were 120 courses for which there were three documents in the tool “Documents and links”). When a course is first opened on the platform, the each active tool contains an example object (or resource) to help the teacher with the tool use. in theory, this resource should be destroyed by the teacher before the tool is used, but sometimes teachers forget to do this. For this reason, our main indicator (see the bottom row of the table) is the number of courses containing more than one object.
Table 1
The Use of Tools on the Platform in 2007 Tools activated
Number of objects or resources in the tool
Documents Description Agenda
Announcements
Forums Works Exercises Total
1 351 316 487 564 1820 769 2239
2 217 87 84 201 110 95 59
3 120 93 56 112 57 45 19
4 98 90 41 87 41 29 6
5 or more 954 200 358 559 366 115 30
the usage of tools generally increases with the number of courses. ta-ble 2 (which is the same as tata-ble 1, but only shows the bottom line) con-tains the results for 2004, when the total number of courses was around 1,200. this suggests that the results multiplied by around two in roughly three years.
Table 2
The Use of Tools on the Platform in 2004
>1 (2004) 909 300 246 267 160 107 23 2012
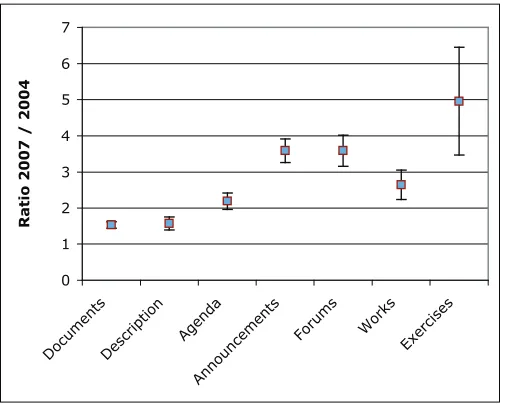
to compare these results better, and make it easier to see whether the use of tools increases or decreases, we normalised our data to 100% for each year. this gave us the mean density of the tools used during the year. We also divided the absolute numbers, tool by tool, to get the tool-use ratio “2007/2004,” which is expected to be around two. table 3 presents these results.
Table 3
A Comparison of the Use of Tools in 2004 and 2007
Documents Description Agenda
Announcements
Forums Works Exercises Mean
>1 2007 (%) 32% 11% 12% 22% 13% 7% 3%
>1 2004 (%) 45% 15% 12% 13% 8% 5% 1%
2007/2004 +/ − s.d.
1.53 +/ − 0.09
1.57 +/− 0.18
2.19 +/− 0.23
3.59 +/− 0.33
3.59 +/− 0.43
2.65 +/− 0.41
4.96 +/− 1.49 2.15
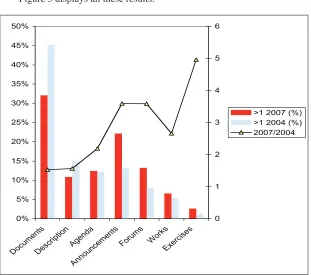
Figure 3 displays all these results.
0% 5% 10% 15% 20% 25% 30% 35% 40% 45% 50%
DocumentsDescriptionAgenda Announcements
Forums WorksExercises 0 1 2 3 4 5 6
>1 2007 (%) >1 2004 (%) 2007/2004
Figure 3. The mean density of tool use on the platform (in %, left), and its
summarizing, this Figure gives the following results for some tools : on the left scale, the mean (over courses) “density” of the uses given in percent (relative values) for the years 2004 and 2007 ; on the right scale, the ratio (2007 over 2004) of the number of resources tool by tool (ratio of absolute values). With an homogeneous augmentation related only to courses aug-mentation, this ratio should be around 2. Figure 4 shows these results (ra-tios) including the error bars for each tool.
0 1 2 3 4 5 6 7
DocumentsDescription Agenda Announcements
Forums Works Exercises
Ratio
2007 / 2004
Figure 4. The ratios of tool use in 2004 and 2007, showing the error bars for the
increase in each tool
Hypothesis 2: Students’ perceptions of pedagogy are linked to teachers’ adoption of a pedagogical enriched approach to eLearning
a question which is becoming more and more important worldwide in Higher education is that of professional development for teachers. this question is often described as a transformation of the teacher toward more learner-centred methods, or a movement from a transmissive paradigm to more interactive or proactive paradigms.
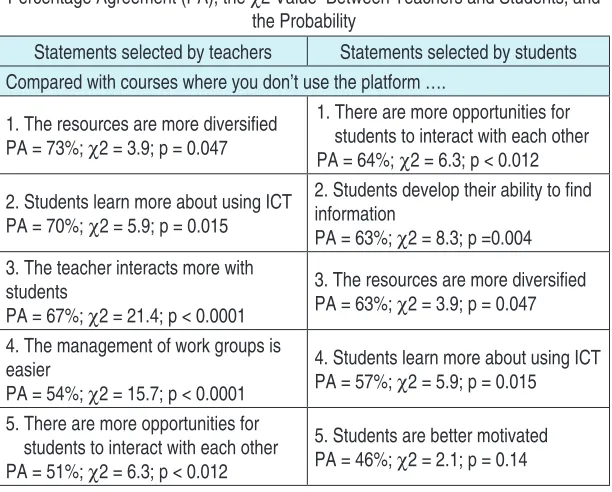
in a recent study (Docq et al., 2007), we presented students and teach-ers using the platform with a series (26) of statements about a pedagogic shift from traditional teaching to interactive or proactive teaching. the stem was: “compared with courses where you don’t use the platform,…” and the statements offered comparisons covering five categories determined by the pedagogic model some of which were: quality of resources (information), student engagement in tasks (motivation), interactions between students, in-teractions between students and teachers (interaction)….the more of these statements the participant agrees with, the more he or she perceives a change of pedagogy towards interactive or proactive activities. again the question-naires were available on the platform and only registered teachers and stu-dents could answer them. the number of responses was 153 for teachers and 1179 for students.
Table 4
The Five Statements With the Highest Levels of Agreement Together With the Percentage Agreement (PA), the χ2 Value Between Teachers and Students, and
the Probability
Statements selected by teachers Statements selected by students Compared with courses where you don’t use the platform ….
1. The resources are more diversified PA = 73%; χ2 = 3.9; p = 0.047
1. There are more opportunities for students to interact with each other PA = 64%; χ2 = 6.3; p < 0.012
2. Students learn more about using ICT PA = 70%; χ2 = 5.9; p = 0.015
2. Students develop their ability to find information
PA = 63%; χ2 = 8.3; p =0.004 3. The teacher interacts more with
students
PA = 67%; χ2 = 21.4; p < 0.0001
3. The resources are more diversified PA = 63%; χ2 = 3.9; p = 0.047
4. The management of work groups is easier
PA = 54%; χ2 = 15.7; p < 0.0001
4. Students learn more about using ICT PA = 57%; χ2 = 5.9; p = 0.015
5. There are more opportunities for students to interact with each other PA = 51%; χ2 = 6.3; p < 0.012
5. Students are better motivated PA = 46%; χ2 = 2.1; p = 0.14
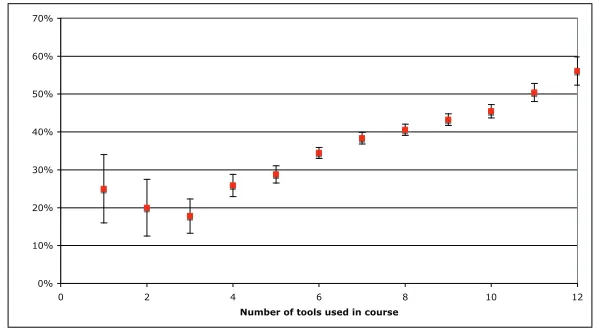
Figure 5. Comparison between the number of tools used in the course (frequency given on left) and the agreement percentage with the pedagogic shift statements (right)
the results for teachers are very similar : a great richness of the setup (number of tools) is related to greater agreement with the pedagogic state-ments. Figure 6 gives the error bars associated with the pedagogical shifts shown in Figure 5.
0% 10% 20% 30% 40% 50% 60% 70%
0 2 4 6 8 10 12
Number of tools used in course
Agreement percent
age o
ver pedago
gical shift
s
Figure 6. The comparison between the number of objects used in the course and
the percentage agreement with the pedagogic shift statements, showing the error bars for the percentages
0 50 100 150 200 250
1 2 3 4 5 6 7 8 9 10 11 12
Number of tools used in course
Frequency of the number of tools used
0% 10% 20% 30% 40% 50% 60%
Conclusions
a lot of publications have emphasised the catalytic effects of technolo-gy on pedagotechnolo-gy (promotion of active pedagotechnolo-gy, teacher development, etc.). empirical evidence of such a process is much rarer. We have tried to con-tribute to this important point by collecting relevant data, and also by using an appropriate methodology.
1. our analysis of data on the use of the platform tools over the past three years, has shown a statistically significant movement from tradition-al uses (transmissive mode) to more innovative uses based on interactions between students and teachers, and the motivation of students’ independent work. this kind of study should be undertaken elsewhere, and with different platforms. our work might prove to be a benchmark for future pedagogical platforms.
2. to measure the impact of a pedagogic tool is very difficult. as a first step in this direction we investigated teachers’ and students’ perceptions of the pedagogical shift linked to the intensity of use of the claroline platform. to do this, we measured the shift along the five axes of “our” pedagogical model. such a shift cannot be evaluated without a pedagogical model to re-fer to. the mean perceptions were lower than expected (a mean percentage agreement of 38% over the 26 propositions), but we showed that the results were strongly related to the richness of the pedagogical setup developed by the teacher. Here too it will be necessary to repeat these measurements else-where, on other platforms and over time.
teach-ers of the institution, and to investigate the sources of motivation of these innovative teachers.
using two different approaches (one more objective, based on the logs of the platform, the other more subjective, using teachers’ and students’ perceptions), we have obtained some evidence that this elearning platform contributes to the development of pedagogy. More thorough investigations need to be made to distinguish any effect of elearning from the effects of other changes introduced by the institution (such as funds for pedagogic de-velopments and valorisation of pedagogic effort by teachers).
References
biggs, J.b., & telfer, r. (1987). The process of learning (2nd ed.). sydney,
aus-tralia: Prentice-Hall
Docq, F., lebrun, M., & smidts, D. (2007). claroline, une plate-forme d’ensei-gnement/apprentissage sur internet. Pour propulser la pédagogie active et l’innovation? [claroline, a platform for teaching and learning on the inter-net: can it foster active pedagogy and innovation?]. in M. Frenay, b. rau-cent, & P. Wouters (eds.), Actes du quatrième colloque «Questions de pé-dagogies dans l’enseignement supérieur» (pp. 99-109). louvain-la-neuve, belgium: Presses universitaires de louvain.
Katz, l. (1972). Developmental stages of preschool teachers. Elementary School Journal, 73, 50-55.
lebrun, M., & Viganò, r. (1995a). De l’“educational technology” à la technolo-gie pour l’éducation [From educational technology to technology for educa-tion]. Les cahiers de la recherche en éducation, 2, 267-294.
lebrun, M., & Viganò, r. (1995b). Des multimédias pour l’éducation: de l’inte-ractivité fonctionnelle à l’intel’inte-ractivité relationnelle [Multimedia for educa-tion: From functional interactivity to relational interactivity]. Les cahiers de la recherche en éducation, 2, 457–482.
lebrun, M. (2002). Théories et méthodes pédagogiques pour enseigner et ap-prendre: Quelle place pour les TIC dans l’éducation? [theories and meth-ods for teaching and learning: What is the role of ict in education?].brux-elles-Paris: De boeck.
lebrun, M. (2005). eLearning pour enseigner et apprendre: Allier pédagogie et technologie [elearning for teaching and learning: Pedagogy and technology working together].louvain-la-neuve, belgium: academia-bruylant. lebrun, M. (2007). quality towards an expected harmony: Pedagogy and
Morgan, G. (2003). Faculty use of course management systems. research study from the eDucause center for applied research. retrieved 15 april, 2008, from http://connect.educause.edu/library/ecar/ FacultyuseofcourseManagem/39089
saljo, r. (1979). Learning in the learner’s perspective IV: Considering one’s own strategy (rep. no. 79). Mölndal, sweden: university of Gothenburg, institute of education.
savoie, J.M., & Hughes, a.s. (1994). Problem-based learning as classroom solu-tion. Educational Leadership, 52(3), 54-57.