
Effects of Tillage System and Nitrogen
Supply on Sugarbeet Production
David D. Tarkalson
1, Dave L. Bjorneberg
1,
and Amber Moore
21USDA-ARS Northwest Soils and Irrigation Research Laboratory, Kimberly, ID; 2University of Idaho Twin Falls Research and
Extension Center, Twin Falls ID Corresponding Author: David D. Tarkalson
DOI: 10.5274/JSBR.49.3.79
ABSTRACT
The sugarbeet industry in the Pacific Northwest is in-terested in strip tillage (ST) primarily due to the poten-tial savings in tillage costs. This study was conducted to evaluate the use of ST in the Pacific Northwest com-pared to conventional tillage (CT) practices and to evaluate N requirements of sugarbeet under ST and CT. The effect of tillage method (ST, moldboard plow [MP] system, and chisel plow [CP] system) and N sup-ply (5 levels) on sugarbeet production factors were in-vestigated in Kimberly, ID from 2008 to 2010 on a Portneuf silt loam soil with barley as the previous crop. Root and estimated recoverable sucrose (ERS) yields were the same under all three tillage practices across N supply. There were no differences in N response across tillage systems. However, estimated tillage costs for ST were from 53% to 76% lower than other tillage systems tested. The CP treatment had a significantly lower harvest plant population compared to ST and MP, likely because residue inhibited seed-soil contact. Averaged across tillage practices, in 2008 and 2010, a significant quadratic relationship was observed be-tween N supply and root and ERS yield. During 2008 and 2010, yields at the economically optimum N supply (EONS) ranged from 73.6 to 79.9 Mg roots ha-1 and 11,054 to 11,415 kg ERS ha-1across tillage practice and N prices ranging from $0.44 to $2.20 kg-1N. During 2008 and 2010, nitrogen use efficiency (NUE) at the EONS ranged from 50.1 to 67.9 kg sucrose kg-1N supply over
Effects of Tillage System and Nitrogen
Supply on Sugarbeet Production
David D. Tarkalson
1, Dave L. Bjorneberg
1,
and Amber Moore
21USDA-ARS Northwest Soils and Irrigation Research Laboratory, Kimberly, ID; 2University of Idaho Twin Falls Research and
Extension Center, Twin Falls ID Corresponding Author: David D. Tarkalson
DOI: 10.5274/JSBR.49.3.79
ABSTRACT
Strip tillage (ST) and other conservation tillage practices are com-mon in many areas of the Corn Belt region in the central Great Plains and Midwest U.S. to conserve soil and water through residue man-agement and to reduce tillage costs in corn (Zea maysL.) and soybean [Glycine max(L.) Merr.] production systems. However, in the irri-gated production systems of the Pacific Northwest, ST is less com-mon, and research on the use of ST in sugarbeet (Beta vulgarisL.) production is limited. Overstreet (2009) listed several potential ad-vantages of ST use in sugarbeet production systems compared to full-width, CT practices: reduced soil erosion, increased soil moisture, optimum fertilizer placement, increased carbon sequestration, and reduced fuel use. In this paper, CT refers to any full-width tillage practice that results in the incorporation of crop residue from a vari-ety of tillage implements (e.g. disc, moldboard plow [MP], roller har-row, and chisel plow [CP]). Often multiple passes using different implements are used in CT. In the Pacific Northwest and other sug-arbeet production regions it is common for producers to make five or more passes over a field in preparation for planting a sugarbeet crop (Evans et al., 2010), whereas with ST, one pass is typical. Potential
all tillage practices and N prices. The N requirements at the EONS ranged from 2.4 to 3.0 kg Mg-1in 2008 and 2.5 to 2.8 kg Mg-1in 2010 over tillage practices and the range of N prices. Strip tillage can be used to obtain yields comparable to other common tillage practices and decrease tillage costs. Nitrogen requirements for all tillage practices could be reduced on heavier tex-tured soils compared to past recommendations in the Pacific Northwest. However, adjusting N requirements based on sugarbeet production and quality history, soil type, and soil residual N should be evaluated.
Additional Key Words: strip tillage, strip till, moldboard plow, chisel plow, nitrogen, nitrogen use efficiency, nitrogen re-quirement.
Abbreviations:ST = strip tillage, CT = conventional tillage, CP = chisel plow, MP = moldboard plow, ERS = estimated re-coverable sucrose, EONS = economic optimum nitrogen sup-ply, NUE = nitrogen use efficiency, UAN = urea ammonium nitrate, ET = evapotranspiration, TDM = total dry matter, RTN = net return from N fertilizer application, EONR = eco-nomic optimum nitrogen rate, SE = standard error, MRYNS = maximum root yield N supply
Strip tillage (ST) and other conservation tillage practices are com-mon in many areas of the Corn Belt region in the central Great Plains and Midwest U.S. to conserve soil and water through residue man-agement and to reduce tillage costs in corn (Zea maysL.) and soybean [Glycine max(L.) Merr.] production systems. However, in the irri-gated production systems of the Pacific Northwest, ST is less com-mon, and research on the use of ST in sugarbeet (Beta vulgarisL.) production is limited. Overstreet (2009) listed several potential ad-vantages of ST use in sugarbeet production systems compared to full-width, CT practices: reduced soil erosion, increased soil moisture, optimum fertilizer placement, increased carbon sequestration, and reduced fuel use. In this paper, CT refers to any full-width tillage practice that results in the incorporation of crop residue from a vari-ety of tillage implements (e.g. disc, moldboard plow [MP], roller har-row, and chisel plow [CP]). Often multiple passes using different implements are used in CT. In the Pacific Northwest and other sug-arbeet production regions it is common for producers to make five or more passes over a field in preparation for planting a sugarbeet crop (Evans et al., 2010), whereas with ST, one pass is typical. Potential
all tillage practices and N prices. The N requirements at the EONS ranged from 2.4 to 3.0 kg Mg-1in 2008 and 2.5 to 2.8 kg Mg-1in 2010 over tillage practices and the range of N prices. Strip tillage can be used to obtain yields comparable to other common tillage practices and decrease tillage costs. Nitrogen requirements for all tillage practices could be reduced on heavier tex-tured soils compared to past recommendations in the Pacific Northwest. However, adjusting N requirements based on sugarbeet production and quality history, soil type, and soil residual N should be evaluated.
Additional Key Words: strip tillage, strip till, moldboard plow, chisel plow, nitrogen, nitrogen use efficiency, nitrogen re-quirement.
fuel and time savings with ST compared to CT are attractive to the sugarbeet industry. With the availability of genetically modified Ge-nuity®RoundUp Ready®(Monsanto Company, St. Louis, MO) sugar-beet seed in 2008, the use of ST became attractive because weed control became more manageable in a reduced tillage system.
Current ST equipment designs typically incorporate a series of coulters and shanks to create a residue free zone where the crop can be planted and fertilizers placed below the seed (Overstreet, 2009). The tilled area is approximately 15 to 20 cm wide with the remaining area of the field left undisturbed with residue from the previous crop remaining on the soil surface (Overstreet, 2009).
No research has been published on the use of ST in sugarbeet pro-duction in the Pacific Northwest. Most research evaluating ST in sugarbeet production systems has taken place in north central U.S. and Canada. Overstreet et al. (2007 and 2008) and Regitnig (2007) found that sugarbeet root yield and quality parameters under ST were the same as under CT in rain-fed and irrigated systems, respec-tively. Research results from USDA-ARS in Sidney, Montana have indicated under ideal conditions ST and CT produced similar sugar-beet root yields, but in one year a wind storm reduced populations in the CT treatment relative to the ST treatment, which resulted in greater root yield and sugar recovery under ST (Evans et al., 2010).
Strip tillage is starting to be used in the sugarbeet industry in the Pacific Northwest U.S. Also, due to the high dairy cow populations in southern Idaho, the potential use of ST in corn production is increas-ing, making the need for research to evaluate ST use and develop ST management practices a high priority. Sugarbeet production area under ST in the Amalgamated Sugar Company production area has increased from 0 ha in 2007 to approximately 2,800 ha in 2009.
Many research studies have been conducted to evaluate N man-agement in sugarbeet production under CT systems (Adams et al., 1983; Anderson and Petersen, 1988; Carter et al., 1974 and 1976; Halvorson and Hartman, 1975 and 1980; Halvorson et al., 1978; Hills and Ulrich, 1976; Hills et al., 1978 and 1983; Lamb and Moraghan, 1993; and Stevens et al., 2007). All of these studies, excluding Stevens et al. (2007), were conducted 17 to 35 years ago. Nitrogen management recommendations can change as yields and crop pro-duction efficiencies increase over time (Dobermann et al., 2011). With the advent of new tillage systems and varieties, in particular Genu-ity®RoundUp Ready® sugarbeets, research is needed to evaluate sug-arbeet response to N supply under ST and CT practices cropped to modern varieties. Nearly all of the sugarbeets grown for the Amal-gamated Sugar Company in the Pacific Northwest are Genuity® RoundUp Ready® sugarbeets.
The objectives of this study were to compare ST to CT systems, and evaluate the N response of sugarbeet grown under ST in the Pa-cific Northwest relative to CT systems.
fuel and time savings with ST compared to CT are attractive to the sugarbeet industry. With the availability of genetically modified Ge-nuity®RoundUp Ready®(Monsanto Company, St. Louis, MO) sugar-beet seed in 2008, the use of ST became attractive because weed control became more manageable in a reduced tillage system.
Current ST equipment designs typically incorporate a series of coulters and shanks to create a residue free zone where the crop can be planted and fertilizers placed below the seed (Overstreet, 2009). The tilled area is approximately 15 to 20 cm wide with the remaining area of the field left undisturbed with residue from the previous crop remaining on the soil surface (Overstreet, 2009).
No research has been published on the use of ST in sugarbeet pro-duction in the Pacific Northwest. Most research evaluating ST in sugarbeet production systems has taken place in north central U.S. and Canada. Overstreet et al. (2007 and 2008) and Regitnig (2007) found that sugarbeet root yield and quality parameters under ST were the same as under CT in rain-fed and irrigated systems, respec-tively. Research results from USDA-ARS in Sidney, Montana have indicated under ideal conditions ST and CT produced similar sugar-beet root yields, but in one year a wind storm reduced populations in the CT treatment relative to the ST treatment, which resulted in greater root yield and sugar recovery under ST (Evans et al., 2010).
Strip tillage is starting to be used in the sugarbeet industry in the Pacific Northwest U.S. Also, due to the high dairy cow populations in southern Idaho, the potential use of ST in corn production is increas-ing, making the need for research to evaluate ST use and develop ST management practices a high priority. Sugarbeet production area under ST in the Amalgamated Sugar Company production area has increased from 0 ha in 2007 to approximately 2,800 ha in 2009.
Many research studies have been conducted to evaluate N man-agement in sugarbeet production under CT systems (Adams et al., 1983; Anderson and Petersen, 1988; Carter et al., 1974 and 1976; Halvorson and Hartman, 1975 and 1980; Halvorson et al., 1978; Hills and Ulrich, 1976; Hills et al., 1978 and 1983; Lamb and Moraghan, 1993; and Stevens et al., 2007). All of these studies, excluding Stevens et al. (2007), were conducted 17 to 35 years ago. Nitrogen management recommendations can change as yields and crop pro-duction efficiencies increase over time (Dobermann et al., 2011). With the advent of new tillage systems and varieties, in particular Genu-ity®RoundUp Ready® sugarbeets, research is needed to evaluate sug-arbeet response to N supply under ST and CT practices cropped to modern varieties. Nearly all of the sugarbeets grown for the Amal-gamated Sugar Company in the Pacific Northwest are Genuity® RoundUp Ready® sugarbeets.
MATERIALS AND METHODS
This study was conducted on three fields over a three-year period (2008 to 2010) at the USDA-ARS Northwest Irrigation & Soils Re-search Lab in Kimberly, ID on a Portneuf silt loam (coarse-silty mixed superactive, mesic Durixerollic Xeric Haplocalcids). The treatments included tillage system (strip tillage, moldboard plow system, and chisel plow system), and N fertilizer application rate. The N fertilizer rates in 2008 and 2009 were 0, 56, 112, 168, and 224 kg N ha-1and in 2010 were 0, 62, 109, 156, and 227 kg N ha-1. The tillage system de-scriptions are presented in Table 1. The treatments were arranged in a split plot design. Tillage system was the main plot and N fertil-izer application rate was the subplot. Treatment combinations were replicated either three (2008) or four (2009 and 2010) times. Each plot was 4.5 m wide (eight-0.56 m rows) and 12.2 m long.
A Strip Cat tillage implement was used for ST (Twin Diamond In-dustries, LLC, Minden, NE) in the spring. Barley was grown the year previous to the study year at each site. Tillage passes for the MP and CP systems increased in 2010 compared to 2008 and 2009 due to greater barley residue. The number of tillage passes within each tillage method treatment was based on farmer knowledge and judg-ment to obtain suitable seedbed conditions.
Prior to N fertilizer application in spring, three soil cores (4.4 cm diameter) in 0.3 m increments to a depth of 0.6 m were taken in 2008, and to a depth of 0.9 m in 2009 and 2010 in each tillage system main plot of each replication. In 2008, the site had a root restrictive hard pan layer at 0.6 m. Within each tillage system main plot samples were composited by depth increment. Soil samples were analyzed for nitrate-N (NO3-N) and ammonium-N (NH4-N) after extraction in 2M KCl (Mulvaney, 1996) using a flow injection analyzer (Lachat In-struments, Loveland, CO) (Table 2). These data were used to deter-mine the parameter Spring Soil Residual N (NO3-N and NH4-N). The 0 to 0.3 m soil samples were also tested for sodium bicarbonate extractable P and exchangeable K concentrations (Olson et al., 1954) to determine sugar beet requirements of these nutrients (Table 2). In the spring of 2008 (April 25) and 2009 (May 13), N fertilizer (urea ammonium nitrate [UAN, 32-0-0]) was broadcast applied to the soil surface in a single application prior to planting. A nitrification inhibitor (Agrotain®, Saint Louis, MO) was applied at a rate of 3.5 L metric ton-1of UAN prior to application to prevent significant NH
3 losses from the UAN as a result of microbial urease activity on the soil surface. The UAN was irrigated into the soil with 15 mm of irri-gation water within three days after application using a solid set ir-rigation system. In 2010, UAN (32-0-0) was applied between sugarbeet rows on June 10 when the sugarbeet crop reached the four leaf stage, prior to the start of significant crop N uptake (Amalga-mated Sugar Company, 2010). The UAN was immediately irrigated into the soil with 15 mm of water. Based on soil test P analysis, 83 kg
MATERIALS AND METHODS
This study was conducted on three fields over a three-year period (2008 to 2010) at the USDA-ARS Northwest Irrigation & Soils Re-search Lab in Kimberly, ID on a Portneuf silt loam (coarse-silty mixed superactive, mesic Durixerollic Xeric Haplocalcids). The treatments included tillage system (strip tillage, moldboard plow system, and chisel plow system), and N fertilizer application rate. The N fertilizer rates in 2008 and 2009 were 0, 56, 112, 168, and 224 kg N ha-1and in 2010 were 0, 62, 109, 156, and 227 kg N ha-1. The tillage system de-scriptions are presented in Table 1. The treatments were arranged in a split plot design. Tillage system was the main plot and N fertil-izer application rate was the subplot. Treatment combinations were replicated either three (2008) or four (2009 and 2010) times. Each plot was 4.5 m wide (eight-0.56 m rows) and 12.2 m long.
A Strip Cat tillage implement was used for ST (Twin Diamond In-dustries, LLC, Minden, NE) in the spring. Barley was grown the year previous to the study year at each site. Tillage passes for the MP and CP systems increased in 2010 compared to 2008 and 2009 due to greater barley residue. The number of tillage passes within each tillage method treatment was based on farmer knowledge and judg-ment to obtain suitable seedbed conditions.
Prior to N fertilizer application in spring, three soil cores (4.4 cm diameter) in 0.3 m increments to a depth of 0.6 m were taken in 2008, and to a depth of 0.9 m in 2009 and 2010 in each tillage system main plot of each replication. In 2008, the site had a root restrictive hard pan layer at 0.6 m. Within each tillage system main plot samples were composited by depth increment. Soil samples were analyzed for nitrate-N (NO3-N) and ammonium-N (NH4-N) after extraction in 2M KCl (Mulvaney, 1996) using a flow injection analyzer (Lachat In-struments, Loveland, CO) (Table 2). These data were used to deter-mine the parameter Spring Soil Residual N (NO3-N and NH4-N). The 0 to 0.3 m soil samples were also tested for sodium bicarbonate extractable P and exchangeable K concentrations (Olson et al., 1954) to determine sugar beet requirements of these nutrients (Table 2). In the spring of 2008 (April 25) and 2009 (May 13), N fertilizer (urea ammonium nitrate [UAN, 32-0-0]) was broadcast applied to the soil surface in a single application prior to planting. A nitrification inhibitor (Agrotain®, Saint Louis, MO) was applied at a rate of 3.5 L metric ton-1of UAN prior to application to prevent significant NH
P ha-1was applied to the surface as a band above each row over the entire study area prior to planting as fertilizer grade liquid phos-phoric acid in 2008, and 98 kg P ha-1as superphosphate in 2009. In 2010, no P fertilizer was applied as soil test P level was considered adequate based on the University of Idaho fertilizer recommenda-tions for sugarbeet (Moore et al., 2009).
The study was planted to sugarbeet on April, 25 2008; June 18, 2009; and April 27, 2010 at rate of 128,000 plant ha-1. In 2009, beets were re-planted on June 18 due to poor emergence across the entire study area after the May 5 planting. Seed varieties planted in 2008, 2009, and 2010 were BTS 25RR05, BTS 27RR10, and BTS 27RR10, respectively. The change in variety was due to unavailability of BTS 25RR05 in 2009 and 2010.
To promote emergence and good stands, 44, 89, and 69 mm of water was applied through irrigation + precipitation over an approx-imately two week period after planting in 2008, 2009, and 2010, re-spectively. Following emergence the sites were irrigated uniformly to meet estimated crop evapotranspiration (ETc) rates. The ETc rates were estimated using the Kimberly-Penman ET model (Wright, 1982) using data from an Agrimet weather station (U.S. Bureau of Recla-mation, Boise, ID). In 2008, 2009, and 2010, growing season cumula-tive irrigation + precipitation depths were 874, 567, and 893 mm, respectively.
To determine soil water status for each tillage system treatment throughout the season, volumetric soil water was measured in all replications of each tillage system treatment with 168 kg N ha-1at six depths (0-0.15, 0.15-0.3, 0.3-0.45, 0.45-0.6, 0.6-0.75, 0.75-0.9, 0.9-1.05, and 1.05-1.2 m) on selected dates in 2009 and 2010 using the neutron probe method (Evett and Steiner, 1995).
Glyphosate was applied at a rate of 0.84 kg acid equivalent (in the form of its isopropylamine salt) ha-1on May 5, June 6, and July 16 in 2008, 1.12 kg acid equivalent ha-1on July 9 in 2009, and 2.24 kg acid equivalent ha-1 on June 6 and June 28 in 2010.
Whole plant tops were harvested from 1.5 m sections of 2 rows in each plot on October 21, 2008, October 19, 2009, and October 6, 2010. The samples were dried at 65° C, weighed to determine total dry mat-ter mass (TDM), ground to pass through a 2 mm sieve, and analyzed for total N by combusting a 25 mg sample using a FlashEA1112 CNH analyzer (CE, Elantech, Lakewood, NJ).
Prior to harvest, beet tops were removed and root counts were ob-tained in the harvest area from each plot (4 rows × 9.1 m). Roots were harvested on October 23 and 24, 2008, October 22 and 23, 2009, and October 12, 2010. Total yield was determined from each plot using a load cell-scale on the plot harvester. From each plot, three 8-root samples were obtained and bagged. Two of the samples from each plot were sent to the Amalgamated Sugar Company tare lab for analysis of percent sugar and quality analysis. Percent sugar was determined using an Autopol 880 polarimeter (Rudolph Research
An-P ha-1was applied to the surface as a band above each row over the entire study area prior to planting as fertilizer grade liquid phos-phoric acid in 2008, and 98 kg P ha-1as superphosphate in 2009. In 2010, no P fertilizer was applied as soil test P level was considered adequate based on the University of Idaho fertilizer recommenda-tions for sugarbeet (Moore et al., 2009).
The study was planted to sugarbeet on April, 25 2008; June 18, 2009; and April 27, 2010 at rate of 128,000 plant ha-1. In 2009, beets were re-planted on June 18 due to poor emergence across the entire study area after the May 5 planting. Seed varieties planted in 2008, 2009, and 2010 were BTS 25RR05, BTS 27RR10, and BTS 27RR10, respectively. The change in variety was due to unavailability of BTS 25RR05 in 2009 and 2010.
To promote emergence and good stands, 44, 89, and 69 mm of water was applied through irrigation + precipitation over an approx-imately two week period after planting in 2008, 2009, and 2010, re-spectively. Following emergence the sites were irrigated uniformly to meet estimated crop evapotranspiration (ETc) rates. The ETc rates were estimated using the Kimberly-Penman ET model (Wright, 1982) using data from an Agrimet weather station (U.S. Bureau of Recla-mation, Boise, ID). In 2008, 2009, and 2010, growing season cumula-tive irrigation + precipitation depths were 874, 567, and 893 mm, respectively.
To determine soil water status for each tillage system treatment throughout the season, volumetric soil water was measured in all replications of each tillage system treatment with 168 kg N ha-1at six depths (0-0.15, 0.15-0.3, 0.3-0.45, 0.45-0.6, 0.6-0.75, 0.75-0.9, 0.9-1.05, and 1.05-1.2 m) on selected dates in 2009 and 2010 using the neutron probe method (Evett and Steiner, 1995).
Glyphosate was applied at a rate of 0.84 kg acid equivalent (in the form of its isopropylamine salt) ha-1on May 5, June 6, and July 16 in 2008, 1.12 kg acid equivalent ha-1on July 9 in 2009, and 2.24 kg acid equivalent ha-1 on June 6 and June 28 in 2010.
Whole plant tops were harvested from 1.5 m sections of 2 rows in each plot on October 21, 2008, October 19, 2009, and October 6, 2010. The samples were dried at 65° C, weighed to determine total dry mat-ter mass (TDM), ground to pass through a 2 mm sieve, and analyzed for total N by combusting a 25 mg sample using a FlashEA1112 CNH analyzer (CE, Elantech, Lakewood, NJ).
An-alytical, Hackettstown, NJ), a half-normal weight sample dilution, and aluminum sulfate clarification method [ICUMSA Method GS6-3 1994] (Bartens, 2005). Conductivity was measured using a Foxboro conductivity meter Model 871EC (Foxboro, Foxboro, MA) and nitrate was measured using a Denver Instruments Model 250 multimeter (Denver Instruments, Denver, CO) with Orion probes 900200 and 9300 BNWP (Krackler Scientific, Inc., Albany, NY). Recoverable sucrose yield per ton of roots was estimated by: [(extraction)(0.01)(gross su-crose/ha)]/(t/ha), where extraction = 250 + [[(1255.2)(conductivity) – (15000)(percent sucrose - 6185)]/[(percent sucrose)(98.66 – [(7.845)(con-ductivity)])] ] and gross sucrose = (t/ha)(percent sucrose)(0.01)(1000 kg/t). The third 8-root sample was ground, dried at 93° C, and analyzed for total N by combusting a 25 mg sample using the FlashEA1112 CNH analyzer.
Statistical analysis was conducted separately for each year due to temporal variability, and differences in N supply and management practices over years. Analysis of variance was conducted for tillage and N rate treatment main effects and the interaction for selected production factors (root yield, ERS yield, root sucrose concentration, root brei nitrate concentration, harvest population, top dry mass yield, root total N concentration, root total N mass, top total N con-centration, top total N mass, top C/N ratio, and N use efficiency) using a split plot design model in Statistix 8.2 (Analytical Software, Tallahassee, FL). For each factor, polynomial contrasts were con-ducted for N rate main effects to determine significance of linear and quadratic relationships. Nitrogen response functions were deter-mined for N rate means by root yield and ERS yield using Sigma Plot 10.0 (Systat Software, Chicago, IL). Based on polynomial contrasts and examination of several models, the quadratic model was selected and fit to the data. The economically optimum N rate (EONR) was calculated based on the fitted quadratic function for a range of N fer-tilizer prices. The EONR was the N supply at which the net return from N fertilizer application (RTN) was maximized.
(1) RTN = (Yield+N× Gross Return) – (Yield-N× Gross Return) – (Fertilizer N Amount × N Price)
Gross return was calculated from a base return of $44/Mg beets at 17.4% sugar. The base return was adjusted to the gross return ± $0.30 for every ± 0.1% sugar. Nitrogen prices used were $0.44, $0.88, $1.32, $1.76, and $2.20 kg-1N. The RTN was calculated for every 1 kg increment increase in fertilizer N (1, 2…199, 200 kg N ha-1). The EONR was converted to the economic optimum N supply (EONS) by summing the EONR and measured Spring Soil Residual N.
Nitrogen supply (fertilizer N + spring soil residual N [NO3-N + NH4-N]), N use efficiency (NUE), N recovery efficiency, and N re-moval efficiency were calculated at the maximum root and ERS yield, EONR and EONS for 2008 and 2010 based on the fitted models.
Ni-alytical, Hackettstown, NJ), a half-normal weight sample dilution, and aluminum sulfate clarification method [ICUMSA Method GS6-3 1994] (Bartens, 2005). Conductivity was measured using a Foxboro conductivity meter Model 871EC (Foxboro, Foxboro, MA) and nitrate was measured using a Denver Instruments Model 250 multimeter (Denver Instruments, Denver, CO) with Orion probes 900200 and 9300 BNWP (Krackler Scientific, Inc., Albany, NY). Recoverable sucrose yield per ton of roots was estimated by: [(extraction)(0.01)(gross su-crose/ha)]/(t/ha), where extraction = 250 + [[(1255.2)(conductivity) – (15000)(percent sucrose - 6185)]/[(percent sucrose)(98.66 – [(7.845)(con-ductivity)])] ] and gross sucrose = (t/ha)(percent sucrose)(0.01)(1000 kg/t). The third 8-root sample was ground, dried at 93° C, and analyzed for total N by combusting a 25 mg sample using the FlashEA1112 CNH analyzer.
Statistical analysis was conducted separately for each year due to temporal variability, and differences in N supply and management practices over years. Analysis of variance was conducted for tillage and N rate treatment main effects and the interaction for selected production factors (root yield, ERS yield, root sucrose concentration, root brei nitrate concentration, harvest population, top dry mass yield, root total N concentration, root total N mass, top total N con-centration, top total N mass, top C/N ratio, and N use efficiency) using a split plot design model in Statistix 8.2 (Analytical Software, Tallahassee, FL). For each factor, polynomial contrasts were con-ducted for N rate main effects to determine significance of linear and quadratic relationships. Nitrogen response functions were deter-mined for N rate means by root yield and ERS yield using Sigma Plot 10.0 (Systat Software, Chicago, IL). Based on polynomial contrasts and examination of several models, the quadratic model was selected and fit to the data. The economically optimum N rate (EONR) was calculated based on the fitted quadratic function for a range of N fer-tilizer prices. The EONR was the N supply at which the net return from N fertilizer application (RTN) was maximized.
(1) RTN = (Yield+N× Gross Return) – (Yield-N× Gross Return) – (Fertilizer N Amount × N Price)
Gross return was calculated from a base return of $44/Mg beets at 17.4% sugar. The base return was adjusted to the gross return ± $0.30 for every ± 0.1% sugar. Nitrogen prices used were $0.44, $0.88, $1.32, $1.76, and $2.20 kg-1N. The RTN was calculated for every 1 kg increment increase in fertilizer N (1, 2…199, 200 kg N ha-1). The EONR was converted to the economic optimum N supply (EONS) by summing the EONR and measured Spring Soil Residual N.
Ni-trogen use efficiency in sugarbeet production systems is the mass of sucrose produced per kg of N supply. Quadratic functions were not applied to 2009 data; refer to the Results and Discussion section for explanation.
(2) NUE = kg sucrose / kg N
(3) N Recovery Efficiency = fraction of total N supply in plant (tops + roots) = kg plant total N (tops + roots) / kg N supply (fertilizer N + spring residual soil N [NO3-N + NH4-N])
(4) N Removal Efficiency = fraction of total N supply in roots = kg root total N / kg N supply (fertilizer N + spring residual soil N [NO3 -N + -NH4-N])
Economic comparisons accounting for differences in tillage prac-tices were also evaluated using custom tillage rates in southern Idaho estimated from surveys conducted by the University of Idaho Exten-sion in 2010 and 2011 (Patterson and Painter, 2011). Tillage costs per ha were $72.43 for MP, $48.53 for CP, $43.34 for offset disk, $38.03 for tandem disk, $35.34 for roller harrow, and $46.70 for bed-ding. Only one survey respondent reported costs for ST and the cost was considered high relative to other tillage costs based on other states reported tillage costs. For example, Purdue University had custom ST rates at 95% of the cost of MP custom rates. Other reports of custom tillage rates have ST similar to or slightly lower than MP custom rates. Therefore, for this analysis we will use a custom rate for ST at the same rate as MP ($72.43).
RESULTS AND DISCUSSION Spring Residual Soil NO3-N and NH4-N
There were no statistical differences in spring residual soil N among tillage treatments during all years of this study. In 2008, av-erage spring residual soil N in the 0-0.6 m depth was 104 kg N ha-1. In 2009 and 2010, average spring residual soil N in the 0-0.9 m depth was 240 and 67 kg N ha-1, respectively.
Tillage
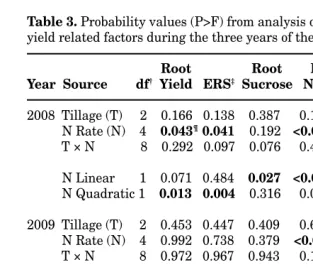
Strip tillage performed similar to MP and CP in most measured factors, including root and ERS yield. There were no differences in root and ERS yield among tillage treatments across N rates (Table 3). These results were similar to results found by Overstreet et al. (2007 and 2008), Regitnig (2007) and Evans et al. (2010), all of whom found no differences in sugarbeet yields between ST and conventional tillage (CT) practices. Conventional tillage practices differed from previously reported studies, but ST consisted of one pass in each study. For example, the CT from the study performed by Evans et al.
trogen use efficiency in sugarbeet production systems is the mass of sucrose produced per kg of N supply. Quadratic functions were not applied to 2009 data; refer to the Results and Discussion section for explanation.
(2) NUE = kg sucrose / kg N
(3) N Recovery Efficiency = fraction of total N supply in plant (tops + roots) = kg plant total N (tops + roots) / kg N supply (fertilizer N + spring residual soil N [NO3-N + NH4-N])
(4) N Removal Efficiency = fraction of total N supply in roots = kg root total N / kg N supply (fertilizer N + spring residual soil N [NO3 -N + -NH4-N])
Economic comparisons accounting for differences in tillage prac-tices were also evaluated using custom tillage rates in southern Idaho estimated from surveys conducted by the University of Idaho Exten-sion in 2010 and 2011 (Patterson and Painter, 2011). Tillage costs per ha were $72.43 for MP, $48.53 for CP, $43.34 for offset disk, $38.03 for tandem disk, $35.34 for roller harrow, and $46.70 for bed-ding. Only one survey respondent reported costs for ST and the cost was considered high relative to other tillage costs based on other states reported tillage costs. For example, Purdue University had custom ST rates at 95% of the cost of MP custom rates. Other reports of custom tillage rates have ST similar to or slightly lower than MP custom rates. Therefore, for this analysis we will use a custom rate for ST at the same rate as MP ($72.43).
RESULTS AND DISCUSSION Spring Residual Soil NO3-N and NH4-N
There were no statistical differences in spring residual soil N among tillage treatments during all years of this study. In 2008, av-erage spring residual soil N in the 0-0.6 m depth was 104 kg N ha-1. In 2009 and 2010, average spring residual soil N in the 0-0.9 m depth was 240 and 67 kg N ha-1, respectively.
Tillage
(2010) included a ripper pass, two passes with a rolling mulcher, two passes with a leveler, and one pass with an S-tine cultivator with rolling baskets. Strip tillage consisted of one pass with a custom ST machine from Schlagel Mfg (Torrington, WY). In four years of the 5-year study, there were no significant differences in sugar and root yields among the tillage practices. However, during one year of the Evans et al. (2010) study, ST yielded 17% higher in sugar and root yield compared to CT due to greater wind damage early in the spring to sugarbeet plants under CT. The surface stubble in the ST treat-ments provided protection to the young sugarbeet plants. In our study, we did not see seedling damage resulting from wind in any of the tillage treatments.
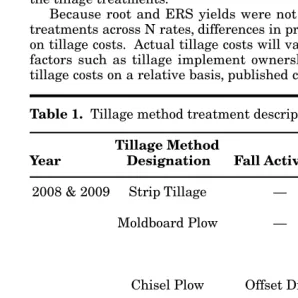
Because root and ERS yields were not different among tillage treatments across N rates, differences in production costs are based on tillage costs. Actual tillage costs will vary greatly depending on factors such as tillage implement ownership status. To compare tillage costs on a relative basis, published custom tillage rates were
Table 1. Tillage method treatment descriptions.
Tillage Method
Year Designation Fall Activity Spring Activity
Strip Tillage
Moldboard Plow
Chisel Plow
Strip Tillage
Moldboard Plow
Chisel Plow
—
—
Offset Disk
—
—
—
Strip Tillage
Moldboard Plow Roller Harrow
Bed
Chisel Plow Tandem Disk
Bed Strip Tillage
Moldboard Plow Roller Harrow Roller Harrow
Bed
Offset Disk Offset Disk Chisel Plow Tandem Disk Tandem Disk Tandem Disk
Bed 2008 & 2009
2010
(2010) included a ripper pass, two passes with a rolling mulcher, two passes with a leveler, and one pass with an S-tine cultivator with rolling baskets. Strip tillage consisted of one pass with a custom ST machine from Schlagel Mfg (Torrington, WY). In four years of the 5-year study, there were no significant differences in sugar and root yields among the tillage practices. However, during one year of the Evans et al. (2010) study, ST yielded 17% higher in sugar and root yield compared to CT due to greater wind damage early in the spring to sugarbeet plants under CT. The surface stubble in the ST treat-ments provided protection to the young sugarbeet plants. In our study, we did not see seedling damage resulting from wind in any of the tillage treatments.
Because root and ERS yields were not different among tillage treatments across N rates, differences in production costs are based on tillage costs. Actual tillage costs will vary greatly depending on factors such as tillage implement ownership status. To compare tillage costs on a relative basis, published custom tillage rates were
Table 1. Tillage method treatment descriptions.
Tillage Method
Year Designation Fall Activity Spring Activity
Strip Tillage
Moldboard Plow
Chisel Plow
Strip Tillage
Moldboard Plow
Chisel Plow
—
—
Offset Disk
—
—
—
Strip Tillage
Moldboard Plow Roller Harrow
Bed
Chisel Plow Tandem Disk
Bed Strip Tillage
Moldboard Plow Roller Harrow Roller Harrow
Bed
Offset Disk Offset Disk Chisel Plow Tandem Disk Tandem Disk Tandem Disk
Bed 2008 & 2009
used for this analysis. In both 2008 and 2009, tillage treatment costs for the ST, MP, and CP systems (Table 1) were $72.43, $154.47, and $176.60, respectively. In 2010, tillage treatment costs for the ST, MP, and CP systems were $72.43, $189.81, and $296.00 ha-1, respectively. Reduction in tillage costs for ST compared to the MP and CP systems ranged from 53% to 76% over all years of this study. Differences in tillage costs were associated with the number of tillage passes and types of tillage (Table 1).
Factors that differed among tillage treatments were harvest pop-ulations in 2009 and 2010, TDM in 2010, and top total N mass in 2010. In 2009 and 2010, ST and MP had similar harvest populations (average = 190,300 plants ha-1in 2009 and 135,900 plants ha-1in 2010 averaged over N rate) and were significantly greater than CP (168,900 in 2009 and 108,400 in 2010 averaged over N rate). Residue mixed into the surface soil with CP likely reduced soil to seed contact, resulting in reduced emergence leading to reduced plant populations, while ST swept all surface residues aside and MP placed the surface residues approximately 25 cm below the soil surface resulting in good soil and seed contact. In 2010, ST had greater TDM (9,473 kg ha-1) than CP (7,549 kg ha-1); MP (8,816 kg ha-1) and CP were not signifi-cantly different. In 2010, ST had greater sugarbeet top N mass (234 kg N ha-1averaged over N rate; top N mass = N in TDM) than MP and CP (average = 185 kg N ha-1averaged over N rate). The in-creased TDM under ST resulted in the top N mass differences.
In 2008, tillage treatment harvest populations were not different. Although not statistically compared, harvest populations in 2008 ap-peared lower than in 2009 and 2010. It is likely that the seed germi-nation was lower in 2008 than in 2009 and 2010. However, the populations in 2008 were within recommended populations (Amal-gamated Sugar Company, 2010).
Soil water
There were tillage and date (soil water sampling date) main effect
Table 2.Selected soil nutrient concentrations of study sites in 2008, 2009, 2010.
Soil Nutrient 2008 2009 2010
---mg kg-1
---NO3-N† 7.7 12.3 2.5
NH4-N† 3.2 5.5 2.5
P2O5‡ 11.6 4.8 19.0
K2O‡ 114 114 205
†0-0.6 m in 2008; 0-0.9 m in 2009 and 2010. ‡0-0.3 m.
used for this analysis. In both 2008 and 2009, tillage treatment costs for the ST, MP, and CP systems (Table 1) were $72.43, $154.47, and $176.60, respectively. In 2010, tillage treatment costs for the ST, MP, and CP systems were $72.43, $189.81, and $296.00 ha-1, respectively. Reduction in tillage costs for ST compared to the MP and CP systems ranged from 53% to 76% over all years of this study. Differences in tillage costs were associated with the number of tillage passes and types of tillage (Table 1).
Factors that differed among tillage treatments were harvest pop-ulations in 2009 and 2010, TDM in 2010, and top total N mass in 2010. In 2009 and 2010, ST and MP had similar harvest populations (average = 190,300 plants ha-1in 2009 and 135,900 plants ha-1in 2010 averaged over N rate) and were significantly greater than CP (168,900 in 2009 and 108,400 in 2010 averaged over N rate). Residue mixed into the surface soil with CP likely reduced soil to seed contact, resulting in reduced emergence leading to reduced plant populations, while ST swept all surface residues aside and MP placed the surface residues approximately 25 cm below the soil surface resulting in good soil and seed contact. In 2010, ST had greater TDM (9,473 kg ha-1) than CP (7,549 kg ha-1); MP (8,816 kg ha-1) and CP were not signifi-cantly different. In 2010, ST had greater sugarbeet top N mass (234 kg N ha-1averaged over N rate; top N mass = N in TDM) than MP and CP (average = 185 kg N ha-1averaged over N rate). The in-creased TDM under ST resulted in the top N mass differences.
In 2008, tillage treatment harvest populations were not different. Although not statistically compared, harvest populations in 2008 ap-peared lower than in 2009 and 2010. It is likely that the seed germi-nation was lower in 2008 than in 2009 and 2010. However, the populations in 2008 were within recommended populations (Amal-gamated Sugar Company, 2010).
Soil water
There were tillage and date (soil water sampling date) main effect
Table 2.Selected soil nutrient concentrations of study sites in 2008, 2009, 2010.
Soil Nutrient 2008 2009 2010
---mg kg-1
---NO3-N† 7.7 12.3 2.5
NH4-N† 3.2 5.5 2.5
P2O5‡ 11.6 4.8 19.0
K2O‡ 114 114 205
differences in soil water depth in the 0 to 1.05 m root zone in 2009 and 2010 (Table 5). No soil water measurements were taken in 2008. In 2009, the order of soil water depth was CP>ST>MP, with water depths of 293, 284, and 274 mm, respectively, averaged over meas-urement date. In 2010, the order of soil water was CP>ST=MP, with soil water depths of 313, 299, and 299 mm, respectively, averaged over measurement date. The greater soil water in the CP treatment was likely due to reduced water usage by plants resulting from lower plant populations in CP compared to ST and MP (Table 3 and 6). In 2009, the residue remaining on the soil surface under ST likely re-sulted in greater soil water compared to MP, but in 2010, the residue under ST had no measurable effect on soil water compared to the lack of residue on the soil surface under MP. In 2010, the quantity of ir-rigation applied (893 mm) likely masked any decreased rates of evap-oration at the soil surface associated with the surface residues in ST.
Table 3.Probability values (P>F) from analysis of variance for measured yield related factors during the three years of the study.
Root Root Brei Harvest
Year Source df† Yield ERS‡ Sucrose Nitrate Population TDM§
2008 Tillage (T) 2 0.166 0.138 0.387 0.148 0.373 0.141 N Rate (N) 4 0.043¶0.041 0.192 <0.000 <0.001 <0.001
T × N 8 0.292 0.097 0.076 0.404 0.095 0.345
N Linear 1 0.071 0.484 0.027 <0.001 <0.001 <0.001
N Quadratic 1 0.013 0.004 0.316 0.026 0.456 0.114 2009 Tillage (T) 2 0.453 0.447 0.409 0.643 0.005 0.208 N Rate (N) 4 0.992 0.738 0.379 <0.001 0.551 0.249 T × N 8 0.972 0.967 0.943 0.170 0.817 0.989
N Linear 1 0.797 0.786 0.307 <0.001 0.314 0.027
N Quadratic 1 0.808 0.555 0.468 0.207 0.528 0.582
2010 Tillage (T) 2 0.094 0.057 0.089 0.890 0.009 0.042
N Rate (N) 4 <0.001 <0.001 0.064 0.001 0.508 <0.001
T × N 8 0.877 0.793 0.931 0.590 0.311 0.596
N Linear 1 <0.001 <0.001 0.928 <0.001 0.782 <0.001
N Quadratic 1 <0.001 <0.001 0.007 0.014 0.179 0.158 †Degrees of freedom.
‡Estimated Recoverable Sucrose §Top dry matter.
¶ Bolded probability values are significant at the 0.05 level.
differences in soil water depth in the 0 to 1.05 m root zone in 2009 and 2010 (Table 5). No soil water measurements were taken in 2008. In 2009, the order of soil water depth was CP>ST>MP, with water depths of 293, 284, and 274 mm, respectively, averaged over meas-urement date. In 2010, the order of soil water was CP>ST=MP, with soil water depths of 313, 299, and 299 mm, respectively, averaged over measurement date. The greater soil water in the CP treatment was likely due to reduced water usage by plants resulting from lower plant populations in CP compared to ST and MP (Table 3 and 6). In 2009, the residue remaining on the soil surface under ST likely re-sulted in greater soil water compared to MP, but in 2010, the residue under ST had no measurable effect on soil water compared to the lack of residue on the soil surface under MP. In 2010, the quantity of ir-rigation applied (893 mm) likely masked any decreased rates of evap-oration at the soil surface associated with the surface residues in ST.
Table 3.Probability values (P>F) from analysis of variance for measured yield related factors during the three years of the study.
Root Root Brei Harvest
Year Source df† Yield ERS‡ Sucrose Nitrate Population TDM§
2008 Tillage (T) 2 0.166 0.138 0.387 0.148 0.373 0.141 N Rate (N) 4 0.043¶0.041 0.192 <0.000 <0.001 <0.001
T × N 8 0.292 0.097 0.076 0.404 0.095 0.345
N Linear 1 0.071 0.484 0.027 <0.001 <0.001 <0.001
N Quadratic 1 0.013 0.004 0.316 0.026 0.456 0.114 2009 Tillage (T) 2 0.453 0.447 0.409 0.643 0.005 0.208 N Rate (N) 4 0.992 0.738 0.379 <0.001 0.551 0.249 T × N 8 0.972 0.967 0.943 0.170 0.817 0.989
N Linear 1 0.797 0.786 0.307 <0.001 0.314 0.027
N Quadratic 1 0.808 0.555 0.468 0.207 0.528 0.582
2010 Tillage (T) 2 0.094 0.057 0.089 0.890 0.009 0.042
N Rate (N) 4 <0.001 <0.001 0.064 0.001 0.508 <0.001
T × N 8 0.877 0.793 0.931 0.590 0.311 0.596
N Linear 1 <0.001 <0.001 0.928 <0.001 0.782 <0.001
N Quadratic 1 <0.001 <0.001 0.007 0.014 0.179 0.158 †Degrees of freedom.
‡Estimated Recoverable Sucrose §Top dry matter.
In 2009, 326 mm less irrigation was applied compared to 2010 due to a shorter growing season resulting from replanting in June.
Nitrogen Supply
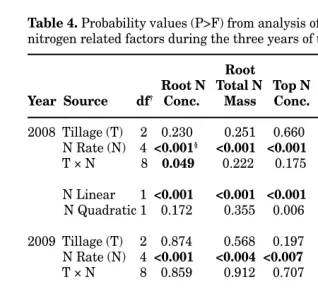
In 2008 and 2010, N supply had a significant effect on most meas-ured factors (Tables 3 and 4). Because of high spring residual soil N (240 kg N ha-1) and a shortened growing season due to late re-plant-ing date in 2009, N supply did not significantly influence root and ERS yields. Therefore, regression analysis and associated analyses were only conducted for the 2008 and 2010 data sets.
Brei Nitrate and Root Sucrose Concentration
Brei nitrate is a measure of N related impurities in sugarbeet roots that result in reduced sucrose concentration and decreased su-crose extraction efficiency. In the Amalgamated Sugar Company
Sug-Table 4.Probability values (P>F) from analysis of variance for measured nitrogen related factors during the three years of the study.
Root Top Top Root N Total N Top N Total N C/N
Year Source df† Conc. Mass Conc. Mass Ratio NUE‡
2008 Tillage (T) 2 0.230 0.251 0.660 0.398 0.338 0.188 N Rate (N) 4 <0.001§ <0.001 <0.001 <0.001 <0.001 <0.001
T × N 8 0.049 0.222 0.175 0.296 0.540 0.057 N Linear 1 <0.001 <0.001 <0.001 <0.001 <0.001 <0.001
N Quadratic 1 0.172 0.355 0.006 0.877 0.065 <0.001
2009 Tillage (T) 2 0.874 0.568 0.197 0.146 0.178 0.452 N Rate (N) 4 <0.001 <0.004 <0.007 <0.049 <0.009 <0.001
T × N 8 0.859 0.912 0.707 0.999 0.644 0.948
N Linear 1 <0.001 <0.001 <0.001 <0.003 <0.001 <0.001
N Quadratic 1 0.677 0.950 0.647 0.598 0.238 0.028
2010 Tillage (T) 2 0.698 0.602 0.094 0.038 0.219 0.141 N Rate (N) 4 <0.001 <0.001 0.091 <0.001 0.063 <0.001
T × N 8 0.307 0.228 0.868 0.451 0.756 0.944
N Linear 1 <0.001 <0.001 0.939 <0.001 0.311 <0.001
N Quadratic 1 0.410 0.051 0.030 0.404 0.029 <0.001 †Degrees of freedom.
‡Nitrogen Use Efficiency.
§Bolded probability values are significant at the 0.05 level.
In 2009, 326 mm less irrigation was applied compared to 2010 due to a shorter growing season resulting from replanting in June.
Nitrogen Supply
In 2008 and 2010, N supply had a significant effect on most meas-ured factors (Tables 3 and 4). Because of high spring residual soil N (240 kg N ha-1) and a shortened growing season due to late re-plant-ing date in 2009, N supply did not significantly influence root and ERS yields. Therefore, regression analysis and associated analyses were only conducted for the 2008 and 2010 data sets.
Brei Nitrate and Root Sucrose Concentration
Brei nitrate is a measure of N related impurities in sugarbeet roots that result in reduced sucrose concentration and decreased su-crose extraction efficiency. In the Amalgamated Sugar Company
Sug-Table 4.Probability values (P>F) from analysis of variance for measured nitrogen related factors during the three years of the study.
Root Top Top Root N Total N Top N Total N C/N
Year Source df† Conc. Mass Conc. Mass Ratio NUE‡
2008 Tillage (T) 2 0.230 0.251 0.660 0.398 0.338 0.188 N Rate (N) 4 <0.001§ <0.001 <0.001 <0.001 <0.001 <0.001
T × N 8 0.049 0.222 0.175 0.296 0.540 0.057 N Linear 1 <0.001 <0.001 <0.001 <0.001 <0.001 <0.001
N Quadratic 1 0.172 0.355 0.006 0.877 0.065 <0.001
2009 Tillage (T) 2 0.874 0.568 0.197 0.146 0.178 0.452 N Rate (N) 4 <0.001 <0.004 <0.007 <0.049 <0.009 <0.001
T × N 8 0.859 0.912 0.707 0.999 0.644 0.948
N Linear 1 <0.001 <0.001 <0.001 <0.003 <0.001 <0.001
N Quadratic 1 0.677 0.950 0.647 0.598 0.238 0.028
2010 Tillage (T) 2 0.698 0.602 0.094 0.038 0.219 0.141 N Rate (N) 4 <0.001 <0.001 0.091 <0.001 0.063 <0.001
T × N 8 0.307 0.228 0.868 0.451 0.756 0.944
N Linear 1 <0.001 <0.001 0.939 <0.001 0.311 <0.001
N Quadratic 1 0.410 0.051 0.030 0.404 0.029 <0.001 †Degrees of freedom.
‡Nitrogen Use Efficiency.
arbeet Growers Guide Book, it is stated that sucrose concentration decreases by approximately 0.5% for every 100 mg brei nitrate kg-1, and above average sucrose concentrations are likely at brei nitrate concentration below 200 mg kg-1 (Amalgamated Sugar Company, 2010). High brei nitrate levels indicate that excessive N was available during the growing season.
In 2009, brei nitrate levels were elevated and root sucrose concen-trations were reduced in the beet roots (Table 6), indicating N supply was excessive, providing added evidence that high N supply at all N fertilizer rates resulted in non significant N supply main effects dur-ing the shortened growdur-ing season. In 2008 and 2010 brei nitrate con-centration ranged from 48 to 157 mg kg-1and 197 to 345 mg kg-1, respectively (Table 6). Considering that spring residual soil N was higher in 2008 compared to 2010 (Table 2), brei nitrate results indi-cate higher quantities of N mineralized from soil organic matter dur-ing the growdur-ing season in 2010 relative to 2008. For each year of this study, brei nitrate concentration ranges across N supply did not re-sult in differences in root sucrose concentrations, likely due to fairly narrow ranges of brie nitrate concentrations.
ERS and Root Yield Response to Nitrogen
Because there were no differences in ERS and root yield response among tillage treatments (Tables 3 and 6), ERS and root yield at each N rate were averaged across tillage treatments prior to analyzing the relationship between ERS and N rate and root yield and N rate. This data shows that N application rates, when surface applied and irri-gated into the soil, was similar for all tillage systems, making N man-agement for growers easier among tillage systems. Stevens et al. (2010) concluded that N rate need not be changed based on tillage practice (CT vs. ST) when N was applied via a band for ST and broad-cast for CT. Although N application methods differed between our study and Stevens et al. (2010), evidence suggests in a given growing area, N rates to achieve optimum yields can be similar across tillage systems. In 2009, N rate had no effect on root yield or ERS yield. This was a result of high spring residual soil N and a shorter growing season due to replanting. However, in 2008 and 2010 N rate did have
Table 5.Analysis of variance effects of tillage, date and the tillage by date (soil water sampling date) interaction for soil water depth in the 0-1.05 m soil depth in 2009 and 2010.
2009 2010
P>F
Tillage (T) <0.001 0.003
Date (D) <0.001 <0.001
T × D 0.0981 0.458
arbeet Growers Guide Book, it is stated that sucrose concentration decreases by approximately 0.5% for every 100 mg brei nitrate kg-1, and above average sucrose concentrations are likely at brei nitrate concentration below 200 mg kg-1 (Amalgamated Sugar Company, 2010). High brei nitrate levels indicate that excessive N was available during the growing season.
In 2009, brei nitrate levels were elevated and root sucrose concen-trations were reduced in the beet roots (Table 6), indicating N supply was excessive, providing added evidence that high N supply at all N fertilizer rates resulted in non significant N supply main effects dur-ing the shortened growdur-ing season. In 2008 and 2010 brei nitrate con-centration ranged from 48 to 157 mg kg-1and 197 to 345 mg kg-1, respectively (Table 6). Considering that spring residual soil N was higher in 2008 compared to 2010 (Table 2), brei nitrate results indi-cate higher quantities of N mineralized from soil organic matter dur-ing the growdur-ing season in 2010 relative to 2008. For each year of this study, brei nitrate concentration ranges across N supply did not re-sult in differences in root sucrose concentrations, likely due to fairly narrow ranges of brie nitrate concentrations.
ERS and Root Yield Response to Nitrogen
Because there were no differences in ERS and root yield response among tillage treatments (Tables 3 and 6), ERS and root yield at each N rate were averaged across tillage treatments prior to analyzing the relationship between ERS and N rate and root yield and N rate. This data shows that N application rates, when surface applied and irri-gated into the soil, was similar for all tillage systems, making N man-agement for growers easier among tillage systems. Stevens et al. (2010) concluded that N rate need not be changed based on tillage practice (CT vs. ST) when N was applied via a band for ST and broad-cast for CT. Although N application methods differed between our study and Stevens et al. (2010), evidence suggests in a given growing area, N rates to achieve optimum yields can be similar across tillage systems. In 2009, N rate had no effect on root yield or ERS yield. This was a result of high spring residual soil N and a shorter growing season due to replanting. However, in 2008 and 2010 N rate did have
Table 5.Analysis of variance effects of tillage, date and the tillage by date (soil water sampling date) interaction for soil water depth in the 0-1.05 m soil depth in 2009 and 2010.
2009 2010
P>F
Tillage (T) <0.001 0.003
Date (D) <0.001 <0.001
a significant effect on root yield and ERS yield and displayed a highly significant quadratic relationship (Table 3). In 2008 and 2010, the quadratic models accounted for >90% of the variability in ERS and root yields associated with N rate (Table 8).
Delta yields are presented as the differences between maximum ERS and root yields (Tables 9 and 10) and the ERS and root yields with no N applied (Table 8) based on quadratic model data. In 2008 and 2010, delta yields for ERS were 1,099 and 3,819 kg ha-1, respec-tively. In 2008 and 2010 delta yields for root production were 8.1 and 26.3 Mg ha-1, respectively. The greater delta yields in 2010 compared to 2008 were not explained by differences in N supply during each year (224 and 230 kg ha-1, in 2008 and 2010, respectively; Table 6). The reason for greater yield responses to N in 2010 compared to 2008 could be related to N mineralization and other soil related factors,
Table 6.Root yield, estimated recoverable sucrose (ERS) yield, root sucrose concentration, brei nitrate, harvest stand, and top dry matter (TDM) at N rates and supply in 2008, 2009, and 2010. Data are averaged over tillage treatments.
N N Root Root Brei Harvest
Year Rate† Supply‡ Yield ERS Sucrose Nitrate Population TDM
2008
2009
2010
Plants ha-1
kg ha-1 kg ha-1 Mg ha-1 kg ha-1 % mg ha-1 × 1000 kg ha-1
0 104 67.1 10327 17.9 47.8 96.6 2375
56 160 71.7 11047 17.9 63.7 94.4 3160
112 216 75.7 11604 17.8 70.1 86.5 3791
168 272 73.2 11062 17.7 79.1 77.6 4018
224 328 71.8 10637 17.4 157.3 70.5 4295
0 240 40.2 4669 14.7 1023.7 184.4 7403
43 283 40.9 4914 14.9 961.0 187.2 7505
102 342 40.5 4680 14.6 1125.6 181.8 7552
157 397 41.2 4818 14.8 1151.9 179.6 7993
230 470 40.7 4671 14.5 1337.0 182.8 8412
0 67 53.8 7211 16.2 209.4 125.6 5372
62 129 71.3 9766 16.4 196.7 130.6 8520
112 179 74.7 10440 16.7 204.1 124.7 8023
157 224 79.5 11012 16.5 242.9 130.4 10126
230 297 80.7 10858 16.2 345.5 124.5 10841
†N applied in fertilizer.
‡N applied in fertilizer + spring residual soil NO
3-N and NH4-N.
a significant effect on root yield and ERS yield and displayed a highly significant quadratic relationship (Table 3). In 2008 and 2010, the quadratic models accounted for >90% of the variability in ERS and root yields associated with N rate (Table 8).
Delta yields are presented as the differences between maximum ERS and root yields (Tables 9 and 10) and the ERS and root yields with no N applied (Table 8) based on quadratic model data. In 2008 and 2010, delta yields for ERS were 1,099 and 3,819 kg ha-1, respec-tively. In 2008 and 2010 delta yields for root production were 8.1 and 26.3 Mg ha-1, respectively. The greater delta yields in 2010 compared to 2008 were not explained by differences in N supply during each year (224 and 230 kg ha-1, in 2008 and 2010, respectively; Table 6). The reason for greater yield responses to N in 2010 compared to 2008 could be related to N mineralization and other soil related factors,
Table 6.Root yield, estimated recoverable sucrose (ERS) yield, root sucrose concentration, brei nitrate, harvest stand, and top dry matter (TDM) at N rates and supply in 2008, 2009, and 2010. Data are averaged over tillage treatments.
N N Root Root Brei Harvest
Year Rate† Supply‡ Yield ERS Sucrose Nitrate Population TDM
2008
2009
2010
Plants ha-1
kg ha-1 kg ha-1 Mg ha-1 kg ha-1 % mg ha-1 × 1000 kg ha-1
0 104 67.1 10327 17.9 47.8 96.6 2375
56 160 71.7 11047 17.9 63.7 94.4 3160
112 216 75.7 11604 17.8 70.1 86.5 3791
168 272 73.2 11062 17.7 79.1 77.6 4018
224 328 71.8 10637 17.4 157.3 70.5 4295
0 240 40.2 4669 14.7 1023.7 184.4 7403
43 283 40.9 4914 14.9 961.0 187.2 7505
102 342 40.5 4680 14.6 1125.6 181.8 7552
157 397 41.2 4818 14.8 1151.9 179.6 7993
230 470 40.7 4671 14.5 1337.0 182.8 8412
0 67 53.8 7211 16.2 209.4 125.6 5372
62 129 71.3 9766 16.4 196.7 130.6 8520
112 179 74.7 10440 16.7 204.1 124.7 8023
157 224 79.5 11012 16.5 242.9 130.4 10126
230 297 80.7 10858 16.2 345.5 124.5 10841
†N applied in fertilizer.
‡N applied in fertilizer + spring residual soil NO
and climatic factors. It is possible that greater N mineralization oc-curred during the growing season after spring soil samples were col-lected in 2010 than in 2008. It is also possible that other site and climatic factors could have resulted in the difference in yield response rates between the two years. However, during 2008 and 2010, N fer-tilizer additions were critical to achieve maximum yields.
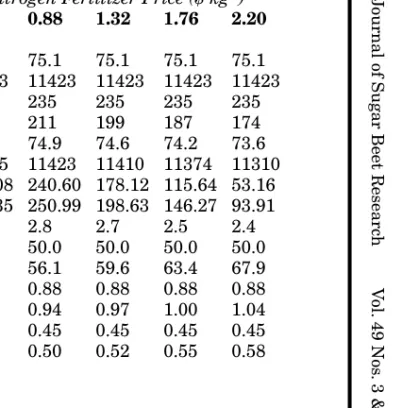
In 2008 and 2010, ERS yields at the EONS ranged from 11,310 to 11,415 kg ha-1and 11,054 to 11,127 kg ha-1, respectively, across N price (Tables 9 and 10). In 2008, the difference in maximum ERS yield and ERS yield at the EONS ranged from 12 kg at the N price of $0.44 kg-1N to 61 kg at $2.20 kg-1N. In 2010, the difference in max-imum ERS yield and ERS yield at the EONS ranged from 1 kg at the N price of $0.44 kg-1N to 74 kg at $2.20 kg-1N.
In 2008 and 2010, root yield at the EONS ranged from 75.1 to 73.6
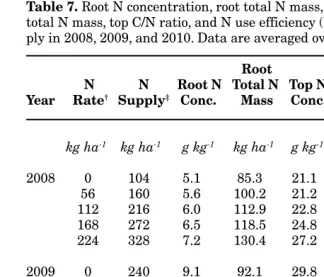
Table 7.Root N concentration, root total N mass, top N concentration, top total N mass, top C/N ratio, and N use efficiency (NUE) at N rates and sup-ply in 2008, 2009, and 2010. Data are averaged over tillage treatments.
Root Top Top N N Root N Total N Top N Total N C/N
Year Rate† Supply‡ Conc. Mass Conc. Mass Ratio NUE kg sucrose kg ha-1 kg ha-1 g kg-1 kg ha-1 g kg-1 kg ha-1 kg-1N
2008 0 104 5.1 85.3 21.1 50.9 17.6 99.1
56 160 5.6 100.2 21.2 67.0 17.6 69.0
112 216 6.0 112.9 22.8 86.7 16.1 53.7
168 272 6.5 118.5 24.8 100.5 14.7 40.6
224 328 7.2 130.4 27.2 117.6 13.4 32.4
2009 0 240 9.1 92.1 29.8 219.7 11.3 19.5
43 283 9.5 97.3 29.0 219.0 11.6 17.4
102 342 10.1 101.8 30.5 231.0 11.2 13.7
157 397 10.2 104.8 31.2 250.4 10.9 12.2
230 470 11.1 112.9 31.9 268.7 10.6 10.0
2010 0 67 5.3 72.6 23.8 127.1 14.3 107.3
62 129 5.7 102.2 23.6 207.1 14.9 75.8
112 179 5.9 113.6 22.8 179.3 16.1 58.3
157 224 6.1 115.2 21.9 231.1 15.3 49.2
230 297 6.8 136.3 23.7 258.2 15.0 36.6
†N applied in fertilizer.
‡N applied in fertilizer + spring residual soil NO
3-N and NH4-N.
and climatic factors. It is possible that greater N mineralization oc-curred during the growing season after spring soil samples were col-lected in 2010 than in 2008. It is also possible that other site and climatic factors could have resulted in the difference in yield response rates between the two years. However, during 2008 and 2010, N fer-tilizer additions were critical to achieve maximum yields.
In 2008 and 2010, ERS yields at the EONS ranged from 11,310 to 11,415 kg ha-1and 11,054 to 11,127 kg ha-1, respectively, across N price (Tables 9 and 10). In 2008, the difference in maximum ERS yield and ERS yield at the EONS ranged from 12 kg at the N price of $0.44 kg-1N to 61 kg at $2.20 kg-1N. In 2010, the difference in max-imum ERS yield and ERS yield at the EONS ranged from 1 kg at the N price of $0.44 kg-1N to 74 kg at $2.20 kg-1N.
In 2008 and 2010, root yield at the EONS ranged from 75.1 to 73.6
Table 7.Root N concentration, root total N mass, top N concentration, top total N mass, top C/N ratio, and N use efficiency (NUE) at N rates and sup-ply in 2008, 2009, and 2010. Data are averaged over tillage treatments.
Root Top Top N N Root N Total N Top N Total N C/N
Year Rate† Supply‡ Conc. Mass Conc. Mass Ratio NUE kg sucrose kg ha-1 kg ha-1 g kg-1 kg ha-1 g kg-1 kg ha-1 kg-1N
2008 0 104 5.1 85.3 21.1 50.9 17.6 99.1
56 160 5.6 100.2 21.2 67.0 17.6 69.0
112 216 6.0 112.9 22.8 86.7 16.1 53.7
168 272 6.5 118.5 24.8 100.5 14.7 40.6
224 328 7.2 130.4 27.2 117.6 13.4 32.4
2009 0 240 9.1 92.1 29.8 219.7 11.3 19.5
43 283 9.5 97.3 29.0 219.0 11.6 17.4
102 342 10.1 101.8 30.5 231.0 11.2 13.7
157 397 10.2 104.8 31.2 250.4 10.9 12.2
230 470 11.1 112.9 31.9 268.7 10.6 10.0
2010 0 67 5.3 72.6 23.8 127.1 14.3 107.3
62 129 5.7 102.2 23.6 207.1 14.9 75.8
112 179 5.9 113.6 22.8 179.3 16.1 58.3
157 224 6.1 115.2 21.9 231.1 15.3 49.2
230 297 6.8 136.3 23.7 258.2 15.0 36.6
†N applied in fertilizer.
‡N applied in fertilizer + spring residual soil NO
Mg ha-1 and 79.9 to 79.1 Mg ha-1, respectively, across N price (Tables 9 and 10). In 2008, the difference in maximum root yield and root yield at the EONS ranged from 0 Mg at the N price of $0.44 kg-1N to 1.5 Mg at $2.20 kg-1N. Across the same N price range, the difference in N supply to achieve maximum root yield (MRYNS) and EONS were 12 and 61 kg N ha-1. In 2010, the difference in maximum root yield and root yield at the EONS ranged from 0.1 Mg at the N price of $0.44 kg-1N to 0.9 Mg at $2.20 kg-1N. Across the same N price range the difference in the MRYNS and EONS were 6 and 30 kg N ha-1.
In 2008 and 2010, the MRYNS values based on quadratic models were 235 and 227 kg ha-1, respectively. Nitrogen supply to achieve maximum sucrose yield (MSYNS) based on quadratic models were 212 and 219 kg ha-1, respectively.
The economic analysis in this study was based on a set sugar price formula at the time of the study and changing N prices. Changes in economic related variables from this data set are related to both N price and sugar price. The ratio of these prices will result in changes in the economic related variables. Based on USDA-Economic Re-search Service data, 2012 average N fertilizer price based on UAN and urea was $1.34/kg.
Economic Optimum Nitrogen Supply
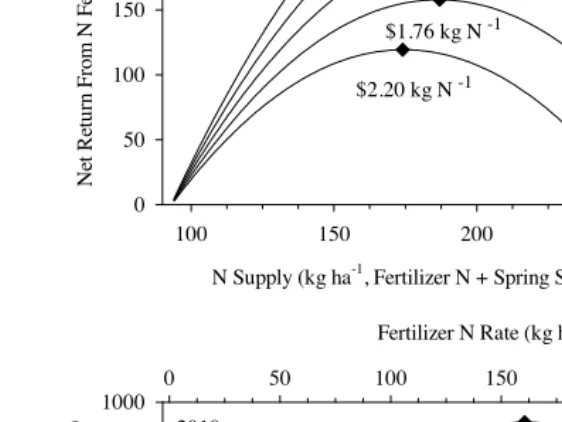
The N prices used in this analysis cover a range encompassing current and estimated future prices. The EONS in 2008 over an N price range of $0.44 to $2.20 kg-1, ranged from 223 to 174 kg N ha-1. In 2010, the range was from 221 to 197 kg N ha-1over the same N Table 8.Coefficients for quadratic functions (y = y0+ ax + bx2)† applied to root yield and estimated recoverable sucrose (ERS) yield in 2008 and 2010. Results from 2009 are not included because there was no significant response to N.
Year y0 a b SE‡ R2§
2008 Root Yield 67.03 0.1139 -0.0004 1.20 0.93
ERS Yield 10324.6 18.42 -0.0772 192.6 0.92
2010 Root Yield 54.74 0.3013 -0.0009 2.29 0.98
ERS Yield 7308.6 48.01 -0.1509 241.3 0.99
† y = root yield or estimated recoverable sucrose yield; y
0= yield (kg
ha-1) at 0 kg applied N; a = constant; x = N rate (kg N ha-1); b= con-stant.
‡SE = Standard error of predicted root yield or estimated recoverable sucrose yield.
§Square of the correlation coefficient.
Mg ha-1 and 79.9 to 79.1 Mg ha-1, respectively, across N price (Tables 9 and 10). In 2008, the difference in maximum root yield and root yield at the EONS ranged from 0 Mg at the N price of $0.44 kg-1N to 1.5 Mg at $2.20 kg-1N. Across the same N price range, the difference in N supply to achieve maximum root yield (MRYNS) and EONS were 12 and 61 kg N ha-1. In 2010, the difference in maximum root yield and root yield at the EONS ranged from 0.1 Mg at the N price of $0.44 kg-1N to 0.9 Mg at $2.20 kg-1N. Across the same N price range the difference in the MRYNS and EONS were 6 and 30 kg N ha-1.
In 2008 and 2010, the MRYNS values based on quadratic models were 235 and 227 kg ha-1, respectively. Nitrogen supply to achieve maximum sucrose yield (MSYNS) based on quadratic models were 212 and 219 kg ha-1, respectively.
The economic analysis in this study was based on a set sugar price formula at the time of the study and changing N prices. Changes in economic related variables from this data set are related to both N price and sugar price. The ratio of these prices will result in changes in the economic related variables. Based on USDA-Economic Re-search Service data, 2012 average N fertilizer price based on UAN and urea was $1.34/kg.
Economic Optimum Nitrogen Supply
The N prices used in this analysis cover a range encompassing current and estimated future prices. The EONS in 2008 over an N price range of $0.44 to $2.20 kg-1, ranged from 223 to 174 kg N ha-1. In 2010, the range was from 221 to 197 kg N ha-1over the same N Table 8.Coefficients for quadratic functions (y = y0+ ax + bx2)† applied to root yield and estimated recoverable sucrose (ERS) yield in 2008 and 2010. Results from 2009 are not included because there was no significant response to N.
Year y0 a b SE‡ R2§
2008 Root Yield 67.03 0.1139 -0.0004 1.20 0.93
ERS Yield 10324.6 18.42 -0.0772 192.6 0.92
2010 Root Yield 54.74 0.3013 -0.0009 2.29 0.98
ERS Yield 7308.6 48.01 -0.1509 241.3 0.99
† y = root yield or estimated recoverable sucrose yield; y
0= yield (kg
ha-1) at 0 kg applied N; a = constant; x = N rate (kg N ha-1); b= con-stant.
‡SE = Standard error of predicted root yield or estimated recoverable sucrose yield.


![Figure 2. Nitrogen recovery efficiency (fraction of total N supply inefficiency (fraction of total N supply in roots = kg root total N / kg Nplant (tops + roots) = kg plant total N (tops + roots) / kg N supply[fertilizer N + spring residual NO3-N and NH4-N]) and N removalsupply) versus N supply in 2008, 2009, and 2010.](https://thumb-us.123doks.com/thumbv2/123dok_us/9659695.1948592/21.612.68.357.160.588/nitrogen-recovery-efficiency-fraction-inefficiency-fertilizer-residual-removalsupply.webp)
