WTCost© - A Computerized Water Treatment Cost
Estimating Program
Irving Moch, Jr. and Michelle Chapman
1I. Moch & Associates, Inc., Wilmington, De Usa 2Us Bureau Of Reclamation, Denver, Co Usa
Darlene Steward, Boulder Research Enterprises, Boulder, Co Usa
Abstract
One of the many problems faced by end-users, consultants, contractors etc. when evaluating alternative water treatment options, is defining, with some accuracy, all of the capital and operating costs associated with a water treatment plant. The credibility of a planning estimate usually depends a great deal on the cost reports of operating facilities. However, the capacity requirements, water characteristics, and local conditions such as water intake, brine disposal options, land cost, electricity price, and labor rates for the contemplated facility rarely match conditions at an existing plant. These inconsistencies also make comparisons between alternative technologies (e.g. between reverse osmosis and multistage flash distillation) difficult.
To make a planning cost evaluation meaningful, it is desirable to have available a defined format. Such a format is, today, non-existent or highly fragmented. To create a comparative and planning standard means that cost estimates must include the same items and variable factors such as electricity, chemicals, labor, maintenance, equipment, and building costs, overheads, interest rates, and amortization period. In this way, estimates can be adjusted and evaluated on a common basis. One way of insuring that these criteria are met is to develop a computer model for process costs.
Such a model has been developed and is called WTCost©. This CD is designed for end-users, consultants, managers, and engineers. It permits the evaluation of water treatment processes employing reverse osmosis/nanofiltration (RO/NF), ion exchange (IX), electrodialysis/electrodialysis reversal (ED/EDR) and microfiltration/ultrafiltration (MF/UF). The program is supplier neutral.
Over 80 copies of WTCost© have been released to the field, domestic and international. Reports back have been quite positive. The program has provided consistent evaluations and reasonable values for plant costs. It is serving as a tool for estimating preliminary project costs, structuring project bid solicitations, comparing desalination options and normalizing capital and operating charges. The system is also being employed in research for evaluation and comparative studies and as a university teaching tool.
Introduction
The United States Bureau of Reclamation (Reclamation) has been developing a cost model for desalination and other water treatment processes for over the past ten years. Collaborators have been the US National Institute for Standards and Technology, I. Moch & Associates, Inc., the American Membrane Technology Association (AMTA), the Colorado School of Mines and the University of Houston. The objective of this program has been to develop an application for estimating and comparing the cost of water treatment technologies based on the local water analysis and desired capacity. Users input the plant parameters (e.g. cost of electricity, labor, water and materials such as steel and concrete), and variables required for sizing equipment, estimating labor requirements and evaluating costs. Default values for all variables are present, providing flexibility and applicability for those with varying levels of knowledge. The program to define these items is called WTCost© and it is being distributed on a CD ROM together with an explanatory user’s manual.
Using adjustable indices and variable inputs, the CD includes costs equations for estimating different pre and post treatment unit operations such as media filtration; coagulation and flocculation with PAC, alum, ferric chloride ferrous sulfate or polyelectrolyte; disinfection by chlorine, monocloramine, ozone and UV; lime/soda softening; electrical energy requirements, including energy recovery, and chemical consumptions and various intake and outfall infrastructures. A number of water compositions are suggested for those who do not have actual ion concentrations. Labor and supervision, membrane replacements, amortization rates and tanks, piping and instrumentation are also included, thus, permitting calculation of plant capital requirements and operating and maintenance costs.
WTCost© is to be expanded to include the capital and operating costs for plants using the four evaporative processes; MSF, MED, MVC and TVC in single and dual purpose applications. The fundamental equations already existing for pre and post treatment options, feed water intake, brine outfall, pumps, tanks, piping, instrumentation, etc. are fully suitable for the various thermal technologies under study. Technical and cost equations have to be developed for each application of the evaporative processes and these equations will be blended into the existing computer format in a seamless manner. Experts in the industry will be asked to evaluate the accuracy and consistency of the computer generated model against actual global tendered projects.
technologies are evaluated under a uniform set of conditions. The expanded WTCost© program would accomplish this task.
WTCost©
Treatment Processes
The WTCost© is a Visual Basic application that can run under Windows version 98 and later. The program calculates dose rates and cost estimates for the following water treatment processes and components:
Disinfection with chlorine, chloramine, ozone and ultra-violet irradiation De-chlorination with sodium bisulfite, sodium sulfite or sulfur dioxide pH adjustment with sulfuric or hydrochloric acid
Coagulation/flocculation with alum, poly-aluminum chloride (PAC), ferric chloride, ferrous sulfate or lime/soda using upflow solids contact clarifiers
Filtration enhancement with polyelectrolyte
Filtration with granular activated carbon and other granular media
Microfiltration and Ultrafiltration as pretreatment to remove particulate and biological materials
Antiscalant to prevent precipitation of sparingly soluble salts Reverse Osmosis and Nanofiltration for desalination
Electrodialysis Reversal and Ion Exchange as competitive processes. Energy Recovery for seawater desalting
Intake and outfall infrastructures
Post treatment of product water for disinfection and prevention of corrosion
The chemical process cost estimates are derived from the 1979 EPA report “Estimating Water Treatment Costs – Cost Curves Applicable to 1 to 200 mgd Treatment Plants.” Cost estimates for these processes include everything needed for that process as specified in the EPA document. Those costs were derived from actual costs for systems of four sizes. Cost curves were constructed from these four points using chemical feed requirements as the key cost parameter. WTCost uses the water analysis to estimate a dose for each chemical, in parallel, for use with the EPA cost curves. The program has been found to be within 10% – 20% of bids for plants ranging in size from 50,000 gallons per day to 100 million gallons per day (mgd). The chemical demand limits are specified on each page. If the user defines a facility too large, the chemical cost will be astronomical. There are some checks by the program to prevent using the cost curves if the demand is too high, but in the new edition, more restraints and work-rounds will be added.
Inputs
Primary required inputs are: Product capacity, Overall recovery rate, Percent of time on-line,
The water analysis.
[image:4.595.145.457.239.394.2]Design parameters used to drive the cost estimates are calculated from the water analysis and capacity. Indices from the Engineering News Record are used to update cost information for WTCost© to current dollars. Table 1 is a list of the indices and their value as of September, 2004. As the user progresses through each process selected for their facility, they will be prompted for specifics such as preferred chemical dose, media filtration rate, membrane productivity and rejection, and electrodialysis membrane specifics. Default values are offered, but if the user has specific information it will enhance the cost estimate accuracy.
Table 1: Cost Indices Used For Updating Costs.
Cost Indices Categories: September, 2004 ENR Construction Cost Index 7298.25
ENR Building Cost Index 4102.67
ENR Skilled Labor Index 6838.35
ENR Materials Index 2,431.37
ENR Steel Cost ($/cwt) 32.61
ENR Cement Cost ($/ton) 84.34
Electricity Cost ($/kWhr) 0.07
ENR Labor Rate ($/hr) 37.95
Interest Rate (%) 6
Amortization Time (years) 30
All ENR indices are from: http://www.enr.com/cost/cost2.asp, the rest are defaults.
Assumptions
Assumptions for each process are detailed in the user manual. The chemical processes assume that it will be constructed as designed for the EPA report and those are outlined in the manual. They include equipment for the process, but not a building. IX, ED/EDR, RO/NF, and UF/MF are designed from basic engineering principles. For instance RO cost is defined by the membrane productivity, osmotic pressure calculated from the average of feed and concentrate concentrations. Default values are suggested for the number of treatment trains, cost of membrane modules and pressure vessels, replacement rate, building cost and area, concentrate treatment and piping cost, site work, numbers of generators, staff, and numbers and types of pumps. The user may change any of these values to suit the project. Calculations associated with each of these inputs carry assumptions. These are documented in the user manual.
Program Flow
The program is a Visual Basic, windows based product similar to task boxes such as are used for installing new software or hardware. They have action buttons, navigation buttons, and text boxes for user input. Inputs are fed into visual basic functions to perform calculations and store values in the associated data base. The program starts with a simple screen offering six choices for opening projects, reviewing and adjusting the cost indices that will be used for the project and maintaining the database. From there the user is led from window to window with prompts for required input or acceptance of the default values.
data inputs are filled with default values. As the user progresses through defining the project, these are replaced with user inputs. If the user wishes to start a similar project, the initial project can be opened and renamed, thereby saving some trouble changing inputs.
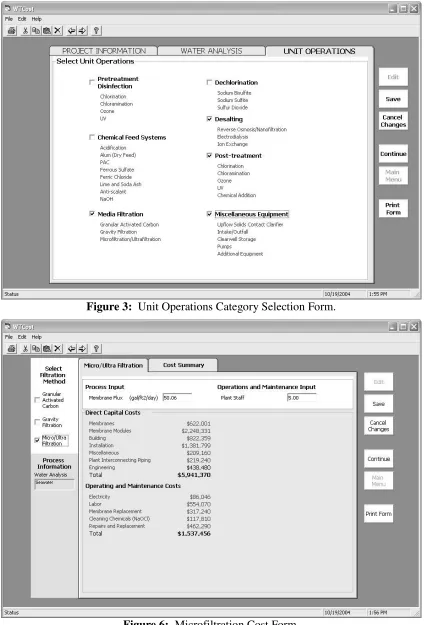
Water Analysis
The water analysis is important for determining product water composition for blending, calculating chemical dose rates, and sizing equipment. Figure 2 shows the water analysis page with calculated parameters at the bottom.
There is a data base of common water types stored in the program for use when an exact water analysis is not available. There are four levels of brackish ground water with TDS ranging from 905 mg/l to 11,802 mg/l. The seawater analysis also has a multiplier function for adjusting for seawater at higher or lower TDS levels to represent the Mediterranean seas and estuary sources. The user may also enter a new analysis which will then be available for future projects.
The Stiff and Davis Saturation Index (S&DSI) is reported for the water analyses with total dissolved solids (TDS) over 10,000 mg/L. For TDS below 10,000 mg/L, the Langelier Saturation Index (LSI) is shown. The value of either index is based on the feed water. For a desalting process, the saturation index for the concentrate will be calculated when the RO section has been completed, based on the recovery and rejection of the membrane chosen.
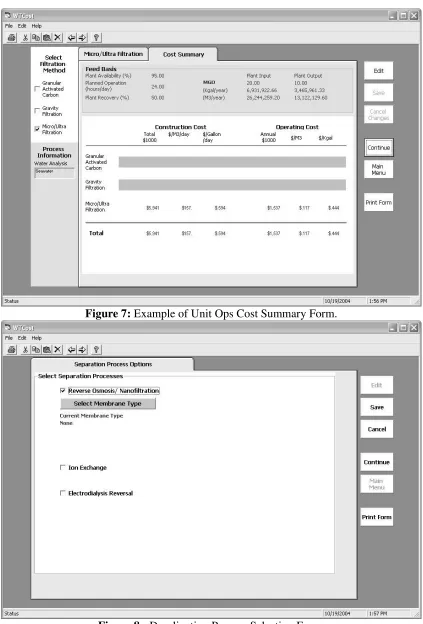
Unit Operations
Categories of unit operations are presented in the order they would be encountered in a process flow diagram. The user chooses the categories of operations to be included in the cost estimate prior to defining the exact unit operation. This saves time when only a particular part of the process is under consideration. Figure 3 shows the categories with the variety of unit operations available in each category. Each operation is sized for the flow expected at that point in the process. A cost summary sheet is presented for each category of unit operations with capital and O&M costs per year.
Indirect costs
When all the chosen unit operations have been defined, a project summary form is displayed to summarize processes and dose rates chosen for the project. Then indirect costs are calculated based on the summation of all the unit operation capital costs. There are four categories of indirect costs with default percentages of the total capital cost:
Interest during construction: 5%
Contingencies: 6%
Architectural and Engineering Costs, including project management: 10%
Working Capital: 4%
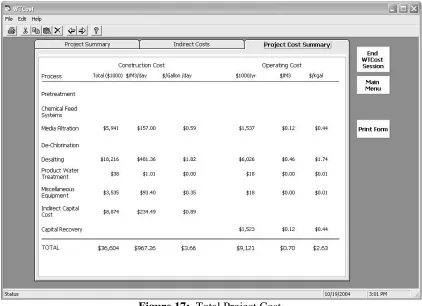
Finally the Project Cost Summary is displayed with construction cost itemized by unit operation category in Total USD, USD/m3/day and USD/gallon/day. Annual costs are given with
Example
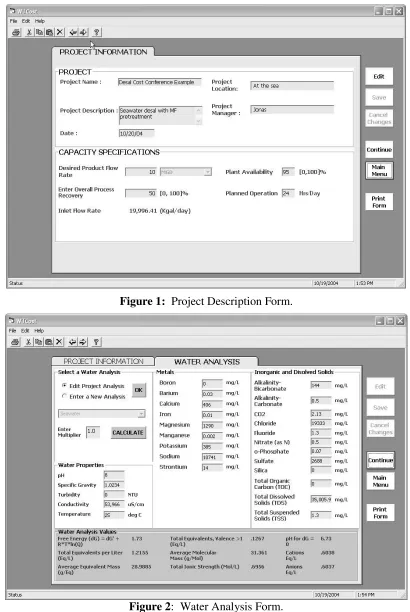
Figure 1: Project Description Form.
[image:6.595.107.510.420.724.2]Figure 3: Unit Operations Category Selection Form.
Figure 7: Example of Unit Ops Cost Summary Form.
Figure 9: Membrane Properties Form.
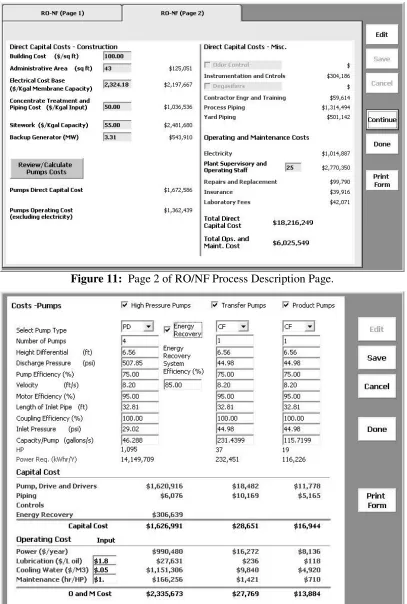
Figure 11: Page 2 of RO/NF Process Description Page.
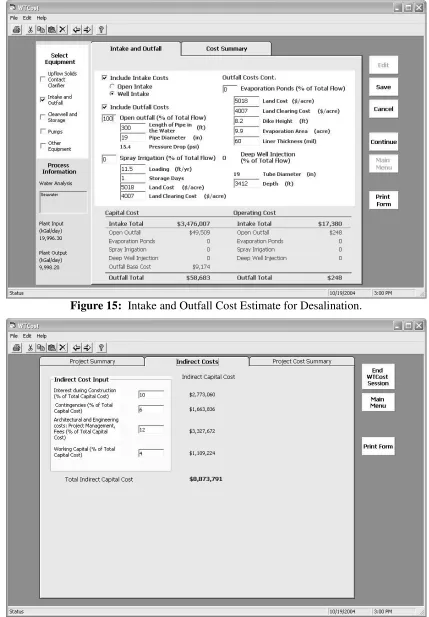
Figure 13: Desalination Cost Summary.
Figure 15: Intake and Outfall Cost Estimate for Desalination.
Figure 17: Total Project Cost. Conclusions
This computer program, Water Treatment Cost Estimation Program – WTCost©, has been developed to provide a simple method for estimating water treatment process costs and a Standard Desalination Cost – SDC format for evaluating water treatment projects as well as comparing the efficacy of different processing techniques. The model is a costing system, not a design tool. The program was put together under the auspices of the United States Bureau of Reclamation, Denver Colorado; I. Moch & Associates, Inc., Wilmington Delaware, and Boulder Research Enterprises Inc., Boulder Colorado. Easy to access windows are employed, where data, if known, can be readily input and, if unknown, default values are available for use. This program, also sponsored by the American Membrane Technology Association (AMTA), has been issued to over 80 individuals and companies and been found to be reasonably accurate versus actual projects tendered in the last few years. It has been employed as a comparative, diagnostic and teaching tool throughout the world.
References
EPA. 1979. “Estimating Water Treatment Costs – Cost Curves Applicable to 1 to 200 mgd Water) User Manual.” Treatment Plants.” EPA-600/2-79-162b. August 1979.
Chapman-Wilbert, M. 1993. The Desalination and Water Treatment Membrane Manual. US Bureau of Reclamation Report R-93-15.
Degrémont. 1991. Water Treatment Handbook. 7 Degrémont, 1991. Engineering News Record. 3/28/94, p 40 & 49.
Elarde, J.R. and R.A. Bergman. “The Cost of Membrane Filtration for Municipal Water Supplies” AWWA Membrane Conference Proceedings, 2001.
Glase, William H. A Chemical Oxidation, @ Chapter 12 in Water Quality and Treatment - A Handbook of Community Water Supplies, 4th edition, American Water Works Association, McGraw Hill Inc., New York, NY, 1990.
Gumerman, R.C., R.L. Culp, & S.P. Hansen. 1979. Estimating Water Treatment Costs, Vol.
2, Cost Curves Applicable to 200 mgd Treatment Plants. EPA-600/2-79-1626, August 1979.
Karassik, I.J., W.C. Krutzch, W. H. Fraser, and J. P. Messina. Pump Handbook. McGraw-hill, Inc., 1976
Mickley M.C. Membrane Concentrate Disposal: Practices and Regulation. USBR Desalination & Water Purifications Research and Development Program Report No. 69. 2001
Moch, I. A 21st Century Study of Global Seawater Reverse Osmosis Operating and Capital Costs. Presented at the 2002 International Desalting Association Conference in Bahrain, 3/2002.
Moch, I., Wilbert, M. C. and Steward, D., “Standardized Format for Calculating Membrane Water Costs”, Annual Conference and Exposition, American Water Works Association, Washington, D. C., June 17-21, 2001.
Moch, I., Chapman, M. and Steward, D., “Development of a CD-ROM Cost Program For Water Treatment Projects,” American Membrane Technology Association Biennial Conference and Exposition, Tampa, FL, August 6-9, 2002.
Moch, I., Chapman, M. and Steward, D., “Standardizing Membrane Water Costs,” Membrane Technology Conference and Exposition, 2003, AWWA, Atlanta GA, March 2-5, 2003.
Peters, M.S. & K.D. Timmerhaus. 1980. Plant Design and Economics for Chemical
Engineers. McGraw-Hill Book Company
Pittner, G.A. 1993. The Economics of Desalination Processes. Chapter in Membrane
Technology, Water Chemistry, and Industrial Applications. Zahid Amjad ed. Van Nostrand
Reinhold, NY.
Qasim, S.R., S.W. Lim, E.M. Motley & K.G. Heung. 1992. Estimating Costs for Treatment Plant Construction. J. AWWA, pp 57-62, Aug. 1992
Ray, R. 1992. RO Cost Estimates. in Membrane Handbook. Ho and Sirkar, Eds. Snoeyink, V.L. & D. Jenkins. 1980. Water Chemistry. 7 1980 John Wiley & Sons.
Suratt, William B., Camp Dresser & McKee, Inc., Estimating the Cost of Membrane (RO or NF) Water Treatment Plants, Technical paper presented at the 1995 AWWA membrane Technology Conference, Reno, NV, August 13, 1995.
Wolfe, T.D., 1993. Electrodialysis Design Approaches. AWWA Proceedings; 1993
Membrane Technology Conference, August 1-4, 1993, Baltimore, MD AWWA, WTCost©, A