Ames Laboratory Publications
Ames Laboratory
4-1-2012
Structural properties and relative stability of
(meta)stable ordered, partially ordered, and
disordered Al-Li alloy phases
Aftab Alam
Ames Laboratory
Duane D. Johnson
Iowa State University, [email protected]
Follow this and additional works at:
http://lib.dr.iastate.edu/ameslab_pubs
Part of the
Condensed Matter Physics Commons
,
Engineering Physics Commons
, and the
Metallurgy Commons
The complete bibliographic information for this item can be found at
http://lib.dr.iastate.edu/
ameslab_pubs/285
. For information on how to cite this item, please visit
http://lib.dr.iastate.edu/
howtocite.html
.
Structural properties and relative stability of (meta)stable ordered, partially
ordered, and disordered Al-Li alloy phases
Abstract
We resolve issues that have plagued reliable prediction of relative phase stability for solid solutions and
compounds. Due to its commercially important phase diagram, we showcase the Al-Li system because
historically density-functional theory (DFT) results show large scatter and limited success in predicting the
structural properties and stability of solid solutions relative to ordered compounds. Using recent advances in
an optimal basis-set representation of the topology of electronic charge density (and, hence, atomic size), we
present DFT results that agree reasonably well with all known experimental data for the structural properties
and formation energies of ordered, off-stoichiometric partially ordered, and disordered alloys, opening the
way for reliable study in complex alloys.
Keywords
Materials Science and Engineering
Disciplines
Condensed Matter Physics | Engineering Physics | Metallurgy
Comments
This article is from Phys. Rev. B
85
, 144202 (2012), doi:http://dx.doi.org/
10.1103/PhysRevB.85.144202
.
PHYSICAL REVIEW B85, 144202 (2012)
Structural properties and relative stability of (meta)stable ordered, partially ordered,
and disordered Al-Li alloy phases
Aftab Alam1,*and D. D. Johnson1,2,†
1Ames Laboratory, U.S. Department of Energy, Ames, IA, 50011-3020
2Department of Materials Science & Engineering, Iowa State University, Ames, Iowa 50011
(Received 8 February 2012; published 11 April 2012)
We resolve issues that have plagued reliable prediction of relative phase stability for solid solutions and compounds. Due to its commercially important phase diagram, we showcase the Al-Li system because historically density-functional theory (DFT) results show large scatter and limited success in predicting the structural properties and stability of solid solutions relative to ordered compounds. Using recent advances in an optimal basis-set representation of the topology of electronic charge density (and, hence, atomic size), we present DFT results that agree reasonably well with all known experimental data for the structural properties and formation energies of ordered, off-stoichiometric partially ordered, and disordered alloys, opening the way for reliable study in complex alloys.
DOI:10.1103/PhysRevB.85.144202 PACS number(s): 71.15.−m, 71.23.−k, 61.66.Dk, 64.60.Cn
I. INTRODUCTION
Predicting alloy composition-temperature (xvsT) phase diagrams has important practical implications, and much progress has been made in the last decade via ab initio study of phase stability. Such predictions are a sensitive test as the relative stability of metallic alloys depend on small enthalpy differences. Notably, the order-disorder temperature of a superstructure is related to the difference between the formation enthalpy of the compound AlmLin[x =n/(n+m)] and mixing enthalpy1of disordered Al
1−xLixalloy at the same compositionx(Ref.2). Historically, density-functional theory (DFT) results were sensitive to basis sets and approximations,3 especially comparing ordering and mixing enthalpies from different codes.4 In particular, representations of charge
densities are critical, especially for solid solutions, where former “bad” results were not due, as often proposed, to the approximation to the disordered state.5 How the disordered
phases is addressed remains an ongoing issue, such as the longstanding discrepancies between approximations to partially ordered (off-stoichiometric and thermal antisites6)
and disordered phases, for example, the coherent-potential approximation3,6–8(CPA), special quasirandom structures3,9,10
(SQSs), and cluster expansions3,11–13(CEs).
Al-Li alloys, with their unusual elastic and structural properties and commercial importance, have been the focus of many theoretical and experimental studies. With doping to initiate precipitate growth in grains or grain boundaries, they are suitable materials for aerospace and automobile applications, due to their low density, high elastic modulus, and high strength-to-weight ratio. Between the stable end points of A1-Al (fcc) and A2-Li (bcc), numerous structural phases exist or compete,14 for example, the stable β AlLi (B32),
rhombohedral Al2Li3 (C33), monoclinic Al4Li9(B2/m), and metastable (off-stoichiometric) δ-Al3Li (L12). Theβ AlLi, for example, is a promising candidate as an anodic material in high-energy density batteries; δ, which appears in the miscibility gap between Al and β, is used to precipitation harden commercial alloys.15–17 Substituting Li for Al not
only makes the alloy less dense but increases unexpectedly the elastic moduli,18even though the Young’s modulus of Li
(14 GPa) is seven times smaller than that of Al (91 GPa). Also, the valence density leads to a bulk modulus of Al (83 GPa) five times larger than that of Li (15 GPa), giving rise to a sensitivity to basis sets if density is not represented properly.5
Comparing reliably properties of all competing phases in alloys is critical, and Al-Li is a sensitive, sufficiently complex, and yet unresolved case. While there are some successes in describing the relative stability of the Al-Li ordered phases,19–21 a reliable description for the disordered and partially ordered phases is lacking. For Al-Li disordered phases, the virtual crystal approximation (VCA),22CPA,23and
CE methods11,12 have been used to describe thex-dependent
equilibrium volume and formation enthalpies, but quantitative prediction of the lattice constants and mixing enthalpy remains a problem.
Using an optimal site-centered basis for density and potentials,5 we presentab initioDFT calculations that
com-pare reliably the phase stability (formation enthalpies) of competing ordered, partially ordered, and disordered phases, and quantitatively reproduce (without adjustable parameters) the unusual alloying effects, including the lattice constants, that is, a vs x, ill-described in the past. We also estimate the impurity formation energies at x0 and 1 (i.e., the solution enthalpies) of the A1-Al1−xLix, a sensitive quantity due to differing electronic nature of Al and Li. For general configurations, we describe more properly the topology of electronic charge density, and hence atomic size, charge, and alloying effects, especially in random alloys,2,5,24 crucial in
Al-Li for a reliable investigation of (meta)stable phases.5
We also resolve longstanding disagreements between various estimates of disordered energetics, for example, CPA7,8 and SQS.3 To showcase the predictive accuracy, we compare
and contrast our results to experimental data and those from linear augmented plane wave (LAPW),19augmented spherical
wave (ASW),20linear muffin-tin orbital (LMTO) methods, and
atomic sphere approximation (ASA).
II. COMPUTATIONAL DETAILS
We use a Korringa-Kohn-Rostoker (KKR) CPA code25
based on a weighted Voronoi polyhedra (VP)26 basis defined
144202-1
AFTAB ALAM AND D. D. JOHNSON PHYSICAL REVIEW B85, 144202 (2012)
from saddle-point radii (SPR) in the charge density.5 With
this optimal basis set, a proper representation of the topology of charge density and hence atomic sizes yields energy differences insensitive to basis-setLtruncation.2,5
We include s-, p-, d-, and f-symmetries in the KKR Green’s functions spherical harmonic basis, which is truncated atLmax=3, whereL≡(l,m). Energy integration of Green’s functions use a complex-energy Gauss-Chebyshev semicircu-lar contour with 18 points. The Brillioun zone integrations use the Monkhorst and Pack27 specialk-point method using
a 20×20×20 mesh. We use the von Barth-Hedin28 local
density approximation (LDA) as parameterized by Moruzzi, Janak, and Williams.29 For random alloys, the screened CPA8 is used to incorporate metallic screening from charge
correlations in the local chemical environment. More details are given elsewhere.2,5,24
The lattice constants of the elemental Al and Li, A1 Al-Li, and B32 phases were calculated for comparison to experiment, as were the metastable phases, such as L10. The relaxation effects on some of the less symmetric structures are mostly small, as noted in text.
The potential zero, that is,muffin-tin zerov0, can dramati-cally affect stability prediction for spherical potentials. We use a variational definition (Xstands for VP or ASA),
vX0 =
s
X
MT drρsFP(r)VsFP(r)
s X
MTdrρsFP(r)
, (1)
with a sum over all sites in a unit cell. We spherically average functions over the solid angle (d=dθ dφ) within|r|RCS, the maximal region required in a site-centered method. We then accurately integrate over the interstitial region of arbitrary VP (full shape) via isoparametric integration,26 which is fast with error controllable to machine precision. We note that approximations to Eq.(1)reproduce various well-known simplified expressions used for decades, such as the muffin-tin and ASA cases, but these lead to poorer results generally.
The total energies can be evaluated using weighted VPs, denoted by KKR-CPA(VP), or weighted VPs approximated by unequal ASA spheres, denoted by KKR-CPA(ASA). For comparison, we also provide equal ASA sphere results, often used in other ASA-based codes. Definition(1)yields kinetic energies that approach those of LAPW.19 For ordered and
disordered (i.e., CPA and SQS) results, we find significantly improved predictions using optimal SPR basis within each VP, in combination with the v0VP, even if the remainder of the calculations is based on ASA, as exemplified for Al-Li. The CPA is applicable to an arbitraryx (solid solutions and partially ordered states2), and configurational averages can be
improved, for example, by dynamical cluster approximation.30
III. RESULTS
We report formation and mixing enthalpies (Ef), im-purity formation (or solution) energies (Eimpx ), and lattice constant (a) changes versus composition (x). We address the critical charge representation in electronic-structure methods to make predictions from various theoretical techniques more consistent. For Al-Li, comparing to experimental data should be done with care, as the literature contains large scatter in
various values. It is also well known that there is a Li deficiency that extends 0.3 mm into the bulk from the surface in Al-Li alloys.31Hence, experiments affected by this deficient region
will not provide reliable data versusx.
A. (Dis)ordered formation energies
Our results will clearly demonstrate that KKR-CPA(VP) correctly predicts the stability of ordered, disordered, and partially ordered phase all within the same fast code.25In Fig.1
(bottom panel) we show theEfversusxfor ordered AlmLin [x=n/(n+m)] and disordered Al1−xLix alloys. Selected values of the results are provided in TableIand compared with LAPW and available experimental data, as well as ASA results, such as from linear and exact33MTO (EMTO) methods.
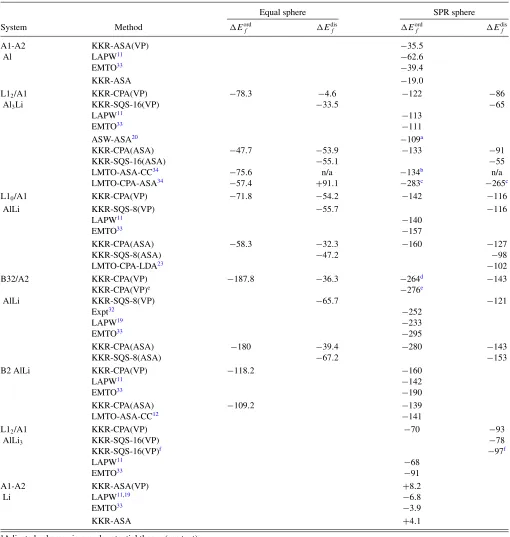
Importantly, using an SPR optimal basis and Eq.(1), the KKR-CPA(VP) results for compounds are now in excellent agreement with LAPW results19 and measured data.32 For
example, the measuredEB32
f is −252±10 meV and our optimal-basis KKR(VP) result is−264 meV (−276 meV) at
0 0.02 0.04 0.06 0.08 0.1
-50 -40 -30 -20 -10 0
0.9 0.92 0.94 0.96 0.98 1
0
-10
-20
-30
-40
0 0.2 0.4 0.6 0.8 1
Concentration of Li (x) 40 0 -40 -80 -120 -160 -200 -240 -280
Δ
E (meV/atom)
f
ΔE = -244 meVimp
Al in Li
Δ
E = -82 meV Li in Alimp A1 bcc B32 B2 L10 2 L1 bcc
C33 (Al Li ) B2/m(Al Li )
2 4
3 9 L12
FIG. 1. (Color online) (Bottom)Ef (meV/atom) vsx of A1
Al1−xLix, and various fcc- and bcc-based compounds. KKR [LAPW
(Ref.19)] results are solid (open) symbols; B32 experiment (Ref.32) (∗); A1 phase (solid curve); ground-state hull (dashed lines); and Al-rich (off-stoichiometric) L12(pluses). Impurity formation energy
Eimp(meV/atom) is from a limit of a fit toEf (middle) Al in Li
(0.9< x <1.0) and (top) Li in Al (0< x <0.1), values indicated in figure.
[image:4.608.317.555.311.658.2]STRUCTURAL PROPERTIES AND RELATIVE STABILITY. . . PHYSICAL REVIEW B85, 144202 (2012)
TABLE I. Ef (in meV/atom) for (dis)ordered alloys with equal and weighted-SPR-VP spheres relative to elements in same phase, using
the variationalv0[Eq.(1)]. CPA and SQS results are from this work. CC denotes combined corrections. Other results are also given.
Equal sphere SPR sphere
System Method Eordf Edisf Eordf Edisf
A1-A2 KKR-ASA(VP) −35.5
Al LAPW11 −62.6
EMTO33 −39.4
KKR-ASA −19.0
L12/A1 KKR-CPA(VP) −78.3 −4.6 −122 −86
Al3Li KKR-SQS-16(VP) −33.5 −65
LAPW11 −113
EMTO33 −111
ASW-ASA20 −109a
KKR-CPA(ASA) −47.7 −53.9 −133 −91
KKR-SQS-16(ASA) −55.1 −55
LMTO-ASA-CC34 −75.6 n/a −134b n/a
LMTO-CPA-ASA34 −57.4 +91.1 −283c −265c
L10/A1 KKR-CPA(VP) −71.8 −54.2 −142 −116
AlLi KKR-SQS-8(VP) −55.7 −116
LAPW11 −140
EMTO33 −157
KKR-CPA(ASA) −58.3 −32.3 −160 −127
KKR-SQS-8(ASA) −47.2 −98
LMTO-CPA-LDA23 −102
B32/A2 KKR-CPA(VP) −187.8 −36.3 −264d −143
KKR-CPA(VP)e −276e
AlLi KKR-SQS-8(VP) −65.7 −121
Expt32 −252
LAPW19 −233
EMTO33 −295
KKR-CPA(ASA) −180 −39.4 −280 −143
KKR-SQS-8(ASA) −67.2 −153
B2 AlLi KKR-CPA(VP) −118.2 −160
LAPW11 −142
EMTO33 −190
KKR-CPA(ASA) −109.2 −139
LMTO-ASA-CC12 −141
L12/A1 KKR-CPA(VP) −70 −93
AlLi3 KKR-SQS-16(VP) −78
KKR-SQS-16(VP)f −97f
LAPW11 −68
EMTO33 −91
A1-A2 KKR-ASA(VP) +8.2
Li LAPW11,19 −6.8
EMTO33 −3.9
KKR-ASA +4.1
aAdjusted spheres via pseudopotential theory (see text). bCharge-neutral, adjusted spheres with CC andL
max=2. cCharge-neutral, adjusted spheres withL
max=2. dUsing experimental lattice parameters at 300 K. eUsing theory minimized lattice parameters at 0 K. fIncludes relaxation of SQS-16 from Ref.4(see text).
the experimental 300 Ka=6.369 ˚A (0 K theorya=6.276 ˚A) lattice constant, while LAPW finds −232 meV. (The 0 K experimental a will agree better with theory, as is typical.) For metastable L10AlLi,E
L10
f is−142 meV for KKR(VP)
and−140 meV for LAPW; both a andcat 0 K are within 1.4% compared to experimental values at 300 K, but again experiment would be closer to theory if extrapolated to 0 K.
EfB2 for metastable B2 (CsCl) phase, predicted to exist at
AFTAB ALAM AND D. D. JOHNSON PHYSICAL REVIEW B85, 144202 (2012)
high pressure,12is−160 meV for KKR(VP) and−142 meV
for LAPW.
The KKR-CPA mixing enthalpyHfA1(x) for disordered fcc Al-Li is shown by the solid (red) curve in Fig.1. Generally, in phase diagram assessments, the solid-solution enthalpy of a fixed phase is fitted to a polynomial inx, such as
HfA1(x)= m,n
Lmnxm(1−x)n ∀(m+n)4, (2)
where Lmn are the polynomial coefficients. For A1 Al-Li, the asymmetry in the HA1
f (x) in Fig. 1 arises from the Madelung contributions to the total energy, which is proportional to (Qi)2, the effective charge on a site, which also has a corresponding asymmetrical form as a function of
x. Therefore, site charge is an important quantity in Al-Li, and a proper description of charge density and the corresponding transfer effect is necessary, as is discussed below.
1. (Off)stoichiometric Al-rich L12
The observed miscibility16 of L1
2-Al3Li with respect to A1-Al and B32-AlLi is reproduced. Indeed, the segregation line between pure Al and B32 sits at −132 meV at 25% Li, whereas L12 is −122 meV, that is, barely unstable but a very low-energy excitation; and, concomitantly, the stability of L12-Al3Li relative to A1-Al0.75Li0.25 yields the observed L12precipitation within theα(Al)+βtwo-phase field.16L12 remains metastable as free energies of the competing ordered phases change little because their order is near perfect, whereas that of the Al-rich disordered phase decreases rapidly due to the increasing solubility of Li and the increasing configurational entropy.
This argument can be supported by looking at the energetics for Al-rich, off-stoichiometric L12, shown as plus symbol in the lower panel of Fig. 1, where the excess Al goes only to a Li corner-site and the three Al face sites remain fully occupied by Al. These data indicate that a partially disordered arrangement on the Al-rich side is more stable than the A1 phase, and, by comparing to the ground-state hull, slightly more favorable than α(Al)+β alone. Based only on 0 K enthalpy differences, we directly predict a higher stability of off-stoichiometric L12 between 8% and 20% Li with a peak at∼15%, as observed17 for the δ(Al
3Li) precipitates, where it undergoes a transformation toα(Al)+δ(AlLi) state at∼618 K.17 At the 15% peak, we estimated the maximum order-disorder temperature fromEA1−δ(L12)
f as 581 K. Also, at perfect stoichiometryEA1-L12
f is 42 meV (or 488 K) and it compares well with the 522 K obtained via a much more involved CE fit using LAPW results.11 These theory results
should be compared to the measured eutectic temperature (869 K), showing that the liquid free energy is more favorable than the two-phase and homogeneous solid solution.
2. CPA vs SQS
For completeness, we compare the CPA to the SQS, within the same code and approximations. The SQS is an ordered cell meant to approximate the two-site atomic correlations of a random alloy to a small cutoff, but it does not include configurational averaging as in the CPA, except as offered by
the limited number of inequivalent sites within the ordered local environments. In Table I, we compared our SQS and CPA results at 25% and 75% (a 16-atom cell10) and at 50% (an
average of two 8-atom configurations,9one state having large
positive formation energy and the other negative, as is typical). They agree from 2% to 20% depending on compositionx, but only if the SPR basis is used for both, as can be verified in TableI; both CPA and SQS are sensitive to basis representation but agree reasonably well within the optimal SPR basis, especially if larger SQS cells are used to improve the effective configurational average (see fcc 50% case, e.g., in TableI, where VP results show much improved agreement). Also, for the SQS-AlLi3, relaxation of this ordered cell (an approximate to the disordered phase) leads to a decrease4 of energy by
19 meV, which improves the SQS agreement with the CPA (see TableI), where SQS formation energy becomes−97 meV (i.e., −19−78 meV) compared to CPA’s−93 meV. The SQS-Al3Li relaxation is relatively small,1 meV.
B. Impurity formation energies
We now address the solution enthalpy (or impurity forma-tion energy), a more sensitive quantity to the approximaforma-tions used, because they are related to the slope of the formation energy in the impurity limits. In the top and middle panels of Fig. 1, we show Ef vs x for A1 phase in the two extreme limits (0x0.1 and 0.9x1.0). The solution enthalpy must be determined from Eq.(2)using two restricted fits in the limits, that is, for B in A (0x 0.1) and vice versa (0.9x1.0),
Efx→0(1) =
m,n
Lxmn→0(1)xm(1−x)n,
EimpB in A=
∂
∂xE
x→0 f
x=0
, (3)
EimpA in B= −
∂
∂xE
x→1 f
x=1
,
whereLxmn→0(1)are the restricted fitting coefficients. The slopes at each end point are very different from one another and cannot be reliably extracted by a polynomial fit for allxfrom Eq.(2), as typically done.
Using Eq.(3)and our KKR-CPA(VP) results, ourELi in Al imp is−244 meV/atom andEimpAl in Liis−82 meV/atom. A ther-modynamic fit to experimental data usingCALPHADyields35
−222 meV/atom for ELi in Al
imp and −154 meV/atom for
EAl in Li
imp . Our present results now agree much better with this one set of estimated experimental data, where notably only the Al-rich side has A1 measured data. In the Li-rich end, by using the CPA results in the impurity limit, the relaxation effect of a single Al impurity around Li is not taken into account. A small increase in the magnitude of our calculatedEAl in Li
imp , will improve our results versusCALPHAD, as also suggested by
the SQS results with larger relaxation at Li-rich end.
Midownik36has shown, however, that phase diagram fitting
is not always able to predict structural energy differences accurately; hence, there is significant variation in the literature. For example, for Li in Al and Al in Li, otherCALPHAD fits
yield−131 meV/atom and+972 meV/atom,37 respectively,
STRUCTURAL PROPERTIES AND RELATIVE STABILITY. . . PHYSICAL REVIEW B85, 144202 (2012)
the later being unphysical; and, another CALPHAD fit yields −954 meV/atom and−130 meV/atom,38respectively, giving a phase diagram not in very good agreement with the experiment.35
Other theory results are in quantitative disagreement to experiment and the present results; for example, previous SQS results forEimpLi in Alfind−309 meV/atom, and cluster expansions yields −353 meV/atom, while former equal-sphere CPA results give−358 meV/atom.4All previous values
were consistent, but none were obtained from proper impurity limit. Discrepancies between results of the various electronic-structure based methods (CPA, CE, SQS, etc.) have been ex-plained using Al-Ag alloys as case study,3where charge issues were not significant, whereas for Al-Li the charge representa-tion is crucial, as noted for “big-atom/small-atom” alloys.2,26
C. Lattice constants
The minimized a vs x for A1 Al1−xLix (solid curve) is shown in Fig.2, as well as that for bulk L12 Al3Li (square), with dilute limit slope added (dashed line) reproducing the well-known strong deviation to Vegard’s rule (dot-dashed line). Although the atomic volume of Li is 20% larger than that of Al, addition of Li to Al initially causes a contraction of
a vs x, which we also find in quantitative agreement with experiment.16,40,42 Various experimental a’s reported16,40–42
are indicated by symbols, including Al-rich A1 andδ(Al3Li) precipitates. First, our calculated a for pure Al at 0 K is in agreement with experiment.39 Our results do not include
thermal expansion effects, which are in room-temperature measurements, explaining the−0.7% difference in calculated results. Experimentally,16aforδ(Al
3Li) at RT shrinks by 1% compared to pure Al (see Fig.2), and we find a reduction of 1.25% at 0 K, in agreement with experiment (accounting for thermal expansion makes the agreement even closer). Finally, a very sensitive measure is the slope of theavsxcurve near Al, which is measured40,42,43 to be−2.9 to−6.9×10⁻⁵ nm per
0 0.25 0.5 0.75 1.0
x (Atomic %) 3.9
4.0 4.1 4.2
Lattice constant ( A )
This work (A1) This work (L1 ) Expt (@ 0 K) Expt ( (Al Li)) Expt1 (A1 @ RT) Expt2 (A1 @ RT) Pseudo-pot. calc.
Al Li
o
Vegard’s Rule 3
2
δ
`
FIG. 2. (Color online) KKR-CPA(VP)avsx for A1-Al1−xLix
[solid (red) curve], compared to other data, includingaAl expt at 0 K
(Ref. 39) aA1
expt from room temperature (RT) measurements [down
(Ref. 40) and up (Refs. 41 and 42) triangles].aexpt for δ(Al3Li)
precipitate at 523 K [∗(Ref.16)]. Also shown are pseudopotential results via first-order perturbation theory (open circles).20
at.% Li and at 300 K. The FLAPW impurity doping results11
give−5.1×10⁻⁵nm per at.% Li. Using the CPA at 0 K, we find it to be−11×10−5nm per at.% Li.
D. ASA vs VP
For completeness, we provide the energetics from a wholly ASA implementation, including withv0ASAin Eq.(1)evaluated using ASA spherical (not VP) integrals, denote as KKR-CPA(ASA). Moreover, to better understand the sensitivity of the effective charge and Madelung energy, the calculations are done in two different ways: (1) standard equal atomic size (sphere or VP) for both Al and Li atoms (as done in many calculations) and (2) adjusting the sizes of each site by a weighted VP from the SPR found in a given environment.5
From Table I, the SPR basis yields significantly improved energetics (especially compared to equal sphere ASA case) for both ordered and disordered phases, and eliminates the basis-set dependence for energy difference.5 For instance, the SPR KKR-ASA result for ordered L12-Al3Li EfL12 is −133 meV/atom and it is in dramatic contrast to the equal-sphere KKR-ASA result of −47.7 meV/atom. Improving the SPR-ASA basis using vVP0 and VP integrations [i.e., KKR-CPA(VP)] yieldsEL12
f = −122 meV/atom, in better agreement with−113 meV/atom from LAPW.19
E. Charge representations
The phase stability and the bonding characteristics of the Al-Li alloys can be understood by looking at distribution of valence charge around each atom. A characteristic of this compound is that Li-atom redistributes some of its valence electron in between the Al bonds and the resultant strengthened Al bonds stabilize the compounds. The charge density topology in the Li-rich compounds is more crucial in stabilizing a particular phase.
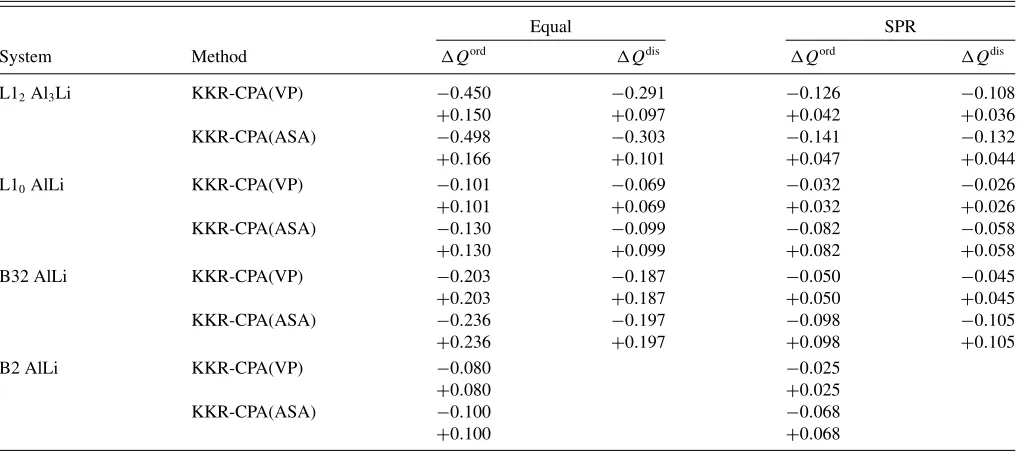
In TableII, the calculated local excess charges are provided within ASA and weighted VP for some ordered and disordered phases. The corresponding inscribed sphere (MT) and the ASA radii are given in TableIII. From TableII, it is clear that there is a significant “charge transfer” from Li to Al for both ordered and disordered phases, as expected from electronegativity, where Al (1.61) is larger than Li (0.98). The excess (deficit) SPR-VP site charges from the KKR-CPA(VP), as expected, reflect a better charge neutrality than the SPR-ASA site charges more approximate KKR-CPA(ASA). The KKR-CPA(VP) thus provides an improved estimate of the chemical potential and energetics, as shown, as well as charge effect due to the more proper charge density representation. In a VP-based calculation, Madelung contribution to the total energy, as compared to an ASA, is minimized.
For the optimal SPR basis, the inscribed sphere reflects more appropriately the extent of the charge density on an atomic site, and hence a more reliable estimate of site charges; also the case for the unequal SPR-ASA results, but the energetics are sensitive to VP integrations. For example, in AlLi for the SPR-VP basis, the excess (deficit) charge on Al (Li) remains almost unchanged for A2 and B32 phases (with only 0.005e−exchanged to Li from Al), whereas for the
[image:7.608.53.295.511.679.2]AFTAB ALAM AND D. D. JOHNSON PHYSICAL REVIEW B85, 144202 (2012)
TABLE II. Excess charges for equal and weighted SPR of Li (first line) and Al (second line) atoms in (dis)ordered Al-Li.
Equal SPR
System Method Qord Qdis Qord Qdis
L12Al3Li KKR-CPA(VP) −0.450 −0.291 −0.126 −0.108
+0.150 +0.097 +0.042 +0.036
KKR-CPA(ASA) −0.498 −0.303 −0.141 −0.132
+0.166 +0.101 +0.047 +0.044
L10AlLi KKR-CPA(VP) −0.101 −0.069 −0.032 −0.026
+0.101 +0.069 +0.032 +0.026
KKR-CPA(ASA) −0.130 −0.099 −0.082 −0.058
+0.130 +0.099 +0.082 +0.058
B32 AlLi KKR-CPA(VP) −0.203 −0.187 −0.050 −0.045
+0.203 +0.187 +0.050 +0.045
KKR-CPA(ASA) −0.236 −0.197 −0.098 −0.105
+0.236 +0.197 +0.098 +0.105
B2 AlLi KKR-CPA(VP) −0.080 −0.025
+0.080 +0.025
KKR-CPA(ASA) −0.100 −0.068
+0.100 +0.068
SPR-ASA sphere the charge remains small but is double that of the VP result.
For the equal-sphere ASA results, however, there is an unphysical deficit charge on the smaller atom (Li) from the improperly described tails of the charge density of larger atom (Al), which have been arbitrarily cut off at the smaller radii (hence, the dependence upon charge representation of the basis set we discussed). The equal sphere results are unphysical, and the large charge exchange significantly impacts the total energy results (see discussion in Sec.IV), which is also responsible for the enormous variation in past DFT results.
IV. DISCUSSION
Unlike other arbitrary (or unphysical) choices of charge density representation and basis set, the present SPR-based basis (weighted VP or ASA spheres) provides a unique, physics-based optimal representation of the charge topology for each atom type in a given environment. This new basis re-flects more properly the electronegativity (“charge transfer”), reduces the overlap error for ASA, and is valid for both ordered
TABLE III. Saddle-point based inscribed sphere MT and ASA radii (in ˚A) for Al and Li atoms in (dis)ordered Al-Li.
MT radius ASA radius System Atom Rord
MT R
dis
MT R
ord
ASA R
dis ASA
L12Al3Li Al 1.456 1.446 1.606 1.600
Li 1.288 1.312 1.458 1.481 L10AlLi Al 1.484 1.467 1.639 1.627
Li 1.326 1.337 1.498 1.513 B32 AlLi Al 1.418 1.417 1.602 1.613 Li 1.299 1.295 1.499 1.509 B2 AlLi Al 1.457 1.645
Li 1.253 1.472
and disordered alloys, that is, CPA and SQS approximations. For the sensitive case of Al-Li this has been demonstrated, which permits direct calculation of fully ordered, partially ordered, and disordered alloys, as recently shown for the quantum criticality in the doped, intermetallic NbFe2,24 and magnetic-storage alloys.2
Previously, Masuda-Jindo and Terakura20 applied
pseudo-potential-based, first-order perturbation theory44 to reveal a contraction inaversusxfor Al-rich solid solutions, similar to experiment, which deviates from a simple Vegard’s rule due to effects from bulk moduli and atomic volumes. They derived a relation for a mean ASA radii versusxfor the alloy, which was then used to perform a KKR-ASW study20 of solid-solution hardening and softening using only ordered structures (Al7Li and Al3Li). For L12-Al3Li they found a decrease ofaby 1.5% compared to pure Al. In light of our present results, their adjustments to the ASA radii better reflect the electron density and “charge transfer,” in agreement with our SPR-based VP and ASA.
Korzhavyi et al.23 performed LMTO-CPA-ASA
calcula-tions for the random alloy using charge correccalcula-tions (similar to the scr-CPA) with an adjustable parameter anda posteriori correction for apparent charge transfer given by their choice of ASA spheres. Only then did they find that theaversusx and mixing enthalpy started to agree qualitatively with experiment. No sucha posteriori choices and corrections are needed for our optimal basis, uniquely chosen before any calculation.5
Finally, in an attempt to correct the apparent “errors” of the CPA, Singh and Gonis34proposed “charge-neutral” spheres, an arbitrary, unphysical, and, as recently discussed,5unnecessary assignment. Their formation energy changed from positive to negative when the spheres’ radii were adjusted to give charge neutrality, with the latter giving a clearly incorrect formation enthalpy of −283 (−265) meV for the ordered (disordered) Al3Li, as shown in Table I. For the ordered alloys, however, they were able to addcombined corrections to the LMTO-ASA, which reduces ASA overlap errors due
STRUCTURAL PROPERTIES AND RELATIVE STABILITY. . . PHYSICAL REVIEW B85, 144202 (2012)
to the approximately 50% increase in the Al ASA radii. With combined corrections the L12formation enthalpy improves to −134 meV; yet, they could not correct the CPA in a similar fashion. Such an approach, however, does not represent the CPA charge density correctly.5 Simply put, for Al-Li, such
a dramatic change in ASA radii to force charge neutrality arises solely because of the large difference in calculated bulk moduli (Al 0.72 Mbar vs Li 0.12 Mbar) and volumes (Al 3.981 ˚A and Li 4.255 ˚A). Hence, only for ASA, the Al sphere will enlarge at the expense of Li because the Li sphere is easily compressed (the ratio of Al to Li bulk moduli is 6), so the size of the Li sphere is expected to decrease much more than should be physically expected from the total density (see original motivations discussed in Refs.20and5). So, when the moduli are substantially different, this adjustment does not describe the proper density, and adjusting spheres to minimize energy, say, is unwarranted.
Generally, however, using the SPR from the electronic density as the inscribed sphere of the VP (and using radical plane construction weighting to define full VP) offers a unique, physical, and optimized representation, working for all ordered and disordered configurational averaging approximations, including the CPA.
V. SUMMARY
For the commercially important Al-Li system, using a unique, physical and optimized representation of a site-centered charge density and potential in any local configuration using the KKR-CPA, we accurately predicted the relative stability of all ordered, off-stoichiometric partially ordered and disordered phases, including thermal antisites.6 We also resolved long-standing discrepancies throughout the literature for the sensitivity of Al-Li energy estimates for disorder alloys (CPA, SQS, and CE), permitting accurate prediction of formation enthalpies, solution enthalpies, and structural properties for general alloy configurations, all within a single code as desired for a reliable study of phase stability in complex alloys.
ACKNOWLEDGMENTS
This work was supported by the US Department of Energy, Office of Basic Energy Science, Division of Materials Science and Engineering (DE-FG02-03ER46026, algorithm development) and Ames Laboratory (DE-AC02-07CH11358, materials discovery applications). Ames Laboratory is oper-ated for the US Department of Energy by Iowa State University.
1P. E. A. Turchi, M. Sluiter, F. J. Pinski, D. D. Johnson, D. M.
Nicholson, G. M. Stocks, and J. B. Staunton,Phys. Rev. Lett.67, 1779 (1991).
2Aftab Alam, Brent Kraczek, and D. D. Johnson,Phys. Rev. B82, 024435 (2010).
3D. D. Johnson and Mark Asta,Comput. Mater. Sci.8, 54 (1997). 4M. H. F. Sluiter and Y. Kawazoe,Europhys. Lett.57, 526 (2002). 5Aftab Alam and D. D. Johnson,Phys. Rev. B80, 125123 (2009). 6D. D. Johnson, A. V. Smirnov, J. B. Staunton, F. J. Pinski, and W. A.
Shelton,Phys. Rev. B62, R11917 (2000).
7D. D. Johnson, D. M. Nicholson, F. J. Pinski, B. L. Gyorffy, and
G. M. Stocks,Phys. Rev. Lett.56, 2088 (1986); Phys. Rev. B41, 9701 (1990).
8D. D. Johnson and F. J. Pinski,Phys. Rev. B48, 11553 (1993). 9Alex Zunger, S.-H. Wei, L. G. Ferreira, and James E. Bernard,Phys.
Rev. Lett.65, 353 (1990);Z. W. Lu, S.-H. Wei, and Alex Zunger,
Phys. Rev. B44, 10470 (1991).
10C. Wolverton,Acta Mater.49, 3129 (2001).
11M. Sluiter, D. de Fontaine, X. Q. Guo, R. Podloucky, and A. J.
Freeman,Phys. Rev. B42, 10460 (1990).
12M. H. F. Sluiter, Y. Watanabe, D. de Fontaine, and Y. Kawazoe, Phys. Rev. B53, 6137 (1996).
13Nikolai A. Zarkevich and D. D. Johnson, Phys. Rev. Lett. 92, 255702 (2004).
14A. J. McAlister,Al-Li (Aluminum-Lithium), Binary Alloy Phase Diagrams, II Ed., edited by T. B. Massalski (ASM International, Ohio, USA, 1990), Vol. 1, pp. 167–168.
15R. Poduri and L.-Q. Chen,Acta Mater.45, 245 (1996);B. Noble
and S. E. Bray,ibid.46, 6163 (1998);J. P. Simmons, Ph.D. thesis, Carnegie Mellon University, 1992.
16E. J. Lavernia and N. J. Grant,J. Mater. Sci.22, 1521 (1987). 17S. Ceresara, G. Cocco, G. Fagherazzi, and L. Schiffini,Philos. Mag.
35, 373 (1977).
18B. Noble, S. J. Harris, and K. Dinsdale, J. Mater. Sci. 17, 461 (1982).
19X. Q. Guo, R. Podloucky, and A. J. Freeman,Phys. Rev. B40, 2793 (1989);X. Q. Guo, R. Podloucky, J. H. Xu, and A. J. Freeman,ibid. 41, 12432 (1990);X. Q. Guo, R. Podloucky, and A. J. Freeman,
ibid.42, 10912 (1990);M. J. Mehl,ibid.47, 2493 (1993). 20Kin-ichi Masuda-Jindo and K. Terakura,Phys. Rev. B39, 7509
(1989).
21J. Laverock, S. B. Dugdale, M. A. Alam, M. V. Roussenova, J. R.
Wensley, J. Kwiatkowska, and N. Shiotani,Phys. Rev. Lett.105, 236401 (2010).
22V. G. Vaks and N. E. Zein,J. Phys.: Condens. Matter2, 5919 (1990). 23P. A. Korzhavyi, A. V. Ruban, S. I. Simak, and Yu. Kh. Vekilov,
Phys. Rev. B49, 14229 (1994).
24Aftab Alam and D. D. Johnson,Phys. Rev. Lett.107, 206401 (2011). 25D. D. Johnson, A. Alam, and A. V. Smirnov,MECCA: Multiple-scattering Electronic-structure Calculations for Complex Alloys (KKR-CPA Program, ver. 1.9)(University of Illinois, Urbana, IL, 2008).
26Aftab Alam, S. N. Khan, Brian G. Wilson, and D. D. Johnson,Phys. Rev. B84, 045105 (2011).
27H. J. Monkhorst and J. D. Pack,Phys. Rev. B13, 5188 (1976). 28U. Von Barth and L. Hedin,J. Phys. C5, 1629 (1972).
29V. L. Moruzzi, J. F. Janak, and A. R. Williams,Calculated Electronic Properties of Materials(Pergamon, New York, 1978).
30D. A. Biava, Subhradhip Ghosh, D. D. Johnson, W. A. Shelton, and
A. V. Smirnov,Phys. Rev. B72, 113105 (2005).
31H. Ueda, A. Matsul, M. Furukawa, Y. Mlura, and M. Nemoto,
J. Jpn. Inst. Met.49, 562 (1985).
AFTAB ALAM AND D. D. JOHNSON PHYSICAL REVIEW B85, 144202 (2012)
32I. Barin, O. Knacke, and O. Kubaschewiski, Thermochemical Properties of Inorganic Substances(Springer-Verlag, Berlin, 1977).
33L. Vitos,Comput. Mater. Sci.18, 24 (2000).
34P. P. Singh and A. Gonis,Phys. Rev. B49, 1642 (1994). 35A. J. McAlister,Bull. Alloy Phase Diagrams3, 177 (1982). 36A. P. Midownik, inComputer Modeling of Phase Diagrams, edited
by L. H. Bennet (AIME, Warrendale, PA, 1986), p. 253.
37S. Chen, C. Jan, J. Lin, and Y. A. Chang,Metall. Trans. A20, 2247 (1989).
38M. L. Saboungi and C. C. Hsu,CALPHAD: Comput. Coupling Phase Diagrams Thermochem.1, 237 (1977).
39G. N. Kamm and G. A. Alers, J. Appl. Phys. 35, 327 (1964).
40H. J. Axon and W. Hume-Rothery,Proc. R. Soc. London A193, 1 (1948).
41Ann S. Copper,Acta Crystallogr.15, 578 (1962).
42S. H. Kellington, D. Loveridge, and J. M. Titman,J. Phys. D: Appl. Phys.2, 1162 (1969).
43E. D. Levine and E. J. Rapperport, Trans. Metall. Soc. AIME227,
1204 (1963).
44J. Hafner,From Hamiltonians to Phase Diagrams(Springer-Verlag,
Berlin, 1987).

![FIG. 2. (Color online) KKR-CPA(VP) aprecipitate at 523 K [results via first-order perturbation theory (open circles).(Ref.[solid (red) curve], compared to other data, including(Ref](https://thumb-us.123doks.com/thumbv2/123dok_us/8126602.241112/7.608.53.295.511.679/online-aprecipitate-results-rst-perturbation-circles-compared-including.webp)