Galaxy Zoo: Finding offset discs and bars in SDSS galaxies
Sandor J. Kruk,
1?Chris J. Lintott,
1Brooke D. Simmons,
1,2†
Steven P. Bamford,
3Carolin N. Cardamone,
4Lucy Fortson,
5Ross E. Hart,
3Boris H¨
außler,
6Karen L. Masters,
7Robert C. Nichol,
7Kevin Schawinski,
8Rebecca J. Smethurst
1,3‡
1Oxford Astrophysics, Department of Physics, University of Oxford, Denys Wilkinson Building, Keble Road, Oxford, OX1 3RH, UK 2Center for Astrophysics and Space Sciences (CASS), Department of Physics, University of California, San Diego, CA 92093, USA 3School of Physics and Astronomy, The University of Nottingham, University Park, Nottingham NG7 2RD, UK4Math and Science Department, Wheelock College, 200 The Riverway, Boston, MA 02215, USA
5School of Physics and Astronomy, University of Minnesota, 116 Church St. SE, Minneapolis, MN 55455, USA 6ESO - European Southern Observatory, Alonso de Cordova 3107, Vitacura, Santiago, Chile
7Institute of Cosmology and Gravitation, University of Portsmouth, Dennis Sciama Building, Barnaby Road, Portsmouth, PO1 3FX, UK 8Institute for Astronomy, Department of Physics, ETH Z¨urich, Wolfgang-Pauli Strasse 27, CH-8093 Z¨urich, Switzerland
Accepted 2017 April 26. Received 2017 April 26; in original form 2017 January 17
ABSTRACT
We use multi-wavelength SDSS images and Galaxy Zoo morphologies to identify a sample of ∼270 late-type galaxies with an off-centre bar. We measure offsets in the range 0.2-2.5 kpc between the photometric centres of the stellar disc and stellar bar. The measured offsets correlate with global asymmetries of the galaxies, with those with largest offsets showing higher lopsidedness. These findings are in good agreement with predictions from simulations of dwarf-dwarf tidal interactions producing off-centre bars. We find that the majority of galaxies with off-centre bars are of Magellanic type, with a median mass of 109.6M, and 91% of them havingM? <3×10¹⁰M, the characteristic mass at which galaxies start having higher central concentrations attributed to the presence of bulges. We conduct a search for companions to test the hypothesis of tidal interactions, but find that a similar fraction of galaxies with offset bars have companions within 100 kpc as galaxies with centred bars. Although this may be due to the incompleteness of the SDSS spectroscopic survey at the faint end, alternative scenarios that give rise to offset bars such as interactions with dark companions or the effect of lopsided halo potentials should be considered. Future observations are needed to confirm possible low mass companion candidates and to determine the shape of the dark matter halo, in order to find the explanation for the off-centre bars in these galaxies.
Key words: galaxies: dwarf, galaxies: interactions, galaxies: irregular, galaxies: struc-ture
1 INTRODUCTION
Bars are common in disc galaxies, between one and two thirds of local disc galaxies being barred (Sellwood & Wilkinson 1993; Sheth et al. 2008; Masters et al. 2011), depending on the bar classification method and the wave-lengths in which the galaxies are observed. Some of these galaxies exhibit a peculiar feature, a bar that appears to be offset from the photometric centre of the galaxy discs.
? E-mail:[email protected]
† Einstein Fellow
‡ This investigation has been made possible by the participation of over 350,000 users in the Galaxy Zoo project. Their contribu-tions are acknowledged athttp://authors.galaxyzoo.org
Such an offset seems common in low mass late-type galaxies of the kindde Vaucouleurs & Freeman (1972) de-fined as Magellanic spirals after their prototype, the Large Magellanic Cloud (LMC) (de Vaucouleurs 1955). The near-est such galaxy and the bnear-est-known example, the LMC itself hosts a bar that is offset from the centre of the outer disc isophotes by∼0.4 kpc, while the kinematic centre of the HI disc is offset from both by as much as ∼0.8 kpc (van der Marel 2001).
The origin of the off-centre bar in the LMC is not well understood.Zhao & Evans(2000) suggested that the bar in the LMC is off-centre as a consequence of a recent tidal in-teraction with the Small Magellanic Cloud (SMC) and the Milky Way. Numerical simulations of barred galaxies have
shown that a bar may become offset from the disc follow-ing an interaction with a companion, while the disc of the galaxy becomes lopsided (Athanassoula 1996;Athanassoula et al. 1997;Berentzen et al. 2003; Besla et al. 2012;Yozin & Bekki 2014). Recently,Pardy et al. (2016) have followed up on the idea of a tidally induced offset in barred Magel-lanic type galaxies using N-body and hydrodynamic simu-lations of dwarf-dwarf galaxy interaction. They investigated the relation between the dynamical, stellar and gaseous disc centres and the bar in a 1:10 mass ratio interaction, char-acteristic of the interaction between the SMC and the LMC (the stellar mass of the LMC is 3×10⁹M
(van der Marel
et al. 2002), while that of the SMC is 3×10⁸M (
Stan-imirovi´c et al. 2004)). They conclude that an offset between the photometric centre of the bar and the photometric cen-tre of the disc is produced in such an interaction. The pre-dicted shift is, at most, 1.5-2.5 kpc depending on the details of the interaction and type of halo considered. The largest offsets are produced for smaller impact parameters for the passing galaxy and large inclination angles with respect to the plane of the primary galaxy. The amplitude of the sub-sequent offset is correlated with the distorted asymmetry (lopsidedness) of the disc and it decreases with time, with the distortions vanishing after 2 Gyr. Surprisingly, they find that the stellar bar is always coincident with the dynamical centre and it is the disc that is displaced from the dynamical centre (see, e.g., Figure 3 inPardy et al. 2016).
Offset bars are observed in other galaxies in the local Universe as well. In a first large scale study of such nearby galaxies, Feitzinger (1980) measured an average offset be-tween the centre of the bar and the disc of 0.8 kpc for 18 galaxies. More recently,de Swardt et al.(2015) measured an offset of∼0.9 kpc between the centre of the stellar bar and the centre of the disc in NGC3906. In this case the bar cen-tre coincides with the dynamical cencen-tre determined through HI observations. In contrast with the LMC, NGC3906 is served to be isolated, thus a possible explanation for the ob-served offset is an interaction with the dark matter subhalo, or an unidentified fast moving companion.Bekki(2009) sug-gested that dark satellites with the mass of 108−109M
and either no or very little observable matter can create an offset bar in a collision with a Magellanic type galaxy. Alterna-tively, modeling of lopsided galaxies suggests that long-lived off-centre bars and asymmetries may be a consequence of misalignments between the stellar disc and halo (Jog 1997;
Levine & Sparke 1998;Noordermeer et al. 2001). The lopsid-edness in the stellar disc can be caused by several phenom-ena, such as tidal interactions (Beale & Davies 1969), gas accretion (Zaritsky & Rix (1997);Bournaud et al. (2005)) or small asymmetries in the galactic halo (Jog & Combes 2009).
Despite the availability of large surveys, observationally the origin of offsets and the asymmetries in Magellanic type galaxies has not yet been established. There has been contra-dictory evidence about the frequency of the companions of this type of galaxy. In a large survey of local Magellanic type galaxies, Odewahn(1994) found that 71 out of 75 galaxies have a nearby neighbour, within a projected separation of 120 kpc. In contrast, in an HI follow-up study of a subset of the Magellanic type barred galaxies observed byOdewahn
(1994), Wilcots & Prescott(2004) found that only 2 of 13
were interacting with their neighbour, clearly affecting their morphologies.
In this paper, we conduct the first systematic search for galaxies with offsets between the stellar bar and the discs in the largest survey in the local Universe, the Sloan Digital Sky Survey (SDSS) (York et al. 2000). With visual classifi-cations from the Galaxy Zoo citizen science project (Lintott et al. 2008; Willett et al. 2013), we are able to identify a large sample of local barred galaxies. Using 2D parametric decomposition we can decompose the galaxies into individ-ual components (bars, discs and bulges), measure the off-sets between the bars and the discs and quantify the disc asymmetry. Therefore, we are able to identify a sample of galaxies with offset bars and study their individual proper-ties, as well as search for companions to identify the cause of the offsets. Throughout the paper we adopt the WMAP Seven-Year Cosmological parameters (Jarosik et al. 2011) with (ΩM,ΩΛ, h) = (0.27,0.73,0.71).
2 DATA
All the galaxies used in the study are drawn from the Sloan Digital Sky Survey (SDSS) DR7 (Abazajian et al. 2009;
Strauss et al. 2002). We use visual classifications of galaxy morphologies from the Galaxy Zoo 21project (GZ2) (Willett
et al. 2013) which asked citizen scientists to provide detailed information about the visual appearance of galaxies. The full question tree for each galaxy image is shown in Figure 1 of
Willett et al.(2013).
From the superset of 240,419 galaxies classified in GZ22
and with stellar masses available from the MPA-JHU cat-alogue (Kauffmann et al. 2003a), we have selected all the galaxies with spectroscopic redshifts 0.005<z<0.06, a red-shift range with reliable GZ2 morphological classifications and suitable SDSS image resolution. Identifying bars in highly inclined galaxies is challenging, thus we selected only galaxies with an axis ratio ofb/a >0.5 given by the expo-nential model fits in SDSS (Stoughton et al. 2002), corre-sponding to inclinationsi.60◦.
In order to reach the bar question a Galaxy Zoo user must first classify a galaxy as a non edge-on galaxy with a disc or features. FollowingMasters et al.(2011), we only selected galaxies for which there were at least 10 answers to the question ‘Is there a sign of a bar feature through the centre of the galaxy?’. Throughout this paper we will be using the debiased likelihoods, denoted aspbar, fromWillett
et al.(2013). A galaxy was classified as being barred if the number of volunteers identifying it as having a bar is larger than, or equal to the number identifying it as not having a bar, i.e.pbar>0.5. The selection resulted in a large sample
of 5,485 barred galaxies.
The selection of barred galaxies with pbar > 0.5 has
been shown to pick up predominantly intermediate and strong bars, when compared to expert classifications such as those in Nair & Abraham (2010), as discussed in Ap-pendix A ofMasters et al.(2012) and also shown in Figure 10 inWillett et al.(2013). This cutoff was chosen as an un-avoidable compromise between having a sample with high
1 http://zoo2.galaxyzoo.org
Bar/T=0.07 offset=1.61”
Bar/T=0.08 offset=1.61”
Bar/T=0.08 offset=1.61”
Bar/T=0.08 offset=1.61”
Bar/T=0.09 offset=1.61” n=0.61
re=3.13”
n=0.61 re=3.13”
n=0.61 re=3.13”
n=0.61 re=3.13”
n=0.61 re=3.13”
n=1.00 re=13.42”
n=1.00 re=13.42”
n=1.00 re=13.42”
n=1.00 re=13.42”
n=1.00 re=13.42”
image
u
g
i
z r
[image:3.595.116.470.99.455.2]disc bar disc+bar residual
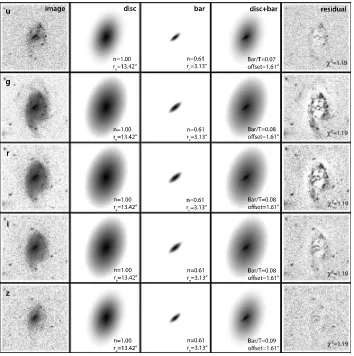
Figure 1.Images of galaxy J143758.75+412033.0 inu, g, r, i, z bands. Example of a GALFITM disc+bar fit, model and residuals in the 5 bands, used to identify galaxies with offset bars. The first column shows the original images, the second shows the model for the exponential disc and the third column the bar as a free S´ersic component. The fourth column is the combined bar+disc model and the last column shows the residual and the reducedχ2. The projected offsets were measured as the separation on the sky between the centres of the two components. The legend shows the S´ersic index, the effective radius for each component and the bar-to-total luminosity ratio in the five bands.
purity and a complete sample of barred galaxies. Lowering the cutoff would increase the completeness of the sample by including a higher fraction of weak bars, but would also contaminate the sample with non-barred galaxies.
To avoid problems with deblending we exclude merging or overlapping galaxies. According toDarg et al.(2010), in GZ1 (Lintott et al. 2011) this can be done with a cut of the GZ merging parameter pmerg < 0.4. The galaxies in GZ2
are a subsample of the galaxies classified in GZ1, and al-though using a different classification tree,pmerghas a
simi-larly strong correlation with the projected galaxy separation, as shown byCasteels et al.(2013). Our final, large sample of barred galaxies contains 5,282 galaxies. Each galaxy was inspected by at least 19 volunteers and the mean number of classifications per galaxy was 42. We also make use of volunteers’ classifications of the galaxy bulges, as described in Simmons et al. (2013). The volunteers were asked to classify the bulges of these systems into four categories:
No-bulge, Just-noticeable, Obvious, Dominant. We split the sample into two categories: ‘disc dominated’ (having combined debiased likelihoods for no-bulge+ just-noticeable>obvious+dominant) and ‘obvious bulges’ (with
no-bulge+just-noticeable<obvious+dominant). There are 2,625 ‘disc dominated’ galaxies (50% of the sample) and 2,657 galaxies with ‘obvious bulges’ (50% of the sample).
3 MEASURING BARS AND DISCS
3.1 Galaxy image decomposition
A key observable is the spatial distribution of light in a galaxy, which can be modeled using parametric functions such as the S´ersic profile. In a subsequent paper (Kruk et al, in prep.) we will discuss in detail the 2D decomposition method used to fit the full sample of∼5,000 barred galax-ies with three components using GALFITM3, developed by the MegaMorph project (Bamford et al. 2011;H¨außler et al. 2013). GALFITM is a modified version of GALFIT3.0 (Peng et al. 2010) that makes use of the full wavelength coverage of surveys and enables fitting across multiple wavelengths,
in order to increase the accuracy of measured parameters. This is achieved by setting each parameter of the model to be a polynomial function of wavelength. GALFITM then opti-mises the coefficients of these polynomials to best match the multi-band data. As a result, it improves the effective radius and S´ersic indexn estimates in low-S/N bands and, conse-quently, it improves the photometry of fainter components. The multi band fitting was applied to bulge-disc decomposi-tions of 163 artificially redshifted nearby galaxies and shown to improve the measurements of structural parameters (Vika et al. 2014).
In this study, we use publicly available data from SDSS in five bands (ugriz). To account for seeing, GALFITM con-volves the model with a PSF, provided by SDSS for each passband. To ensure that only the targeted galaxies are fit-ted, we created a mask for each galaxy field in ther-band usingSExtractor (Bertin & Arnouts 1996) and we used it for all the 5-bands in the fitting process.
The galaxy model included discs, bars and bulges cho-sen according to the visual classifications from Galaxy Zoo, as detailed in Section 2. We fitted the galaxies in the ‘disc dominated’ and in the ‘obvious bulges’ samples with two (disc+bar) and three components (disc+bar+bulge), respec-tively, using an iterative process. First, we fitted a single S´ersic profile, with the purpose of providing initial values for the parameters for the subsequent fits. Subsequently, we fitted a simple, two component model: an exponential disc and a bar with a free S´ersic index, using the estimated pa-rameters from the single S´ersic fit as initial guesses. The bar component was modeled as an ellipse with an initial axis ratio of 0.2, an initial S´ersic index of 0.7, a smaller effective radius than the disc and dimmer, but initially having the same centre as the disc. The centres of the two components were allowed to vary freely from each other across the image, without constraints, allowing offsets between them. This was the final step in the case of ‘disc dominated’ galaxies, while for the ‘obvious bulges’ sample we added a third component, a bulge. The bulge was modeled as a smaller round compo-nent, centred on the bar and with an initial S´ersic index of n= 2. We constrained the centres of the bulge and the bar to be the same, to avoid the third component converging to a nearby clump or overlapping star that has not been masked out. This is motivated both by visual inspection and physi-cal processes: bars are thought to channel gas and build up bulges at their centres (Kormendy & Kennicutt 2004).
The magnitudes of the components were allowed to vary freely with wavelength, while the S´ersic indices and the fective radii were kept fixed across the five bands. This ef-fectively means that there are no colour and, hence, no stel-lar population gradients within the models of the individual components, which is a simplified picture of galaxy struc-ture. Our assumption is justified as a first approximation as we are primarily interested in determining the centres of the components by using all the five bands.
The two-component fits converged for 2,186 (83%) and the three-component fits for 2,205 galaxies (83%). An exam-ple of a two-component model (disc+bar) for a galaxy, the images and residuals, in five bands, can be seen in Figure
1. In some cases a second disc component was fitted instead of a bar, thus we excluded galaxies that had a second com-ponent with an axis ratiob/a >0.6 (500 galaxies). We also excluded galaxies with discs having unphysically large
effec-0.00
0.01
0.02
0.03
0.04
0.05
0.06
0.07
z
23
22
21
20
19
18
17
16
15
14
M
R [image:4.595.309.537.104.271.2]fitted-bar (3357 gal)
offset (271 gal)
Figure 2.Ther-band Petrosian absolute magnitudes of the sam-ples used in the paper: thefitted-bar sampleand theoffset
sample, as identified in Section 3.2. The box contains the
galax-ies in thevolume-limited sample(1,583 galaxies) as defined in Section 4.3. The curved line corresponds to the GZ2 completeness limit of 17 magnitudes, at a particular redshift.
tive radii,re>200 pixels (170 galaxies), corresponding to 8
kpc atz= 0.005, 16 kpc atz= 0.01 and 91 kpc atz= 0.06. Although 8-16 kpc are plausible values for the disc effective radius, there were only two galaxies discarded between the redshifts 0.005< z <0.01, both of which showed unrealis-tically largere’s when inspected. We also excluded bar and
bulge components with too large S´ersic indices, n >8 (176 galaxies), as these are unphysical values and do not repre-sent a good model of the bar and bulge. Finally, we excluded 188 galaxies where a clump or a foreground overlapping star was fitted instead of one of the components. The bar was as-sumed to be the component with lower axis ratio of the two components fitted, which should be the case as the galax-ies were selected to be face-on. We inspected all the images and checked if the disc+bar and the disc+bar+bulge mod-els were good representations of the target galaxy, by check-ing that the bar (and the bulge, in some cases) was not visible in the residuals. The final sample that was success-fully fitted consists of 3,357 galaxies (a success rate of 64%): 1,532 galaxies with disc+bar (‘disc dominated sample’) and 1,825 galaxies with disc+bar+bulge (‘obvious bulge’ sam-ple). Henceforth we refer to the subsample of galaxies with meaningfully converged disc+bar and disc+bar+bulge fits collectively as thefitted-bar sample. The galaxies where the fits failed and those that were subsequently excluded have a similar distribution ofpbar as thefitted-bar sam-ple(with a maximum of 10% difference atpbar∼0.5), hence
the final sample is not biased by excluding 36% of the barred galaxies.
3.2 Offset Sample
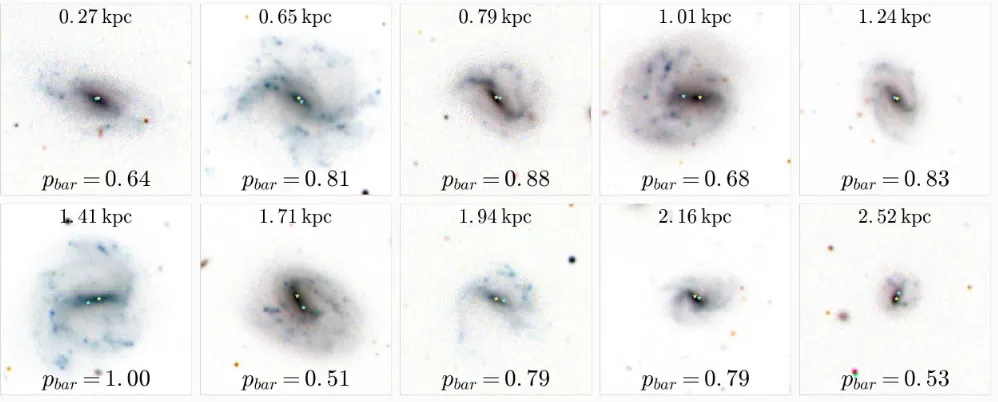
Figure 3. Examples of galaxies with offset discs and bars in SDSS; inverted colourgri composite images. The measured deprojected photometric offset between the bar and the disc is given at the top of each image. The GZ2 debiased likelihood that the galaxy has a bar is given at the bottom of each image. The centre of the bar component, according to the best fit model, is marked with a yellow star, while the photometric centre of the disc is marked with a cyan star. The images are 1 arcmin x 1 arcmin.
bar. In SDSS, the FWHM of the PSF varies between dif-ferent fields and bands (Bramich & Freudling 2012). In the frames used in this study it ranged between 0.8300−2.3300in theu-band (with a median of 1.3400) and 0.5600−1.9900in the
i-band (with a median of 1.0600). Since we fitted five bands simultaneously, we considered a galaxy to have an offset bar if the projected offset was larger than the smallest FWHM of the PSF of the five bands. In the majority of cases, this was the i-band or r-band. This cut for identifying galax-ies with off-centre bars in five bands is conservative since the bar is not a round feature, similar to the shape of the PSF, but rather an extended, linear feature. We are, there-fore, identifying the galaxies in our sample with the largest offsets.
The measured offsets were then converted into a phys-ical offset at the position of the galaxy, and deprojected, adopting a simple analytical 1D approximation used to de-project bars (Martin & Roy 1995;Gadotti et al. 2007). The deprojected offset is:
ddepoffset=dprojoffsetpsinα2seci2+ cosα2 (1)
where αis the angle between the projected major axis of the bar and the inclined disc (the difference in the position angles of the two components) and seci∼1/(b/a)disc. The
uncertainties in the deprojections are small (∼20%), since the galaxies were selected such that i . 60◦ (Zou et al. 2014), and since the sizes of the offsets are small compared to the sizes of bars and discs.
GALFITM also returns the errors in the estimated pa-rameters for a particular model, which is typically of the order of a few percent in the estimate of the offset. GAL-FIT errors are known to underestimate the true error be-cause it assumes uncorrelated noise and it does not account for contribution from systematic model errors, as shown by
H¨aussler et al.(2007).
Inspecting the images of galaxies found to be offset, we observed that the majority of them were blue, and therefore, young with a bar and one or more spiral arms, with an off-set between the stellar bar and disc being clearly noticeable. We found a sample of 271 galaxies having bars offset from the photometric centre of the disc, most of them faint, as shown in Figure2, in comparison to thefitted-bar sam-ple. 87% of these galaxies have projected offsets larger than
100, which corresponds to 0.1 kpc at z=0.005 or 1.1 kpc at z=0.06. Therefore we are able to detect similar offsets to those suggested byPardy et al.(2016). Henceforth we refer to this sample of 271 galaxies, as theoffset sample. This is currently the largest sample of such galaxies. Some exam-ples of galaxies with offset bars can be seen in Figure3and the results from the parametric fitting are summarized in Table1. For comparison, we also select a mass and redshift-matchedcomparison sampleof 271 galaxies with centred bars (selected such that the projected offset is smaller than the PSF FWHM).
3.3 Quantifying lopsidedness
In addition to measuring offset distances between the bar and disc components, we also measured the lopsidedness of each galaxy. According toPeng et al.(2010), this asymmetry can be quantified by expressing the shape of a galaxy as a Fourier perturbation on a perfect ellipse:
r(x, y) =r0(x, y)
1 +
N
X
m=1
amcos(mφ+φm)
, (2)
wherer0(x, y) is the radial coordinate of a traditional ellipse, φm denotes the phase of the mcomponent and the
ampli-tude of the Fourier component is defined asAm=|am|. The
amplitude of the first Fourier mode (m= 1),A1 quantifies
of the effective radius on opposing sides of the galaxy. The amplitude of the second Fourier mode (m = 2)A2
quanti-fies the strength of the distortions by structures which have symmetry on rotation by 180◦, such as bars or spiral arms. To study the lopsidedness of the galaxies, we measured theA1amplitude by fitting anm1Fourier mode on an
expo-nential profile using GALFITM. A highA1 amplitude
sug-gests that the photometric centre of an irregular galaxy is not located at the centre of the galaxy, modeled as an el-lipse (geometric centre). Therefore, if the mean peak inten-sity is located in the bar component, galaxies with offset bars should show largem1 amplitudes.
4 RESULTS
4.1 Bar-Disc Offsets
We measured the offsets as the separation between the ge-ometric centre of the exponential disc component and the centre of the bar component, and deprojected them using Equation1. For the 271 galaxies in theoffset samplethe measured physical offsets varied between 0.2-2.5 kpc (with a median offset of 0.93 kpc and a standard deviation of 0.50 kpc), as seen in Figure 4, a similar range to the one pre-dicted byPardy et al.(2016), for different parameters of the dwarf-dwarf interaction. We find that there is only a very weak negative correlation of the measured offsets withpbar
(Spearmanρ=−0.16, p= 0.01), suggesting that our study is not biased against galaxies with the largest offsets, albeit we reiterate that we select mostly intermediate and strong bars with the selection ofpbar>0.5.
4.2 Lopsidedness
Using the amplitude of the first Fourier mode, A1, as an
indicator of lopsidedness (described further in Section 3.3), we found thatA1 varies between 0 and 0.40, with a median
of 0.12 in theoffset sample. In contrast, thecomparison sample has a median A1 of 0.05. As expected, we find a
weak, but significant correlation between the measuredA1
and disc-bar offsets (Spearman ρ = 0.4, p < 10−11).
Al-most all the galaxies with off-centre bars are lopsided, with 90% havingA1>0.05, which, according toBournaud et al.
(2005) is an indicator for lopsidedness. 63% of the galax-ies in our sample show strong lopsidedness withA1 >0.10.
The strongest asymmetry in the central regions of the galac-tic disc is produced by the off-centre bar, and the correla-tion between the disc-bar offset and A1 is seen in Figure
5, which matches the simulation prediction in Figure 6 of
Pardy et al. (2016). A Kolmogorov-Smirnov (K-S) test on theoffset sampleand thecomparison sampleof galaxies with centred bars givesk= 0.53 andpKS<10−15,
suggest-ing that galaxies with off-centre bars are more lopsided than the galaxies with centred bars.
Using a sample of 149 galaxies observed in the infra-red,
Bournaud et al. (2005) has shown that the m = 1 distor-tions correlate with the presence ofm= 2 spiral arms and bars, but the strong lopsidedness is not correlated with the presence of interacting companions. Furthermore, Zaritsky et al.(2013) found that nearby low surface brightness, late-type galaxies in the S4G survey show significant lopsidedness
0.5
1.0
1.5
2.0
2.5
3.0
Bar
−Disc offset (kpc)
10
20
30
40
50
60
N
[image:6.595.310.537.104.273.2]offset
Figure 4.Distribution of the measured offsets between the pho-tometric centres of the discs and the bars, corrected for inclination effects, in theoffset sample. The criteria for a galaxy to have an offset bar is that the projected offset is larger than the size of the PSF.
0.5
1.0
1.5
2.0
2.5
3.0
Bar
−Disc offset (kpc)
0.1
0.2
0.3
0.4
0.5
A
1comparison
offset
0.1
0.2
0.3
0.4
N
0.1 0.2 0.3
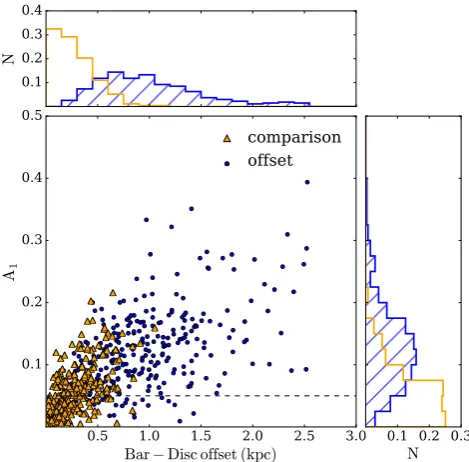
N
Figure 5.The Fourierm= 1 mode amplitude,A1, is correlated with the offset between the disc and the bar.A1 > 0.05 is an indicator of lopsidedness, shown by the dotted line in the plot. The normalized histograms show the distributions ofA1 for the
offset sampleand comparison sample (on the vertical) and
the distribution of the deprojected offsets for the two data sets (on the horizontal).
which does not depend on a rare event, such as the accretion of a satellite. They found a similar average value of lopsid-edness in local barred galaxies in S4G survey, hA1i= 0.15,
however they measuredhA1iat the outer isophotes and not
[image:6.595.306.541.369.600.2]SDSS Name Redshift mr Disc Bar Bulge log(M?) A1 Offset Offset
[mag] re[kpc] n re [kpc] n re[kpc] n [M] [arcsec] [kpc]
J001723.39-003112.8 0.032 16.71 3.13 1.00 1.25 0.49 - - 9.40 0.20 2.80 1.98
J163037.96+272744.2 0.059 14.96 11.35 1.00 6.33 0.48 0.77 1.03 11.07 0.09 0.97 1.24
J023356.29+005525.2 0.022 15.17 5.27 1.00 1.24 0.51 - - 9.59 0.08 1.19 0.58
J102003.64+383655.9 0.007 13.87 2.60 1.00 0.80 0.87 - - 9.05 0.28 6.84 1.01
J074951.23+184944.3 0.016 14.78 6.11 1.00 1.22 0.25 - - 9.34 0.07 1.08 0.38
J132743.83+624559.6 0.022 13.93 8.93 1.00 4.23 0.70 0.49 1.38 10.54 0.04 1.90 1.19
J155946.42+371437.9 0.057 16.74 8.56 1.00 1.46 2.56 - - 9.91 0.17 1.22 1.34
J111041.31+585646.5 0.046 16.42 5.02 1.00 3.10 0.97 - - 9.93 0.18 1.23 1.19
J134308.83+302015.8 0.035 13.66 12.61 1.00 7.19 0.26 0.96 0.43 11.09 0.07 1.16 1.00
[image:7.595.41.552.106.241.2]J165214.37+635738.9 0.017 14.71 3.75 1.00 0.91 0.10 - - 9.77 0.18 3.25 1.22
Table 1. Properties for 10 out of the 271 galaxies in theoffset sample, fitted with disc+bar or disc+bar+bulge components. The
redshifts andr-band apparent Petrosian magnitudes were drawn from SDSS DR7 and the stellar masses were drawn from the MPA-JHU catalogue (Kauffmann et al. 2003a). The disc component was fitted with an exponential profile (n= 1), while the bar and bulge with a free S´ersic profile. The offsets were measured between the photometric centres of the disc and of the bar and the physical offsets were deprojected using Equation1. Full table is available in the electronic version of the paper.
non-barred galaxies are also lopsided, however they did not make a distinction between galaxies with off-centre bars and those with centred bars.
4.3 Offset population properties
Further, we desire to study the statistics of the offset population in greater detail. The survey is incomplete for fainter galaxies at higher redshifts, thus we select a
volume-limited sample. As illustrated in Figure 2, from the
fitted-bar sample we select only galaxies in the redshift range 0.005<z<0.04 and brighter thanMr6−19.22, which
is ther-band absolute magnitude corresponding to the GZ2 completeness magnitude of 17, at a redshift z = 0.04. We choose this redshift cut as a compromise between includ-ing fainter galaxies and havinclud-ing a sufficiently large sample. Because of resolution effects, it is easier to detect smaller offsets in more local galaxies, thus choosing a lower redshift limit ofz = 0.04 is justifiable. Thisvolume-limited sam-ple consists of a subset of 1,583 barred galaxies from the
fitted-bar sample: 693 ‘disc dominated’ galaxies (44% of
the sample) and 890 galaxies with ‘obvious bulges’ (56% of the sample). In this volume-limited sample, 8%, or 131 galaxies are offset systems. In the following subsections we use thevolume-limited sampleand the corresponding subsample of offset systems when discussing their properties.
4.3.1 Mass distribution
The distribution of stellar masses (drawn from average val-ues in the MPA-JHU catalogue; Kauffmann et al. 2003a) for the 131 galaxies identified as having off-centre bars, as well as for the entirevolume-limited sample, can be seen in Figure 6. The two distributions are clearly different, the barred galaxies have a median mass of 1010.3M, while the galaxies with off-centre bars have a median mass of 109.6M.
A K-S test gives a value ofk= 0.49 andpKS<10−15; there
is no evidence that the two distributions are similar. This suggests that offsets between the discs and bars are proper-ties of lower mass barred galaxies.
9.5
10.0
10.5
11.0
11.5
log(
M
)(M
¯)
0.05
0.10
0.15
0.20
0.25
0.30
0.35
N
or
m
al
is
ed
All:
log(Mmedian) = 10.29M¯Offset:
log(Mmedian) = 9.63M¯K-S test:
k= 0.49, p <10−15f
offset
volume-limited
offset
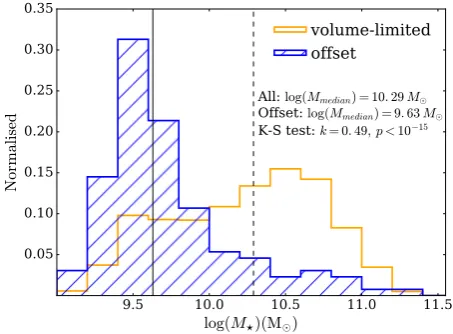
Figure 6. Normalized histograms of the mass distribution of galaxies with offset bars in the volume-limited sample (131 galax-ies) and the volume-limited sampleof barred galaxies (1,583 galaxies). The median mass of galaxies with off-centre bars is 109.63M
(as shown by the vertical solid line), while the median mass of barred galaxies is 1010.29M
(as shown by the vertical dashed line). Only 12 galaxies with 3×10¹⁰M
are seen to have off-centre bars.
The masses of the volume-limited sample of offset sys-tems lie between 109−1011M, similar to Magellanic type
dwarfs, with a typical (median) mass of 4×10⁹M. We find that∼20% of the dwarf galaxies (withM < 1010M)
of thevolume-limited sample have offset bars. Further-more, 28% of the barred galaxies with masses between 109−109.6Mhave off-centre bars, suggesting that offsets are most common in barred galaxies of these masses.
We also find that only 12% of the galaxies with offset bars have masses larger than 1010.3M, even though this is the median mass of thevolume-limited sample. Further-more, only five offset galaxies are as massive as the Milky Way (with a mass of∼1010.8M
[image:7.595.310.537.328.495.2]-Milky Way type interaction. Our observations suggest that such an interaction should not affect the relative position of the bar and disc significantly.
Since this section concerns galaxies in a volume-limited sample, observational biases should not be responsible for the observed correlation between the offsets and lower stel-lar masses. It is possible that a higher fraction of even lower mass galaxies host offset bars, however more local and deeper surveys are needed to better probe the 107−109M mass range.
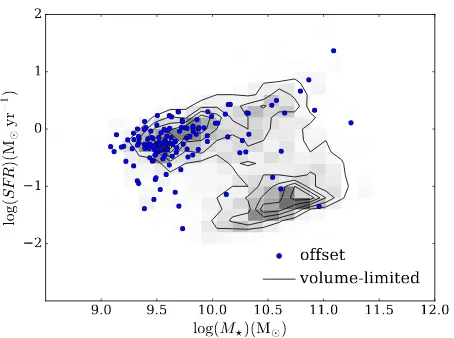
4.3.2 Star formation rates
In Figure 7 we plot the SFR (Brinchmann et al. 2004) against the stellar mass and notice that most offset galaxies are young, blue and star-forming, being situated on the star forming main sequence, in contrast with the majority of the barred galaxies which are red in colour, as identified by Mas-ters et al.(2011). 21 out of 131 galaxies (16%) have star for-mation rates below log(SFR)=−0.5Myr−1and are below the main sequence, in the ‘Green Valley’ or ‘Red Sequence’. Within our sample, at M? < 1010M, barred galaxies are
typically star forming. There is no significant difference in the SFR of galaxies with offset and centred bars. We note that ourvolume-limited sampleis incomplete for red (and so likely passive) galaxies atM?.1010Mand, therefore, cannot rule out differences in star formation fractions at low masses.
4.3.3 Stellar bar properties
From the GALFITM fits it is possible to estimate the proper-ties of light profiles of the individual components. The stellar bars in the offset-bar systems are characterized by a median ellipticity of = 0.72±0.10 (error bars are 1σ) and they contain 0.15±0.09% of the total light of the galaxy in the
r-band (Bar/T ratio). The bars have an almost exponential light profile, of median S´ersic index n = 0.93±0.70. Kim et al.(2015) pointed out that this is indicative of a young population. They used a recent survey of 144 barred galax-ies and showed that the brightness profile of the bar can be used as an indicator of its age. Bars are believed to be born out of disc material, which has an exponential profile, and in their evolution, they trap stars in the bar orbits (Sellwood & Wilkinson 1993;Sellwood 2014;Athanassoula et al. 2013), flattening the light profile.
We measure similar median values for these parame-ters for thevolume-limited sample:= 0.68±0.13 and Bar/T = 0.14±0.12 in ther-band. The median S´ersic in-dex of n = 0.67+1.22
−0.57 reflects the different populations of
bars: bars with low S´ersic indices in early-type galaxies and bars with close to exponential profiles in late-type barred galaxies. These suggest that the main determinant of the structure of these galaxies is the stellar mass, rather than the physical process that is causing the bar to be off-centre from the disc.
With the fits in five different bands, it is possible to estimate the optical colours of the components, which were corrected for the dust extinction in the Milky Way, using the maps fromSchlegel et al.(1998). The discs and the bars of the galaxies in the offset-bar sample have similar blue
9.0
9.5
10.0
10.5
11.0
11.5
12.0
log(
M
)(M
¯)
2
1
0
1
2
lo
g(
SF
R
)(
M
¯yr
−
1
)
offset
[image:8.595.312.539.104.273.2]volume-limited
Figure 7. The location of the offset systems on a SFR-Mass plot, overlaid on thevolume-limited sampleof barred galaxies. Galaxies with offset bars are located almost entirely on the star forming main sequence.
colours, with a medianu−r∼1.5. Therefore, it is reasonable to assume that stellar populations of the bar are the same as those in the disc. Converting to stellar masses, we find that the typical (median) mass of the stellar bar is∼6×10⁸M,
which is comparable to the mass of the bars in other Mag-ellanic type galaxies (3×10⁸M
for NGC3906 (de Swardt
et al. 2015), for example).
4.3.4 Bulges
Only 10% of the offset galaxies (14 out of 131) have ‘obvious bulges’, while 90% (117 out of 131) have ‘just noticeable‘ or ‘no bulges’. This is in striking contrast with the distribution of bulge types of thevolume-limited sampleof which 56% are ‘obvious bulges’ and 44% are ‘disc dominated’, suggest-ing that the presence of an off-centre bar is connected to the absence of a considerable bulge. Considering that half of the massive disc galaxies are barred (Masters et al. 2012) and that bulges grow with the total mass of a galaxy ( Kauff-mann et al. 2003b), we would expect a similar fraction of offset galaxies with ‘obvious bulges’, if stellar mass does not play an important role in the process causing the offsets. This also implies a lack of significant mergers, as even mi-nor mergers of 1:10 mass ratio are believed to build up bulges (Walker et al. 1996).
We test the effect of not accounting for ‘obvious bulges’ in the fits by using the second step in the fitting procedure (disc+bar) for all the barred galaxies. In this case, the S´ersic indices of the bars in two component fits are artificially in-creased compared to the three component fits (median S´ersic indexnbar= 1.96 compared tonbar = 0.67) because of the
Figure 8.Examples of galaxies with offset bars that have close neighbours (<100 kpc).
similar sample of galaxies with offset bars and to the same result that the distribution of masses of offset galaxies and the volume-limited barred sample is significantly different.
4.4 Companions
In order to test the hypothesis that the offsets between discs and the bars are caused by a tidal interaction with a smaller companion, we conduct a search for such companions in SDSS, following the recently published method by Patton et al. (2016) which was also used in Barton et al. (2000),
Ellison et al.(2008) andPatton et al.(2013). In this section we use thefitted-bar sample, theoffset sampleof 271 galaxies and the similar sized mass and redshift-matched
comparison sample of galaxies with centred bars, as
de-fined in Section 2.
We identify the closest companion for each galaxy in our samples, in SDSS, by considering as potential compan-ions only those galaxies which have measured spectroscopic redshifts. We define a potential closest companion to be any galaxy which has ∆v within 1000 km s−1 of the galaxy in question, with the smallest projected separation, rp. Since
we are interested in interactions of dwarf galaxies, we do not impose any mass ratio cut.
We find that 642 out of the 3,357 galaxies (∼19%) in thefitted-bar samplehave close companions, defined as within a projected separation ofrp<100 kpc. With a similar
percentage, 17%, 46 galaxies in theoffset samplehave a close companion, some examples of which can be seen in Figure 8. An even higher percentage, 24%, or 64 galaxies out of the 271 galaxies in the comparison sample have close companions, withinrp<100 kpc.
Simulations byPardy et al.(2016) suggest that distor-tions in the disc can persist for 2 Gyr after the companion fly-by. Assuming a typical relative velocity of 375 km s−1 (∼LMC-SMC relative velocity), the galaxy and companion could be separated by 750 kpc at 2 Gyr after the interaction, therefore we check for companions within this projected dis-tance. We find 199 galaxies (or 82% of theoffset sample) to have at least one spectroscopically confirmed companion within 750 kpc. Similarly, 86% of the galaxies with centred bars in thecomparison samplehave at least one compan-ion within 750 kpc. Since the separatcompan-ion can be used as a proxy for the time after the interaction, we plotted the disc-bar separation versus the separation from the nearest companion in Figure9and we do not find any correlation of the offset declining with the separation, the Pearson’s corre-lation test giving anrvalue of 0.17. The slight differences in close or distant companion fractions between the offset-bar
Figure 9.Bar-Disc offset versus the projected separation to the nearest neighbour with spectroscopic redshifts from SDSS. The top plot shows the same offset binned in separations of 50 kpc for theoffset sampleand thecomparison sample. There is no clear evidence for declining offset with projected separation for the sample of galaxies with off-centre bars, the r-coefficient for a correlation beingr= 0.17, p= 0.01. The mean disc-bar offset is∼1 kpc across all bins for theoffset sample. The error bars represent 1σin each bin.
sample and centred-bar comparison sample are not statis-tically significant. Thus, we do not find galaxies with off-centre bars to have more companions compared to similar mass barred galaxies within 750 kpc, nor closer companions within 100 kpc. There are many cases of isolated galaxies with offset bars without any apparent companion.
It is important to note that there is high incomplete-ness at galaxies with small separations due to fibre collisions and deblending. The problem is especially at separations less than 55 arcsec which biases the mass and redshift distribu-tion of close pairs (Ellison et al. 2008). This corresponds to 10-60 kpc separations in the redshift range of our sample. In the case of the brightest galaxies, the automated SDSS de-blender might mistakenly identify galactic clumps as neigh-bouring galaxies. We inspected all the companions at the lowest angular separations,rp<30 kpc to make sure that
we are indeed detecting a companion. The nearest compan-ion search is also incomplete because of the flux limits of the survey. The limiting magnitude for the spectroscopic survey in SDSS ismr = 17.77 (Strauss et al. 2002), where mr is
the Galactic extinction-corrected Petrosian magnitude. The
r-band magnitudes of the galaxies in our offset sample
range between 12.55< mr <17 and this means that there
will often be low mass companion galaxies which are not detected. For example, for a galaxy of magnitudemr = 16,
[image:9.595.43.282.100.182.2]ob-served magnitude scales with stellar mass. If we are near the faint end limit, we are strongly biased against finding less massive companions for the galaxy. We would only be able to find a 10:1 mass ratio companion for galaxies brighter thanmr= 15.27.
Based on the limiting magnitude of the SDSS spec-troscopy survey, the maximum mass an unseen companion can have is 108.8±0.4M (median value) for the galaxies in theoffset sample, corresponding to a median mass ratio of 5:1. Thus, it is likely that we miss companion galaxies which are 10 times less massive than the galaxies with off-set bars. Deeper surveys such as SDSS Stripe 82, DECaLS (Schlegel et al. 2015), GAMA (Driver et al. 2008) are needed to identify possible low mass companions and search for tidal features as potential evidence of minor mergers.
5 DISCUSSION
Interestingly, we find a mass above which galaxies are un-likely to have offset bars,∼3×10¹⁰M, similar to that noted byKauffmann et al.(2003b), who showed that the properties of galaxies in the low redshift universe change significantly at this mass. Lower mass galaxies have younger stellar pop-ulations and are disc-dominated, while higher mass galaxies tend to be more concentrated, with higher stellar mass sur-face densities typical of bulges. Given that∼34% of galaxies in the volume-limited sample have higher masses than
∼3×10¹⁰M (as seen in Figure6) and only ∼2% of them have offset bars, it is highly unlikely that finding a similar mass threshold is a simple coincidence. We suggest that the growth of bulges, expected to happen at the same charac-teristic mass, stabilises the disc, preventing it from moving around the centre of mass of the galaxy. In such systems, a significant fraction of the galaxy mass is in the bulge and the bar which will produce a steeper potential well. Being highly concentrated, the inner components will reduce the self-gravity of the disc and it will prevent the disc from shift-ing significantly due to an interaction. This transition from a rotation supported stellar disc to a pressure-dominated spheroid can be sufficient to stabilise the disc and also cause morphological quenching (Martig et al. 2009;Kaviraj 2014). If offsets between discs and bars are truly caused by interactions with lower mass companions, another possibil-ity for observing overwhelmingly more offsets in lower mass galaxies compared to high mass galaxies is a difference in the interaction rates. Liu et al.(2011) showed that in the SDSS survey (and similarlyRobotham et al. (2012) in the GAMA survey) there is an∼11% chance for a galaxy with a similar mass to the Milky Way to have a companion at least as massive as the LMC (thus with a 10:1 mass ratio). In our volume-limited study, we find that only 2% of the galaxies with the mass of the Milky Way (between 1010.5−1011.1M)
have offset bars, while the fraction of galaxies with masses 109−109.6M having offset bars is as much as 28%. If an interaction is equally likely to cause an offset bar, regardless of the mass of the main galaxy, it is very improbable that the interaction rate for low mass galaxies is so much higher. Even though we do not find a correlation between the galaxies with off-centre bars and the nearest companions, tidal interactions between the galaxy and a small compan-ion, as suggested byPardy et al.(2016), cannot be ruled out.
The incompleteness due to the flux limit of SDSS and fiber collisions at the smallest separation make the closest spec-troscopic companion hard to identify. Future specspec-troscopic observations of potential candidate companions should be able to help identify physical companions. Another possi-ble explanation for the missing companions are high veloc-ity dwarfs on eccentric orbits that are now too far away to appear associated with the primary galaxy, on the long timescales in which the offset is restored. Further simulations of dwarf-dwarf interactions that better explore the parame-ter space (mass ratios, relative velocities, impact parameparame-ters, collision angles) are needed to quantify the disc-bar offsets and constrain how long the offset lasts in different galaxy interactions.
Despite not being able to identify all the physical com-panions, the large number of isolated galaxies with off-centre bars in our sample and other studies (Feitzinger 1980;
Wilcots & Prescott 2004) is puzzling. We should consider a different explanation for the offsets seen in some galaxies. One suggested origin is the interaction with ‘dark’ satel-lites, with no or very few stars (Bekki 2009). Another plau-sible explanation is the asymmetry of the dark matter halo (Levine & Sparke 1998) or the misalignment between the stars and the dark matter halo. The dark matter halo is far more massive and more extended than the galactic disc, thus it is more susceptible to distortions. If galaxy inter-actions are common, we should expect them to primarily have an effect on the dark matter haloes. Lopsided haloes may also form via the accretion of dark matter following the cosmological perturbations. The dynamics of stars in a galactic disc as a response to a perturbed halo potential has been studied byJog (1997) and Jog (1999) and has been shown to lead to lopsided discs, such as the discs of M101 and NGC1637 (Sandage 1961). Since we find a correlation between the off-centre bars and the galaxies being lopsided, the asymmetries in the dark matter halo could also lead to the observed offsets and this might explain the missing com-panions. With future observations of the kinematics of these galaxies with resolved integral field spectroscopy, such as the MaNGA survey (SDSS Collaboration et al. 2016), we will be able to directly determine the dynamical centre of the galax-ies and this could shed light on the mass distribution of the galactic halo.
6 CONCLUSION
that these offsets trace minor interactions, however, we do not find statistically significant evidence of a correlation with the nearest companions, even though the measured physical offsets match the predicted values from simulations of tidal interactions. This could be due to the incompleteness of the SDSS spectroscopic survey at the faint flux limit and ob-servations of possible companion candidates should be done in order to confirm their spectroscopic redshifts. Many iso-lated galaxies show evidence of an offset bar, which cannot be attributed to a dwarf-dwarf interaction. Other possible explanations for the offset should also be considered, such as an interaction with a dark matter subhalo or an asym-metry in the dark matter distribution in the halo.
ACKNOWLEDGEMENTS
The authors would like to thank the anonymous referee for their helpful and thoughtful comments. The authors would also like to thank C. Jog for the insightful discussion on the alternative scenarios that can give rise to off-centre bars.
SJK acknowledges funding from the Science and Technology Facilities Council (STFC) Grant Code ST/MJ0371X/1. KS acknowledges support from Swiss National Science Foundation Grants PP00P2 138979 and PP00P2 166159. RJS acknowledges funding from the STFC Grant Code ST/K502236/1. Support for this work was provided by the National Aeronautics and Space Administration through Einstein Postdoctoral Fellowship Award Number PF5-160143 issued by the Chandra X-ray Observatory Center, which is operated by the Smithsonian Astrophysical Observatory for and on behalf of the Na-tional Aeronautics Space Administration under contract NAS8-03060.
The development of Galaxy Zoo was supported in part by the Alfred P. Sloan Foundation and by The Leverhulme Trust.
Funding for the SDSS and SDSS-II has been provided by the Alfred P. Sloan Foundation, the Participating In-stitutions, the National Science Foundation, the US De-partment of Energy, the National Aeronautics and Space Administration, the Japanese Monbukagakusho, the Max Planck Society, and the Higher Education Funding Council for England. The SDSS website is http://www.sdss.org/. The SDSS is managed by the Astrophysical Research Con-sortium for the Participating Institutions. The Participat-ing Institutions are the American Museum of Natural His-tory, Astrophysical Institute Potsdam, University of Basel, University of Cambridge, Case Western Reserve Univer-sity, University of Chicago, Drexel UniverUniver-sity, Fermilab, the Institute for Advanced Study, the Japan Participation Group, Johns Hopkins University, the Joint Institute for Nuclear Astrophysics, the Kavli Institute for Particle As-trophysics and Cosmology, the Korean Scientist Group, the Chinese Academy of Sciences (LAMOST), Los Alamos Na-tional Laboratory, the Max-PlanckInstitute for Astronomy (MPIA), the Max-Planck-Institute for Astrophysics (MPA), New Mexico State University, Ohio State University, Uni-versity of Pittsburgh, UniUni-versity of Portsmouth, Princeton University, the United States Naval Observatory and the University of Washington.
This research made use of NASA’s Astrophysics Data
System Bibliographic Services. This work made extensive use ofastroPy4, a community-developed core Python pack-age for Astronomy (Astropy Collaboration et al. 2013) and of the Tool for Operations on Catalogues And Tables, (TOP-CAT5;Taylor 2005).
REFERENCES
Abazajian K. N., et al., 2009,ApJS,182, 543 Astropy Collaboration et al., 2013,A&A,558, A33
Athanassoula E., 1996, in Buta R., Crocker D. A., Elmegreen B. G., eds, Astronomical Society of the Pacific Conference Series Vol. 91, IAU Colloq. 157: Barred Galaxies. p. 309 Athanassoula E., Puerari I., Bosma A., 1997,MNRAS,286, 284 Athanassoula E., Machado R. E. G., Rodionov S. A., 2013,
MN-RAS,429, 1949
Bamford S. P., H¨außler B., Rojas A., Borch A., 2011, in Evans I. N., Accomazzi A., Mink D. J., Rots A. H., eds, Astronomical Society of the Pacific Conference Series Vol. 442, Astronomical Data Analysis Software and Systems XX. p. 479
Barton E. J., Geller M. J., Kenyon S. J., 2000,ApJ,530, 660 Beale J. S., Davies R. D., 1969,Nature,221, 531
Bekki K., 2009,MNRAS,393, L60
Berentzen I., Athanassoula E., Heller C. H., Fricke K. J., 2003, MNRAS,341, 343
Bertin E., Arnouts S., 1996,A&AS,117, 393
Besla G., Kallivayalil N., Hernquist L., van der Marel R. P., Cox T. J., Kereˇs D., 2012,MNRAS,421, 2109
Bournaud F., Combes F., Jog C. J., Puerari I., 2005,A&A,438, 507
Bramich D. M., Freudling W., 2012,MNRAS,424, 1584 Brinchmann J., Charlot S., White S. D. M., Tremonti C.,
Kauff-mann G., Heckman T., BrinkKauff-mann J., 2004, MNRAS,351, 1151
Casteels K. R. V., et al., 2013,MNRAS,429, 1051 Darg D. W., et al., 2010,MNRAS,401, 1043
Driver S. P., Popescu C. C., Tuffs R. J., Graham A. W., Liske J., Baldry I., 2008,ApJ,678, L101
Ellison S. L., Patton D. R., Simard L., McConnachie A. W., 2008, AJ,135, 1877
Feitzinger J. V., 1980,Space Sci. Rev.,27, 35
Gadotti D. A., Athanassoula E., Carrasco L., Bosma A., de Souza R. E., Recillas E., 2007,MNRAS,381, 943
H¨aussler B., et al., 2007,ApJS,172, 615 H¨außler B., et al., 2013,MNRAS,430, 330 Jarosik N., et al., 2011,ApJS,192, 14 Jog C. J., 1997, ApJ,488, 642 Jog C. J., 1999,ApJ,522, 661
Jog C. J., Combes F., 2009,Phys. Rep.,471, 75 Kauffmann G., et al., 2003a,MNRAS,341, 33 Kauffmann G., et al., 2003b,MNRAS,341, 54 Kaviraj S., 2014,MNRAS,440, 2944
Kim T., et al., 2015,ApJ,799, 99
Kormendy J., Kennicutt Jr. R. C., 2004,ARA&A,42, 603 Levine S. E., Sparke L. S., 1998,ApJ,496, L13
Licquia T. C., Newman J. A., 2015,ApJ,806, 96 Lintott C. J., et al., 2008,MNRAS,389, 1179 Lintott C., et al., 2011,MNRAS,410, 166
Liu L., Gerke B. F., Wechsler R. H., Behroozi P. S., Busha M. T., 2011,ApJ,733, 62
Martig M., Bournaud F., Teyssier R., Dekel A., 2009,ApJ,707, 250
4 http://www.astropy.org/
Martin P., Roy J.-R., 1995,ApJ,445, 161 Masters K. L., et al., 2011,MNRAS,411, 2026 Masters K. L., et al., 2012,MNRAS,424, 2180 Nair P. B., Abraham R. G., 2010,ApJS,186, 427
Noordermeer E., Sparke L. S., Levine S. E., 2001,MNRAS,328, 1064
Odewahn S. C., 1994,AJ,107, 1320
Pardy S. A., D. Onghia E., Athanassoula E., Wilcots E. M., Sheth K., 2016,ApJ,827, 149
Patton D. R., Torrey P., Ellison S. L., Mendel J. T., Scudder J. M., 2013,MNRAS,433, L59
Patton D. R., Qamar F. D., Ellison S. L., Bluck A. F. L., Simard L., Mendel J. T., Moreno J., Torrey P., 2016,MNRAS,461, 2589
Peng C. Y., Ho L. C., Impey C. D., Rix H.-W., 2010, AJ,139, 2097
Robotham A. S. G., et al., 2012,MNRAS,424, 1448
SDSS Collaboration et al., 2016, preprint, (arXiv:1608.02013) Sandage A., 1961, The Hubble atlas of galaxies
Schlegel D. J., Finkbeiner D. P., Davis M., 1998,ApJ,500, 525 Schlegel D. J., et al., 2015, in American Astronomical Society
Meeting Abstracts. p. 336.07
Sellwood J. A., 2014,Reviews of Modern Physics,86, 1 Sellwood J. A., Wilkinson A., 1993, Reports on Progress in
Physics,56, 173
Sheth K., et al., 2008,ApJ,675, 1141
Simmons B. D., et al., 2013,MNRAS,429, 2199
Stanimirovi´c S., Staveley-Smith L., Jones P. A., 2004,ApJ,604, 176
Stoughton C., et al., 2002,AJ,123, 485 Strauss M. A., et al., 2002,AJ,124, 1810
Taylor M. B., 2005, in Shopbell P., Britton M., Ebert R., eds, Astronomical Society of the Pacific Conference Series Vol. 347, Astronomical Data Analysis Software and Systems XIV. p. 29 Vika M., Bamford S. P., H¨außler B., Rojas A. L., 2014,MNRAS,
444, 3603
Walker I. R., Mihos J. C., Hernquist L., 1996,ApJ,460, 121 Wilcots E. M., Prescott M. K. M., 2004,AJ,127, 1900 Willett K. W., et al., 2013,MNRAS,435, 2835 York D. G., et al., 2000,AJ,120, 1579 Yozin C., Bekki K., 2014,MNRAS,439, 1948 Zaritsky D., Rix H.-W., 1997, ApJ,477, 118 Zaritsky D., et al., 2013,ApJ,772, 135 Zhao H., Evans N. W., 2000,ApJ,545, L35 Zou Y., Shen J., Li Z.-Y., 2014,ApJ,791, 11 de Swardt B., et al., 2015,ApJ,808, 90 de Vaucouleurs G., 1955,AJ,60, 126
de Vaucouleurs G., Freeman K. C., 1972,Vistas in Astronomy, 14, 163
van der Marel R. P., 2001,AJ,122, 1827
van der Marel R. P., Alves D. R., Hardy E., Suntzeff N. B., 2002, AJ,124, 2639