www.ann-geophys.net/29/2031/2011/ doi:10.5194/angeo-29-2031-2011
© Author(s) 2011. CC Attribution 3.0 License.
Annales
Geophysicae
Substorms during different storm phases
N. Partamies1, L. Juusola1, E. Tanskanen1,2, K. Kauristie1, J. M. Weygand3, and Y. Ogawa4 1Finnish Meteorological Institute, Helsinki, Finland
2University of Bergen, Bergen, Norway 3University of California, Los Angeles, USA 4National Institute of Polar Research, Tokyo, Japan
Received: 15 March 2011 – Revised: 18 August 2011 – Accepted: 3 October 2011 – Published: 17 November 2011
Abstract. After the deep solar minimum at the end of the so-lar cycle 23, a small magnetic storm occurred on 20–26 Jan-uary 2010. The Dst (disturbance storm time) index reached the minimum of−38 nT on 20 January and the prolonged re-covery that followed the main phase that lasted for about 6 days. In this study, we concentrate on three substorms that took place (1) just prior to the storm, (2) during the main phase of the storm, and (3) at the end of the recovery of the storm. We analyse the solar wind conditions from the so-lar wind monitoring spacecraft, the duration and intensity of the substorm events as well as the behaviour of the electro-jet currents from the ground magnetometer measurements. We compare the precipitation characteristics of the three sub-storms.
The results show that the F-region electron density en-hancements and dominant green and red auroral emission of the substorm activity during the storm recovery resembles average isolated substorm precipitation. However, the energy dissipated, even at the very end of a prolonged storm recov-ery, is very large compared to the typical energy content of isolated substorms. In the case studied here, the dissipation of the excess energy is observed over a 3-h long period of several consecutive substorm intensifications. Our findings suggest that the substorm energy dissipation varies between the storm phases.
Keywords. Magnetospheric physics (Magnetosphere-ionosphere interactions; Solar wind-magnetosphere interac-tions; Storms and substorms)
Correspondence to: N. Partamies
1 Introduction
As magnetic storms and substorms were identified very early on in the 1970s (McPherron, 1970), the substorms were rec-ognized as not only one of the main mechanisms for trans-porting energy from the magnetotail into the ionosphere, but also for dissipating the storm energy. However, the re-lationship between the storms and substorms is still rather poorly known, and how exactly the isolated quiet time sub-storms differ from the storm-time substorm activity is not very well understood. This is mainly due to the ease of study-ing quiet time substorms without the interference of other disturbances, as compared to the complex storm-time activa-tions that are also named substorms but have not been char-acterised in detail.
shorter than the mean value of 3 h for all 11 years. The length of the substorm period also increased slightly towards the year 2003. The average substorm duration in 2003 represents the average duration of substorms during solar maximum. A similar time cadence of 2–3 h has been reported as the sub-storm recurrence rate (e.g. Borovsky et al., 1993; Pulkkinen et al., 2007).
The repetitive substorms are often related to magnetic storms. The storms are longer-term geomagnetic activity periods for which Dst index reaches a minimum of at least
−40 nT (Kallio et al., 2000). An early storm model by Gon-zalez et al. (1994) examines the ring current enhancement, as measured by Dst index, with a superposition of a num-ber of substorm disturbances. This simple formulation re-sults in a conclusion that, apart from the most intense and frequent substorms taking place during storm main phases (the interval of largest decrease of Dst index), there are no apparent differences between quiet time and storm-time sub-storms. The storm initial phase is often believed to start with a solar wind trigger, which for intense storms tends to be an interplanetary shock front. The storm main phase is typically accompanied by sustained southward Interplanetary Mag-netic Field (IMF), and the storm recovery phase lasts until the magnetosphere has returned to nominal conditions and dissipated most of the excess energy delivered by the solar wind.
The main solar wind drivers of geomagnetic storms are Interplanetary Coronal Mass Ejections (ICME), and High-Speed Streams (HSS) and Co-rotating Interaction Regions (CIR). While a CIR forms a shock in the solar wind, it is typically followed by a HSS. CMEs are more frequent dur-ing high solar activity. HSS/CIR drivers are associated with coronal holes, and they are the dominant drivers of geomag-netic disturbances in the declining phase of the solar cycle (e.g. Tsurutani et al., 2006, and references therein). Long-lived coronal holes result in recurring geomagnetic activity with the period of the solar rotation (about 27 days). The geomagnetic activity induced by CMEs is typically more intense (more negative Dst), while HSS/CIR driven distur-bances are weak to moderate but long-lasting (Turner et al., 2009; Denton et al., 2006). However, as demonstrated by Turner et al. (2009), the CIR caused storms are more geoef-ficient as compared with CME driven activity. In particular, ionospheric dissipation has a more pronounced role in the en-ergy partitioning during the CIR storms (higher Kp/AE) than during the CME storms. At the Earth’s distance from the Sun, the evolving CIRs are often called stream interfaces or CIR stream interfaces (Gosling et al., 1978). In the declining phase of the solar cycle, the occurrence of stream interfaces has been shown to correlate with the occurrence of Steady Magnetospheric Convection (SMC) events, so that the maxi-mum in SMC occurrence takes place about 0.5–1 days after the stream interface encounter (Kissinger et al., 2011).
While the concept of an isolated substorm is widely stud-ied, the least investigated aspect is the more complex activity
during geomagnetic storms. The higher level of global activ-ity (measured by Kp or Dst) during storms makes it difficult to identify some of the aspects associated with isolated sub-storms. Comparison of isolated and storm-time substorms by Tanskanen et al. (2002a) showed that the storm-time sub-storms consume about three times as much energy as the isolated substorms do. The energy dissipation was inves-tigated in terms of ionospheric Joule heating that averaged to 0.3×10¹⁵J for the isolated events and 1.0×10¹⁵J for the storm-time events. However, the large storm-time Joule heating value only accounts for about 1/5 of the total energy consumption of the storm-time substorm, while the corre-sponding fraction for the isolated substorms is 1/3. From this finding it follows that isolated substorms tend to be less intense but use the available solar wind energy more effi-ciently. The mean magnetic deflection of the isolated sub-storms in 1997 and 1999 was found to be−350 nT, while the yearly average values range from−300 to−500 nT. The typ-ical intensity (maximum deflection of the IL index) of storm-time substorm events was−670 nT, with a full range from
−200 to−1800 nT (Tanskanen et al., 2002b). During the so-lar minimum years 1997 and 1999, isolated substorms were five times as frequent as storm-time substorms. All exam-ined substorms lasted about 4 h on average. Since the storm event studied in this paper took place only a year after the solar minimum, the statistical results of the years 1997 and 1999 around the previous solar minimum provide realistic reference values for our results.
An investigation of global auroral activity during storm-time substorms (Hoffman et al., 2010) utilized the Visible Imaging System (VIS, Frank et al., 1995) and the Ultravi-olet Imaging System (UVI, Torr et al., 1995) on the Polar spacecraft to characterise the differences between isolated and storm-time substorms. It was found that the storm-time substorm onsets occur, on average, at about 4 degrees lower latitudes than the isolated substorms. The storm-time events experienced an average expansion phase of 15 min, while isolated substorm expansions typically went on for about 30 min. The auroral emission intensity during storm-time events was approximately twice that of the isolated events.
1 2 3
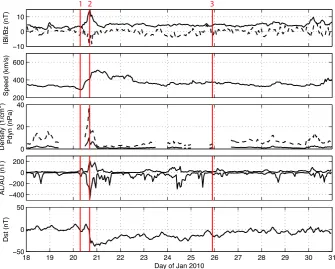
Fig. 1. Solar wind and global indices during 13 days of January 2010. Panels from top to bottom: IMF magnitude and IMFBZcomponent
(dashed line), solar wind speed, dynamic pressure and number density (dashed line), AL/AU indices, and Dst index. Red vertical lines mark the substorm events examined in this study with the corresponding substorm number on the top.
loading-unloading cycles (substorms and sawtooth events) are more likely to occur, while slower solar wind tends to drive SMC activity. SMCs and isolated substorms were also found to use the solar wind energy more efficiently than the more intensely driven events.
What remains mostly uncharacterised are the substorm properties during different storm phases. This question mo-tivates our study. We examine a single small magnetic storm after a prolonged solar minimum in which we identify three substorms: pre-storm (substorm 1), main phase (substorm 2) and recovery (substorm 3). We consider this small storm to be indicative of a state between quiet time and typical storm-time geomagnetic activity.
2 Event and data descriptions
We analyse three substorms during a magnetic mini-storm in January 2010. The latest solar minimum (cycle 23) was long-lasting and extremely quiet (Pulkkinen et al., 2011). The first storm of the rising phase was weak, with the Dst minimum of−38 nT (Fig. 1). This Dst minimum falls just short of the Dst definition of a storm (Dst≤ −40 nT). Thus it can be de-scribed as a small magnetic storm, or magnetic mini-storm. However, this mini-storm in January 2010 appears to have had an extremely long recovery that lasted about 6 days in-stead of the nominal 1–3 day duration. We define the storm
to have lasted until Dst levelled to its pstorm value or re-covered at least 80 % of its minimum (Dst>−8 nT) on 26– 27 January. The slow recovery of the Dst index during mag-netic storms during solar minimum has already been reported by Tsurutani and Gonzalez (1997). They concluded that the frequent particle injections during prolonged intervals of in-tense auroral electrojet activity prohibits the ring current de-cay.
As is often true for geomagnetic disturbances during the quiet years of the solar activity, the mini-storm is related to the solar wind stream from a coronal hole. The time evolu-tion of the IMF magnitude and its Z-component, solar wind speed, density and pressure are shown in top panels of Fig. 1. An enhancement of IMF magnitude, solar wind pressure and density closely followed by an increase of the solar wind speed at the beginning of the mini-storm is a signature of a stream interface compression region. Stream interfaces where the faster stream from the coronal hole interacts with the slower flow are typically observed at the Earth’s distance from the Sun instead of a fully developed CIR (Tsurutani et al., 2006). The timing of the compression suggests that the mini-storm main phase was triggered by this stream inter-face.
3/2
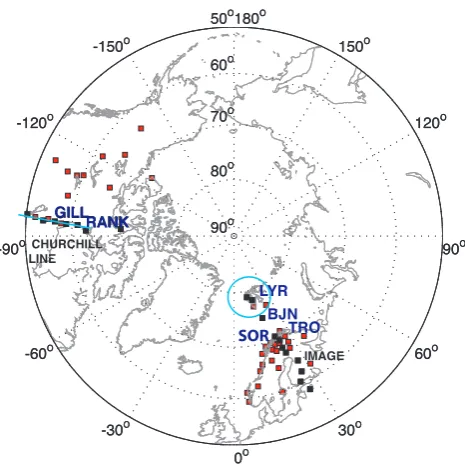
Fig. 2. Meridionally selected magnetometer stations of the IMAGE and CARISMA networks (black diamonds) that were used for the calculations of 1-D equivalent currents are plotted on the map. The meridional CARISMA line is frequently referred to as the Churchill line. Red and black diamonds together mark the stations of IMAGE and CARISMA networks (all available) that were used to calculate the local electrojet indices IL/IU and CL/CU, respectively. The opti-cal and radar stations used in this study are labelled. The cyan circle and line mark the fields-of-view of an all-sky camera and meridian scanning photometer that are also used in this study. Stations that are closest to the onset locations and that are mentioned in the text are also labelled on the map.
point in the upstream solar wind with the temporal resolu-tion of 64 s. The dynamic pressure and epsilon parameter (Perreault and Akasofu, 1978) as a measure of the solar wind energy input are calculated from these measurements. All ACE data have been propagated to the magnetopause (to the distance of 10REupstream of the Earth) using the upstream distance of the spacecraft from the magnetopause and the av-erage radial component of the solar wind (VX) during the interval of interest.
The geomagnetic equatorial Dst index is used to iden-tify and characterise the mini-storm and its time evolution. Ground magnetic field recordings from International Moni-tor for Auroral Geomagnetic Effects (IMAGE, Viljanen and H¨akkinen, 1997) are analysed for the substorm events on the European side, and Canadian Array for Realtime Inves-tigations of Magnetic Activity (CARISMA, formerly known as CANOPUS Rostoker et al. (1995)) for the event in the North-American sector. These data are used to calculate the local electrojet indices, IL/IU for IMAGE and CL/CU for CARISMA, as well as to estimate the ionospheric equiva-lent currents in the substorm activity region. IMAGE chain
has a limited local time coverage, while CARISMA’s station density (spatial recolution) is low. We selected events where the onsets occurred close to a single magnetometer station. Some uncertainty is still inevitable in determining the onset time and location.
One-dimensional electrojet current density has been de-termined by a method of spherical elementary current sys-tems (Vanham¨aki et al., 2003). Magnetometer stations of IMAGE and CARISMA, which were used in 1-D equivalent current calculations, are shown (black diamonds) on the map in Fig. 2. Also marked are all the other local electrojet in-dex stations (red diamonds). The optical and radar stations mentioned in the text have also been labeled on the map.
We use 2-D equivalent current maps of the substorm on-set regions to infer the equivalent current pattern around the activity region (Amm, 1997; Amm and Viljanen, 1999; Wey-gand et al., 2011). On the North-American side (for sub-storm 1) the method utilises CARISMA, STEP Polar Net-work, Time History of Events and Macroscale Interactions during Substorms (THEMIS), Greenland, Magnetometer Ar-ray for Cusp and Cleft (MACCS, Northern Canada (Enge-bretson et al., 1995)) and Canadian Magnetic Observatory System (CANMOS Eastern Canada) data. Due to the very different scales and station densities of the Fennoscandian and North-American arrays, the resulting 2-D current maps also have different spatial resolutions. The purpose of the 2-D current maps is to provide the large-scale current con-figuration and is not meant to give detailed insight into the flows.
Particle precipitation during the substorms are evaluated from the European Incoherent Scatter (EISCAT) UHF radar measurements at Tromsø and Longyearbyen, Svalbard. Au-roral emission intensity is measured by the Magnetometers – Ionospheric Radars – All-sky Cameras Large Experiment (MIRACLE, Syrj¨asuo et al., 1998) auroral cameras, and the NORthern Solar Terrestrial ARray (NORSTAR, Donovan et al., 2003) Meridian Scanning Photometer (MSP) at Gillam. These data are used whenever available.
For each of the substorms we also examined the Super Dual Auroral Radar Network (Greenwald et al., 1995) iono-spheric convection data at the location of the activity. We specifically identified the separation between the Harang re-versal region and the substorm onset. Here, we refer the midnight transition region between the dusk and dawn cell as Harang reversal. The plasma flow maps are not shown in this study.
ï500 0 500
CL/CU (nT)
ï1 0 1
Total EQ current (MA)
UT
Glat
05 06 07 08 09 10 11 12 13
55 60 65 70
mA/m
ï600
ï400
[image:5.595.312.545.62.184.2]ï200 0 200
Fig. 3. Ground-based measurements during the pre-storm substorm (substorm 1) as a function of Universal Time. Panels from top to bottom: (1) Auroral electrojet index (upper and lower) calculated from the Churchill line of the CARISMA chain, (2) strength of the total electrojet currents (eastward positive, westward negative) esti-mated from the magnetometer data, and (3) electrojet current den-sity deduced from magnetometer recordings by 1-D upward con-tinuation method (green/blue colours for westward and yellow/red colours for eastward).
the radar data are not used for timing purposes of the sub-storm onsets but only to probe the expansion related precipi-tation.
We identify the substorm onsets from the magnetometer data as abrupt decreases of the X-component. The latitude of the station that shows this signature first is taken as the latitude of the onset. The time of this onset signature is used to calculate the substorm onset time in Magnetic Local Time (MLT). We define the period prior to the substorm on-set where the magnetic X-component of the corresponding station slowly decreases as the growth phase, which is not limited in duration. The recovery phase lasts until the mag-netic X-component has returned to its pre-substorm level or at least 80 % of theBXminimum.
Many studies use the southward turning of the IMFBZ as an indicator of the beginning of the growth phase. That approach gives a good global estimate for the substorm on-set. This does not hold for all substorms since some sub-storms occur during northward IMF (Hsu and McPherron, 2003; Kullen and Karlsson, 2004). All three substorms of the present study are associated with more typical southward IMF conditions. Furthermore, our definitions of substorm phases only use ground-based data and thus, we look for sub-storm signatures in the auroral ionosphere rather than in the magnetosphere. Manual detection of the substorm phases al-ways implies uncertainties of the order of several minutes depending on the data and the criteria. Different definitions should be thoroughly investigated in a future study. The
du-20 Jan du-2010 07:05:00 UT
A/km2
50o
60o
70o
80o
−150o
−120o −90o
−60o
870 A/km −0.8
[image:5.595.50.288.62.243.2]−0.6 −0.4 −0.2 0 0.2 0.4 0.6 0.8
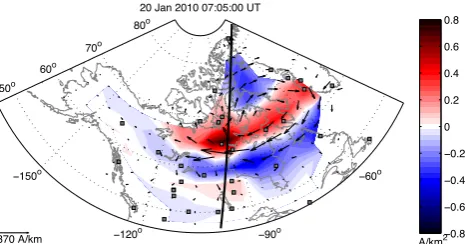
Fig. 4. Horizontal distribution of equivalent currents (black vectors) from the THEMIS, CARISMA, CANMOS, MACCS and Greenland magnetometer data during substorm 1. The blue and red colours in-dicate FAC density up and down, respectively, estimated from the vorticity of the horizontal currents. The strongest currents occurred around the midnight meridian (black line) in the vicinity of the Ha-rang reversal region at 07:05 UT. Gray squares mark the CARISMA magnetometer stations.
rations of the substorm phases in this paper are only meant to give an order of magnitude estimate. It is not our goal to precisely identify the substorm phases; however, we use the same identification method for each substorm in order to be able to compare specific quantities.
2.1 Event 1: pre-storm substorm
About 10 h prior to the beginning of the mini-storm main phase, a clear isolated average-sized substorm was observed at Rankin Inlet (RANK, 62.8◦GLAT and 72.2◦CGMLAT) in the Canadian sector on 20 January 2010. The onset took place at about 07:00 UT after an approximate three-hour long growth phase. The maximum negative deflection in the ground magnetic X-component was −350 nT during a 20–30 min long expansion phase, followed by a recovery of about 2.5 h.
Ground-based measurements of indices and currents dur-ing event 1 are displayed in Fig. 3. The maximum westward electrojet current density reached 700 mA m−1 and resided around the geographic latitude of about 63◦but widened to
cover about 10◦ in latitude (bottom panel). The maximum
Zenith angle
470.9 nm
ï50
0 50
Intensity (R)
0 50 100
Zenith angle
557.7 nm
ï50
0 50
Intensity (R)
0 500 1000
UT
Zenith angle
630.0 nm
03 04 05 06 07 08 09 10
ï50
0 50
Intensity (R)
0 200 400 600
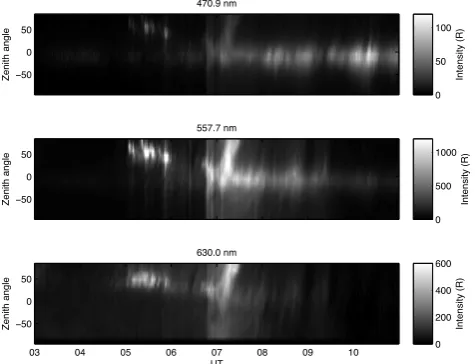
Fig. 5. MSP measurements at Gillam during substorm 1. Dis-played auroral emissions have been captured at the wavelengths of 470.9 nm (top), 557.7 nm (middle) and 630.0 nm (bottom). The negative zenith angles are towards the south and positive towards the north (top of the panel).
Optical data were available from a NORSTAR Meridian Scanning Photometer (MSP) at Gillam (Fig. 5), which is lo-cated on the Churchill line south of RANK at 56.4◦GLAT.
The MSP monitors auroral emissions at 557.7 nm (green), 630.0 nm (red), 486.1 nm (proton, not shown) and 470.9 nm (blue) wavelength along north-south scans. Assuming an emission altitude of 110 km, its FoV extends roughly from 49 to 63 GLAT (60–73 CGMLAT) with a time resolution of 30 s. Thus, the northern leg of the scan recorded the expan-sion phase aurora above RANK. The peak emisexpan-sion intensi-ties were up to 1.3 kR for the green emission, about 500 R for the red emission and about 60 R for the blue line. Emission intensity ratios are often used to infer how hard or soft the precipitation is, or even to calculate the characteristic precip-itation energies (e.g. Rees and Luckey, 1974). In this study, we only consider the relative intensities of different wave-lengths. The rather weak blue emission (1/10 the intensity of the red emission and 1/20 that of the green line emission intensity) suggests primarily soft electron precipitation even during the substorm expansion phase.
No signature of an external triggering could be found in the solar wind or IMF parameters. The solar wind speed was steady and slow around 300 km s−1for at least 3 h before and after the substorm onset. Furthermore, IMF BZ remained almost constant between the−3 to−2 nT for at least 1.5 h before and after the onset time. Density or dynamic pressure measurements were not available for this time period, but all the available measured parameters were stable and within the average value range.
−1500
−1000
−500 0 500
IL/IU (nT)
−1 0 1
Total EQ current (MA)
UT
Glat
15 16 17 18 19 20 21 22
60 70 80
mA/m
−4000
[image:6.595.309.547.61.230.2]−2000 0 2000
Fig. 6. Ground-based measurements during the storm main phase substorm (substorm 2) as a function of Universal Time. Panels from top to bottom: (1) auroral electrojet index (upper and lower) calcu-lated from the IMAGE network, (2) strength of the total electro-jet currents (eastward positive, westward negative) estimated from the magnetometer data, and (3) electrojet current density deduced from magnetometer recordings by 1-D upward continuation method (green/blue colours for westward and yellow/red colours for east-ward).
2.2 Event 2: main phase substorm
The second substorm took place in the Fennoscandian sec-tor at the very beginning of the mini-ssec-torm main phase. The fastest decrease of the Dst index took place during the storm main phase at 17:00–18:00 UT. The growth of substorm 2 be-gan 2.3 h prior to the onset at∼16:40 UT. This was followed by an expansion phase of about 35 min and a recovery phase of about 1.8 h. The maximum negative deflection of ground magneticBXcomponent was about 830 nT at Sørøya (SOR, 70.5◦ GLAT and 67.3◦ CGMLAT) station in the IMAGE chain. The maximum intensity was more than double the in-tensity of substorm 1. Ground-based measurements similar to Fig. 3 are plotted in Fig. 6. The westward electrojet current reached the maximum current density of about 3.5 A m−1 (bottom panel). Also, an extensive poleward expansion of the westward electrojet was observed at substorm onset from the latitude of 70◦to the latitude of 78◦(bottom panel). The east-ward current intensified to∼1.5 A m−1and expanded a few degrees equatorward at the end of the substorm growth phase. The separation of the maximum eastward and westward cur-rents was almost 10◦ in latitude, and the eastward current
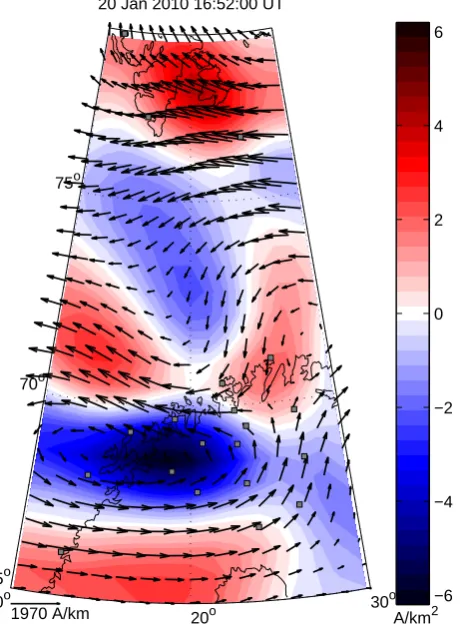
[image:6.595.49.287.64.246.2]20 Jan 2010 16:52:00 UT
A/km2 65o
70o 75o
10o
20o
30o 1970 A/km
[image:7.595.301.546.63.250.2]−6 −4 −2 0 2 4 6
Fig. 7. Horizontal distribution of equivalent currents (black vectors) from the IMAGE magnetometer data during substorm 2. The blue and red colours indicate FAC density up and down, respectively, estimated as the vorticity of the horizontal currents. The strongest currents occurred in the onset region at 16:52 UT.
more complex than in the case of substorm 1. However, this is due to the better spatial resolution provided by the higher magnetometer station density of Fennoscandia. Ac-cording to the vorticity estimate, the strongest upward FAC region during the substorm expansion was situated just south of the onset location. Some FACs in Fig. 7 can be due to the sparsely monitored region of the Arctic Ocean or the model area boundaries, but the strongest FACs occur over mainland, within good station coverage.
Optical data were available from a MIRACLE ASC in Longyearbyen on Svalbard. The station is located at the poleward boundary of the auroral oval but based on the 1-D equivalent current data (bottom panels of Fig. 6), the expan-sion reached the Svalbard latitudes (Longyearbyen at 78◦)
in less than 10 min. Calibrated auroral intensities were not available for this time period, but the digital units (counts) for different emissions peaked at 255 (saturation) for green line, 180 for blue emission and 80 for red line, as shown in Fig. 8. In this event, the relative brightness of blue emission (over 2/3 of the green and more than twice as much as the red emission) is higher than in the case of substorm 1. This
sug-Zenith angle
427.8 nm
ï50 0 50
Intensity (ADU)
0 50 100
Zenith angle
557.7 nm
ï50 0 50
Intensity (ADU)
0 50 100 150 200
UT
Zenith angle
630.0 nm
15 16 17 18 19 20 21 22
ï50 0 50
Intensity (ADU)
[image:7.595.57.288.66.383.2]0 50 100
Fig. 8. ASC keograms from LYR station during substorm 2. Auro-ral emissions have been captured at the wavelengths of 427.8 nm
(top), 557.7 nm (middle) and 630.0 nm (bottom). The negative
zenith angles are towards the south and positive towards the north (top of the panel).
9.5 10 10.5 11 11.5 12 12.5
0 50 100 150 200 250 300 350 400
Log10(Ne)
Height (km)
Onset 4 min before 4 min after 8 min before 8 min after
Fig. 9. Ionospheric electron density profiles as recorded by the EIS-CAT Tromsø radar during the early part of the expansion phase of substorm 2. The solid black line is the electron density at the time when the precipitation reaches the radar beam at 16:48 UT. The red line is the electron density 4 min earlier, and red dots 8 min earlier. Blue line is the electron density profile 4 min after and blue dots 8 min after, respectively.
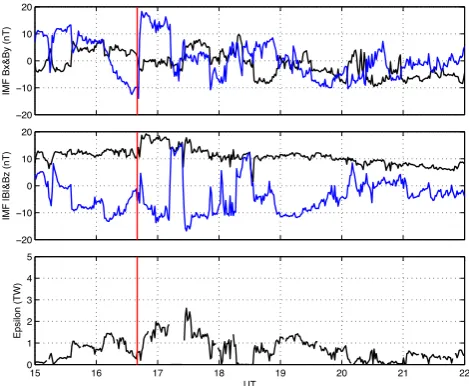
[image:7.595.310.544.336.520.2]−20 −10 0 10 20
IMF Bx&By (nT)
−20 −10 0 10 20
IMF |B|&Bz (nT)
15 16 17 18 19 20 21 22
0 1 2 3 4 5
Epsilon (TW)
[image:8.595.49.284.62.255.2]UT
Fig. 10. IMF and solar wind parameters for substorm 2 in the main
phase of the mini-storm. From the top to the bottom: (1) IMFBX
(black) andBY(blue), (2) IMF magnitude (black) andBZ
compo-nent (blue), and (3) epsilon parameter. The vertical red line marks the substorm onset time. These data are propagated to the
magne-topause (at 10RE) with the average solar wind velocity.
the onset precipitation reached the radar beam at 16:48 UT (black curve). The electron density peak remained in the E-region after the onset but the magnitude decayed within the next few minutes (blue curves). Several density enhance-ments were observed later during the day in accordance with the magnetic activity, but the most intense precipitation was captured during the substorm event 2. During the substorm onset, the electron density reached about 1012m−3.
Further analysis of the EISCAT TRO data shows that the average ionospheric Hall-to-Pedersen conductance ratio, α
during this substorm was 1.5. During the substorm onset,
α increased from 1 to 2 and then slowly decayed as the substorm recovery proceeded. The EISCAT Svalbard radar data suggests conductance ratios between 2.0–2.5 around the onset time. The conductances are integrated from 75 to 300 km altitude, and their calculations use a neutral atmo-spheric model MSIS2000 (Picone et al., 2002).
Prior to the onset time, the IMFBZhad been negative for about 1.5 h. At the onset time of substorm 2 (16:40 UT) the IMF BY component turned from negative to positive (1st panel in Fig. 10), the IMF magnitude increased and the
BZcomponent briefly increased about 10 nT, but did not re-main positive (2nd panel in Fig. 10). The dynamic pressure (solid line in the 2nd panel of Fig. 1) abruptly decreased by 5 nPa, producing a negative pressure impulse, while the so-lar wind speed increased by about 80 km s−1 (top panel in Fig. 1), but remained moderate. Unlike for the pre-storm substorm (event 1), the solar wind energy input to the mag-netosphere (epsilon, bottom panel of Fig. 10) increased for substorm 2 onset and exceeded the storm loading threshold (1 TW) (Akasofu, 1981).
−500 0 500
IL/IU (nT)
−1 0 1
Total EQ current (MA)
UT
Glat
20 21 22 23 24 01 02 03
60 70 80
mA/m
[image:8.595.310.547.63.231.2]−1000 −500 0
Fig. 11. Ground-based measurements during the storm recovery phase substorm (substorm 3) as a function of Universal Time. Pan-els from top to bottom: (1) auroral electrojet index (upper and lower) calculated from the IMAGE network, (2) strength of the total electrojet currents (eastward positive, westward negative) estimated from the magnetometer data, and (3) electrojet current density de-duced from magnetometer recordings by 1-D upward continuation method (green/blue colours for westward and yellow/red colours for eastward).
2.3 Event 3: storm recovery substorm
Five days later when the mini-storm recovery phase was coming to an end, we chose a third substorm, which we will refer to as a storm-recovery phase substorm. The onset of this substorm occurred at 21:50 UT on 25 January 2010. The strongest magnetic deviations were observed at the Bear Is-land (BJN, 74.5◦GLAT and 71.5◦CGMLAT) station of the IMAGE network, which was located right at the Harang re-versal region in the midnight sector. For this event, there was almost no growth phase at all according to the magnetogram from BJN station, and the expansion phase was composed of 4–5 substorm intensifications over 3 h. The minima of the in-tensifications during the expansion was only about−220 nT at most but no clear recovery was observed before midnight. The recovery phase, when it finally began, also lasted for about 3 h.
The ground-based data for substorm 3 is shown in Fig. 11 with the same format as for the substorms 1 and 2. The westward electrojet intensified up to about 600 mA m−1 in the vicinity of the onset latitude. The width of the enhanced westward current region varied between 5◦and 8◦in latitude
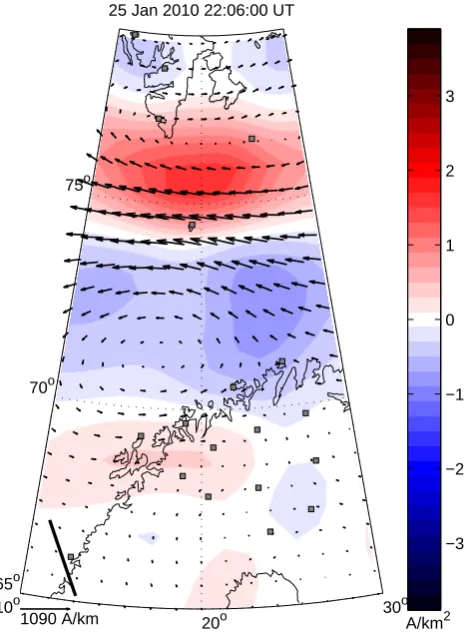
25 Jan 2010 22:06:00 UT
A/km2 65o
70o 75o
10o
20o
30o 1090 A/km
[image:9.595.303.545.61.245.2]−3 −2 −1 0 1 2 3
Fig. 12. Horizontal distribution of equivalent currents (black vec-tors) from the IMAGE magnetometer data during substorm 3. The blue and red colours indicate field-aligned current density up and down, respectively, estimated as the vorticity of the horizontal currents. The strongest currents occurred in the onset region at 22:06 UT.
Svalbard (anti-sunward flow) and the mainland. The region of substorm activity appeared in the sector just east of the midnight meridian (solid black line in the figure). The equiv-alent current pattern was simple during this onset compared to substorm 2.
No optical data were available for this event due to the cloud cover both over the mainland and the Svalbard sta-tions. EISCAT UHF radar in Tromsø recorded small pre-cipitation bursts at about 100 km in altitude between 13:00 and 16:00 UT. The more intense precipitation that began dur-ing the substorm onset, continued until midnight. At the be-ginning of the expansion phase, the radar probed the shear flow region between the oppositely directed electrojets. Fig-ure 13 illustrates that the peak altitude of the electron density occurred at around 110–120 km. The electron density peak remained around 5×10¹¹m−3and even the F-region values were half a magnitude lower than those observed during sub-storm 2.
The ionospheric conductance ratio α deduced from the EISCAT TRO data reached a maximum value of only 1.4
9.5 10 10.5 11 11.5 12 12.5
0 50 100 150 200 250 300 350 400
Log10(Ne)
Height (km)
[image:9.595.52.287.62.382.2]Onset 4 min before 4 min after 8 min before 8 min after
Fig. 13. Ionospheric electron density profiles as recorded by the EISCAT Tromsø radar at the onset of substorm 3. The solid black line is the electron density at the time when the radar beam encoun-tered the precipitation at 22:11 UT. The red curve shows the electron density 4 min earlier, and red dots 8 min earlier. The blue curve in-dicates the electron density profile 4 min after and blue dots 8 min after, respectively.
during this event. The average conductance ratio was 1.3. Typically this ratio ranges from 1 to 2. The observed differ-ence between the expansions of substorms 2 and 3 is 20 %. The conductance ratio calculated from the EISCAT Svalbard radar data was at 1.5–2.0 after 23:00 UT when the expansion reached the high Arctic. The ratio was also smaller than that observed with the radar during substorm 2.
The solar wind parameters (data not shown, apart from
VSW and pdyn in Fig. 1) for substorm 3 were very steady. The speed was slow and stable around 370–380 km s−1 for several hours, the dynamic pressure remained around 1 nPa for the whole activity period, and the IMFBZstayed at about
−3 nT for 1.5 h before and after the substorm onset. There were no obvious discontinuities in the solar wind during this substorm and the epsilon parameter did not exceed a typical substorm input level of 0.1 TW.
3 Event summary and discussion
The entire month of January 2010 was magnetically quiet apart from a mini-storm on 20 January through 26–27 Jan-uary when the Dst index reached its minimum of−38 nT on 20 January. The recovery of this mini-storm lasted about 6– 6.5 days. Table 1 summarizes the main parameters describ-ing the three substorm events analysed in this study.
substorm expansion phase showed an average substorm AL minimum of about−350 nT, and the maximum eastward cur-rent density was only 1/4 of the westward curcur-rent density. The red emission during this substorm appeared to be ten times as intense as the blue emission, suggesting very soft electron precipitation during the expansion phase.
According to the AE index, the most intense activity of the month occurred in the early evening of 20 January and was associated with our substorm 2. AE reached almost 1000 nT and AL decreased to about−700 nT just prior to the steepest decrease of Dst at 18:00 UT. The storm minimum value of
−38 nT was recorded a few hours later at 23:00 UT. During the couple of days prior to the storm onset, the Kp index was very low, close to zero, while at the mini-storm onset it rapidly increased to 4. A prolonged period of very quiet time before a CIR/HSS driven geomagnetic storm has been called the calm before the storm by, e.g. Borovsky and Steinberg (2006). The calms have been investigated as a way to pre-condition the magnetosphere for the storm, and affecting, for instance, the particle population of the outer magnetosphere and further the behaviour of the ring current.
The main phase substorm (substorm 2) was much more intense than the other two substorms studied here. The max-imum magnetic deflection was 2–3 times larger (∼ −800 nT) than for the other two events, and the electrojet current density maxima were approximately an order of magnitude larger than the maxima recorded during the other substorm events. Furthermore, this substorm began earlier in the MLT evening sector as compared to the two other events, and the largest ground deflections were recorded at lower magnetic latitudes during the storm than prior to it. Auroral precip-itation during the expansion phase of substorm 2 was very hard, judging by the intensity of the blue line emission seen in the all-sky camera data (twice as intense as the red line) and the large electron density maximum at the altitude of about 100 km as recoded by the EISCAT radar. Although the energy dissipation during the expansion phase was very in-tense, the substorm recovery phase lasted almost 2 h. Based on the EISCAT measurements, the electron density during the storm main phase was about twice the electron density during the storm recovery.
The energy input from the solar wind exceeded the storm loading threshold (1 TW) for substorm 2, while for the other two events it barely reached the substorm input threshold (0.1 TW). Substorm 2 was also the only one of our three events where a solar wind trigger was found. In the solar wind we observed a change in sign of the IMFBY compo-nent, an increase in magnitude of IMF and abruptly decreas-ing solar wind dynamic pressure, which is a signature of a stream interface (Gosling et al., 1978). The studies by Hsu and McPherron (2003) and Kullen et al. (2010) show that 50– 60 % of the substorms are associated with a potential IMF
BZorBYtrigger. Furthermore, large changes in the dynamic pressure (>7 nPa) are only responsible for a fraction (1–3 %) the largest substorms. As the most intense substorm events
often occur during magnetic storms, the pressure triggered group of substorms may be related to the geomagnetic storm main phases and the storm triggering.
Several substorms took place during the prolonged recov-ery of the mini-storm. We examined one of the last ones, which appeared as a 3-h burst of substorm intensifications. This peculiar substorm (substorm 3) had no real growth phase, an extensive expansion phase with multiple (4–5) in-tensifications and an equally long recovery phase. None of the substorm intensifications (∼ −220 nT) were particularly intense. This kind of prolonged activity in the auroral re-gion is characteristic for CIR/HSS storms during the solar minimum years (Tsurutani et al., 2006). During the recovery phase of a fully developed storm, a long-lived and intense recovery activity period can be referred to as High-Intensity Long-Duration Continuous AE Activity (HILDCAA, Tsuru-tani and Gonzalez, 1987). It was concluded that HILDCAA is driven by the Alfv´en wave activity (IMFBZfluctuations) in the high-speed solar wind. In the mini-storm case, the AE intensity criteria of HILDCAA are not fulfilled and the maxi-mum solar wind speed of about 500 km s−1does not, strictly speaking, qualify as HSS. But in the smaller scale the phe-nomenon is similar to the long-lasting electrojet activity and fluctuating IMFBZ.
Table 1. Summary of substorms 1, 2 and 3.
Pre-storm (1) Main phase (2) Recovery (3)
Max1BX −350 nT −830 nT −220 nT
Growtht 3 h 2.3 h 0 min
Expansiont 20–30 min 35 min 3 h
Recoveryt 2.5 h 1.8 h 3 h
Onset MLT 00:30 20:40 00:30
Onset Mlat 72.2◦ 67.3◦ 71.5◦
As required by the search criteria all three substorms dis-played were an enhancement of the auroral electrojets. For two of the substorms both the eastward and the westward cur-rents strengthened simultaneously, while during substorm 2 the eastward electrojet intensified earlier than the westward one. This may relate to the location of substorm 2 in the evening sector west of the Harang reversal region. The other two events occurred in the midnight sector just east of the Harang reversal.
One of the differences between isolated and storm-time substorms found by Hoffman et al. (2010) was that the storm-time auroral emission intensities are about double as com-pared to the emission intensities during isolated substorms. Our precipitation and emission measurements during the iso-lated pre-storm substorm and the storm recovery substorm both suggest soft particles as the dominant component. Be-cause the radar field-of-view is only of the order of one degree, there is the possibility that the ionospheric column within the radar field-of-view does not capture the strongest enhancements of electron density during the substorm. How-ever, as much as we can tell from the ground magnetic mea-surements, the expansion activity does pass over the radar site during substorms 2 and 3. Since we chose the elec-tron density profiles with highest peak values rather than the ones exactly at the onset time, the spatial uncertainty has been minimized. Unfortunately, optical auroral data were not available for all three events and thus, a direct comparison of the emission intensities was not possible.
4 Summary and conclusions
Three substorms, each during a different phase of a small geomagnetic storm on 20–26 January 2010, have been ex-amined and their characteristics compared. As summarised by the substorm key parameters in Table 1, the pre-storm event is an average isolated non-stormtime substorm, al-though above average in duration. As soon as the storm main phase started, the duration of the substorm activity decreased by about an hour and was significantly more intense due to the available solar wind energy. The main phase substorm 2 occurred a few degrees lower in latitude than the two other events. This substorm was directly driven by solar wind
en-ergy input that exceeded the storm loading threshold of 1 TW. The storm recovery phase substorm 3 was below average in intensity, but its expansion phase displayed multiple inten-sifications and was above average in duration, which sug-gests very intense Joule heating compared to the other events. This observation is in agreement with Tsurutani and Gonza-lez (1997) who reported that the slow recovery of a storm is a signature of a large energy storage of the magnetotail. New particle injections keep the substorm activity going and the ring current enhanced. As a result, the storm recovery is being delayed.
The pre-storm substorm (event 1) aurora was dominated by green and red emission with very weak blue emission component indicating mainly soft precipitation. The electron density profiles of event 3 that peaked above 100 km were also indicative of primarily soft electrons. Similarity of the weak blue emission line during the pre-storm substorm and precipitation characteristics during the storm recovery phase substorm suggest that the two substorms are associated with soft particle precipitation. However, the storm main phase substorm (event 2) included a very strong blue emission line and an intense electron density peak at the height of 100 km, implying both a high flux of precipitating electrons and the presence of a higher energy electron population.
While the auroral emission and precipitation observations are in agreement with Hoffman et al. (2010), the substorm expansion durations during the different phases of the storm differ from the Hoffman et al. (2010) averages. Both the pre-storm and the pre-storm main phase events in this study show an expansion phase of about 30 min, which is the average isolated substorm expansion phase duration in the study by Hoffman et al. (2010) and twice as long as their average sub-storm expansion time during a sub-storm main phase. The sub-storm recovery phase substorm (event 3) lasted longer than any of the substorms in 1993–2003 (Tanskanen, 2009). Because the solar wind energy input had ended earlier in the storm re-covery phase, the large amount of energy dissipated during the substorm intensifications of event 3 had to come from the magnetospheric storage.
Acknowledgements. We thank the institutes who maintain the
IM-AGE Magnetometer Array. The authors thank I. R. Mann and the CARISMA team for data. CARISMA is operated by the Univer-sity of Alberta, funded by the Canadian Space Agency. For the Greenland magnetometer data we thank J¨urgen Matzka from the Technical University of Denmark in Copenhagen. CANMOS data were provided by David Calp of Natural Resources Canada. For MACCS data the authors thank Augsburg College, US. Dst index data are downloaded from the World Data Center for Geomag-netism in Kyoto at http://wdc.kugi.kyoto-u.ac.jp. Operational sup-port for NORSTAR is provided by the Canadian Space Agency. We acknowledge the NORSTAR team for providing the meridian scan-ning photometer data used in this study.
The FMI authors acknowledge the financial support by the Academy of Finland, projects 115947, 128189, 128632, 108518 and 137900. The work of NP is supported by the Finnish Gradu-ate School in Astronomy and Space Physics.
Topical Editor R. Nakamura thanks J. W. Gjerloev and A. Kullen for their help in evaluating this paper.
References
Akasofu, S.-I.: Energy coupling between the solar wind and the magnetosphere, Space Sci. Rev., 28, 121–190, 1981.
Amm, O.: Ionospheric elementary current systems in spherical co-ordinates and their application, J. Geomagn. Geoelectr., 49, 947– 955, 1997.
Amm, O. and Viljanen, A.: Ionospheric disturbance magnetic field continuation from the ground to the ionosphere using spherical elementary current systems, Earth Planets Space, 51, 431–440, 1999.
Borovsky, J. E. and Steinberg, J. T.: The “calm before the storm” in CIR/magnetosphere interactions: Occurrence statistics, solar wind statistics, and magnetospheric preconditioning, J. Geophys. Res., 111, A07S10, doi:10.1029/2005JA011397, 2006.
Borovsky, J. E., Nemzek, R. J., and Belian, R. D.: The occurrence rate of magnetospheric-substorm onsets: random and periodic substorms, J. Geophys. Res., 98, 3807–3813, 1993.
Denton, M. H., Borovsky, J. E., Skoug, R. M., Thomsen, M. F., Lavraud, B., Henderson, M. G., McPherron, R. L., Zhang, J. C., and Liemohn, M. W.: Geomagnetic storms driven by ICME-and CIR-dominated solar wind, J. Geophys. Res., 111, A07S07, doi:10.1029/2005JA011436, 2006.
Donovan, E. F., Trondsen, T. S., Cogger, L. L., and Jackel, B. J.: All-sky imaging within the Canadian CANOPUS and NORSTAR projects, Sodankyl¨a Geophysical Observatory pub-lications, 92, 109–112, 2003.
Engebretson, M. J., Hughes, W. J., Alford, J. L., Zesta, E., Cahill Jr., L. J., Arnoldy, R. L., and Reeves, G. D.: Magnetometer ar-ray for cusp and cleft studies observations of the spatial extent of broadband ULF magnetic pulsations at cusp/cleft latitudes, J. Geophys. Res., 100, 19371–19386, doi:10.1029/95JA00768, 1995.
Frank, L. A., Sigwarth, J. B., Craven, J. D., Cravens, J. P., Dolan, J. S., Dvorsky, M. R., Hardebeck, P. K., Harvey, J. D., and Muller, D. W.: The visible imaging system (VIS) for the Polar spacecraft, Space Sci. Rev., 71, 297–328, 1995.
Gjerloev, J. W., Hoffman, R. A., Sigwarth, J. B., and Frank L. A.: Statistical description of the bulge-type auroral
sub-storm in the far ultraviolent, J. Geophys. Res., 112, A07213, doi:10.1029/2006JA012189, 2007.
Gonzalez, W. D., Joselyn, J. A., Kamide, Y., Kroehl, H. W., Ros-toker, G., Tsurutani, B. T., and Vasyliunas, V. M.: What is a geomagnetic storm?, J. Geophys. Res., 99, 5771–5792, 1994. Gosling, J. T., Asbridge, J. R., Bame, S. J., and Feldman, W. C.:
Solar wind stream interfaces, J. Geophys. Res., 83, 1401–1412, 1978.
Greenwald, R. A., Baker, K. B., Dudeney, J. R., Pinnock, M., Jones, T. B., Thomas, E. C., Villain, J.-P., Cerisier, J.-C., Senior, C., Hanuise, C., Hunsucker, R. D., Sofko, G., Koehler, J., Nielsen, E., Pellinen, R., Walker, A. D. M., Sato, N., and Yamagishi, H.: Darn/Superdarn: A Global View of the Dynamics of High-Lattitude Convection, Space Sci. Rev., 71, 761–796, 1995. Hoffman, R. A., Gjerloev, J. W., Frank, L. A., and Sigwarth,
J. W.: Are there optical differences between storm-time sub-storms and isolated subsub-storms?, Ann. Geophys., 28, 1183–1198, doi:10.5194/angeo-28-1183-2010, 2010.
Hsu, T.-S. and McPherron, R. L.: Occurrence frequencies of IMF triggered and nontriggered substorms, J. Geophys. Res., 108, 1307, doi:10.1029/2002JA009442, 2003.
Kallio, E. I., Pulkkinen, T. I., Koskinen, H. E. J., Viljanen, A., Slavin, J. A., and Ogilvie, K.: Loading-unloading process in the nightside ionosphere, Geophys. Res. Lett., 27, 1627–1630, 2000. Kissinger, J., McPherron, R. L., Hsu, T.-S., and Angelopoulos, V.: Steady magnetospheric convection and stream interfaces: Re-lationship over a solar cycle, J. Geophys. Res., 116, A00I19, doi:10.1029/2010JA015763, 2011.
Kullen, A. and Karlsson, T.: On the relation between solar wind, pseudobreakups, and substorms, J. Geophys. Res., 109, A12218, doi:10.1029/2004JA010488, 2004.
Kullen, A., Karlsson, T., Cumnock, J. A., and
Sund-berg, T.: Occurrence and properties of substorms
associ-ated with pseudobreakups, J. Geophys. Res., 115, A12310, doi:10.1029/2010JA015866, 2010.
McPherron, R. L.: Growth phase of magnetospheric substorms, J. Geophys. Res., 75, 5592–5599, 1970.
Milan, S. E.: Both solar wind–magnetosphere coupling and ring current intensity control of the size of the auroral oval, Geophys. Res. Lett., 36, L18101, doi:10.1029/2009GL039997, 2009. Partamies, N., Pulkkinen, T. I., McPherron, R. L., McWilliams, K.,
Bryant, C. R., Tanskanen, E., Singer, H. J., Reeves, G. D., and Thomsen, M. F.: Different magnetospheric modes: solar wind driving and coupling efficiency, Ann. Geophys., 27, 4281–4291, doi:10.5194/angeo-27-4281-2009, 2009.
Perreault, P. and Akasofu, S.-I.: A study of geomagnetic storms, Geophys. J. R. Astr. Soc., 54, 547–573, 1978.
Picone, J. M., Hedin, A. E., Drob, D. P., and Aikin, A. C.: NRLMSISE-00 empirical model of the atmosphere: Statistical comparisons and scientific issues, J. Geophys. Res., 107, 1468, doi:10.1029/2002JA009430, 2002.
Pulkkinen, T. I., Partamies, N., McPherron, R. L., Henderson, M., Reeves, G. D., Thomsen, M. F., and Singer, H.: Statistical anal-ysis of stormtime activations and sawtooth events, J. Geophys. Res., 112, A01205, doi:10.1029/2006JA012024, 2007.
Rees, M. H. and Luckey, D.: Auroral electron energy derived from ratio of spectroscopic emissions, 1. Model computations, J. Geo-phys. Res., 79, 5181–5186, 1974.
Rostoker, G., Samson, J. C., Creutzberg, F., Hughes, T. J., McDi-armid, D. R., McNamara, A. G., Vallace Jones, A., Wallis, D. D., and Cogger, L. L.: CANOPUS – A ground based instrument array for remote sensing in the high latitude ionosphere during ISTP/GGS program, Space Sci. Rev., 71, 743–760, 1995. Syrj¨asuo, M., Pulkkinen, T. I., Janhunen, P., Viljanen, A., Pellinen,
R. J., Kauristie, K., Opgenoorth, H. J., Wallman, S., Eglitis, P., Karlsson, P., Amm, O., Nielsen, E., and Thomas, C.: Observa-tions of substorm electrodynamics using the MIRACLE network, in Substorms-4, edited by: Kokubun, S. and Kamide, Y., Terra Scientific Publishing Company, Tokyo, 111, 1998.
Tanskanen, E.: A comprehensive high-throughput analysis
of substorms observed by IMAGE magnetometer
net-work: Years 1993–2003, J. Geophys. Res., 114, A05204,
doi:10.1029/2008JA013682, 2009.
Tanskanen, E., Koskinen, H. E. J., Pulkkinen, T. I., Slavin, J. A., and Ogilvie, K.: Dissipation to the joule heating: isolated and stormtime substorms, Adv. Space Res., 30, 2305–2311, 2002a. Tanskanen, E., Pulkkinen, T. I., Koskinen, H. E. I., and Slavin,
J. A.: Substorm energy budget during low and high solar ac-tivity: 1997 and 1999 compared, J. Geophys. Res., 107, 1086, doi:10.1029/2001JA900153, 2002b.
Torr, M. R., Torr, D. G., Zukic, M., Johnson, R. B., Ajello, J., Banks, P., Clark, K., Cole, K., Keffer, C., Parks, G., Tsurutani, B., and Spann, J.: A far-ultraviolet imager for international solar-terrestrial physics mission, Space Sci. Rev., 71, 329–383, 1995.
Tsurutani, B. T. and Gonzalez, W. D.: The cause of high-intensity long-duration continuous AE activity (HILDCAAS) – Interplan-etary Alfven wave trains, Planet. Space Sci., 35, 405–412, 1987. Tsurutani, B. T. and Gonzalez, W. D.: The interplanetary causes of magnetic storms: A review, in: Geophysical Monograph, 98, American Geophysical Union, 1997.
Tsurutani B. T., Gonzalez, W. D., Gonzalez, A. L. C., Guarnieri, F. L., Gopalswamy, N., Grande, M., Kamide, Y., Kasahara, Y., Lu, G., Mann, I., McPherron, R., Soraas, F., and Vasyli-unas, V.: Corotating solar wind streams and recurrent geo-magnetic activity: A review, J. Geophys. Res., 111, A07S01, doi:10.1029/2005JA011273, 2006.
Turner, N. E., Cramer, W. D., Earles, S. K., and Emery, B. A.: Geoefficiency and energy partitioning in CIR-driven and CME-driven storms, J. Atmos. Terr. Phys., 71, 1023–1031, 2009. Vanham¨aki, H., Amm, O., and Viljanen, A.: One-dimensional
up-ward continuation of the ground magnetic field disturbance using spherical elementary current systems, Earth Planets Space, 55, 613–625, 2003.
Viljanen, A. and H¨akkinen, L.: IMAGE magnetometer network. in: Satellite-Ground Based Coordination Sourcebook, edited by: Lockwood, M., Wild, M. N., and Opgenoorth, H. J., ESA publi-cations SP-1198, 111–117, 1997.