S O F T W A R E R E V I E W
Open Access
Methylation plotter: a web tool for dynamic
visualization of DNA methylation data
Izaskun Mallona
1,2*, Anna Díez-Villanueva
1,2and Miguel A Peinado
1,2Abstract
Methylation plotter is a Web tool that allows the visualization of methylation data in a user-friendly manner and with publication-ready quality. The user is asked to introduce a file containing the methylation status of a genomic region. This file can contain up to 100 samples and 100 CpGs. Optionally, the user can assign a group for each sample (i.e. whether a sample is a tumoral or normal tissue). After the data upload, the tool produces different graphical representations of the results following the most commonly used styles to display this type of data. They include an interactive plot that summarizes the status of every CpG site and for every sample in lollipop or grid styles.
Methylation values ranging from 0 (unmethylated) to 1 (fully methylated) are represented using a gray color gradient. A practical feature of the tool allows the user to choose from different types of arrangement of the samples in the display: for instance, sorting by overall methylation level, by group, by unsupervised clustering or just following the order in which data were entered.
In addition to the detailed plot, Methylation plotter produces a methylation profile plot that summarizes the status of the scrutinized region, a boxplot that sums up the differences between groups (if any) and a dendrogram that classifies the data by unsupervised clustering. Coupled with this analysis, descriptive statistics and testing for differences at both CpG and group levels are provided.
The implementation is based in R/shiny, providing a highly dynamic user interface that generates quality graphics without the need of writing R code. Methylation plotter is freely available at http://gattaca.imppc.org:3838/ methylation_plotter/.
Keywords: Methylation plot, Methylation visualization, R/shiny, Lollipop plot
Background
Cytosine methylation in CpG dinucleotides is an impor-tant mechanism involved in the regulation of multiple bio-logical processes including pathobio-logical conditions [1-3]. While there is a wide range of methodologies to evalu-ate DNA methylation, bisulfite-treevalu-ated DNA sequencing is the gold standard to determine DNA methylation at the single CpG level [1,4,5]. The functional implications of DNA methylation states are often determined by the CpG profile but at the regional level rather than by a single CpG site. Therefore, the interpretation and application of this sort of data require further analysis that is highly benefited by the implementation of visualization tools.
*Correspondence: [email protected]
1Institute of Predictive and Personalized Medicine of Cancer (IMPPC), Ctra. de Can Ruti, camí de les escoles, s/n, 08916 Badalona, Spain
2Health Research Institute Germans Trias i Pujol (IGTP), Ctra. de Can Ruti, camí de les escoles, s/n, 08916 Badalona, Spain
While some software tools to analyze and visually represent DNA methylation data have been published (reviewed in [5]), its use by wet lab users is often lim-ited. On the other hand, popular spreadsheet tools like Excel are unable to generate lollipop plots by default. Even more, the Excel-based solutions perform poorly for repeti-tive tasks: in an automated analysis context, programmatic approaches are less error prone and more reproducible [6].
Specialized tools have been developed to work with con-verted bisulfite sequence files and to explore methylation trends, but are highly dependent on the operating sys-tem: MethTools, [7]) is Unix-based, and CpG Analyzer [8] or CpG PatternFinder [9]) run under Windows. MethDB [10] offers a web tool and thus is platform-independent, but is designed as a methylation data provider rather than a graphical tool. BiQ Analyzer [11,12] and QUMA
[13] provide web tools that plot lollipop-like graph-ics; however, they are rather devoted to clonal analysis, assessing the methylation status as a categorical variable (either methylated or unmethylated). Hence, a platform-independent tool to visualize continuous methylation data, as those produced by direct bisulfite sequencing or microarray platforms, is needed.
Implementation
The interactive web application is written using shiny, an R framework that couples the R-based statistics com-putation and graphics generation to the rendering of a Web-based user interface [14]. This technology allows to take advantage of the R power in an easy-to-use fron-tend. As the application is hosted in a remote server,
the user does not need to consume local resources and just requires a Web browser to use the tool. User data is removed from the server as soon as the browser session terminates.
Results and discussion
Methylation plotter is an interactive application that allows rapid and easy generation of customized plots and statistical summaries of methylation data. The user is asked to upload a tab-separated file describing the status
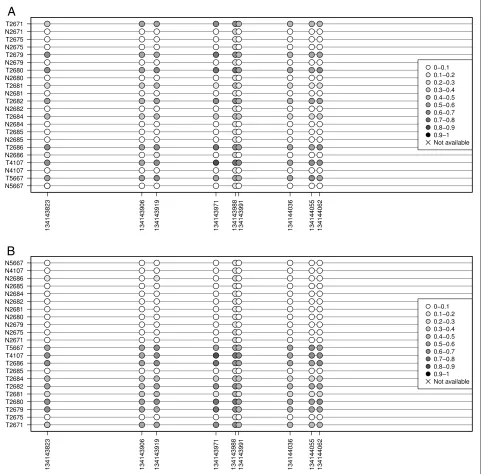
of up to 100 CpGs in up to 100 different samples as well the group each sample belongs to. The application gen-erates an interactive plot that summarizes the status of every CpG site and for every sample in lollipop or grid styles. Methylation values ranging from 0 (unmethylated) to 1 (fully methylated) are represented using a gray color gradient.
The input data consist on beta values, a popular for-mat, that offer an intuitive manner to represent the level of methylation. These beta values are typically generated
B
A
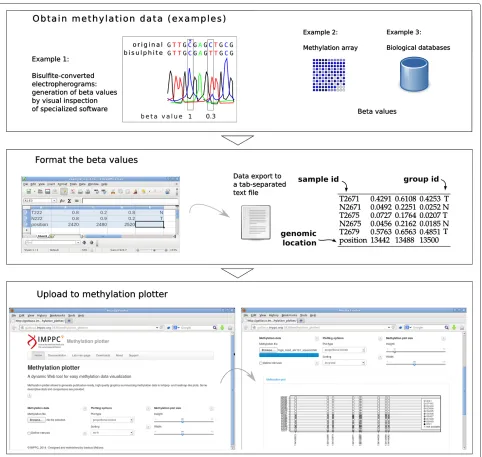
by the software used to process bead arrays like the Illu-mina Infinium HumanMethylation450 [15]. Data portals such as the The Cancer Genome Atlas (TCGA) provide beta-values in a comprehensive series of cancer genomics datasets. However, wet lab users oftenly perform bisulfite-treated sequencing of their samples, and therefore require further preprocessing in order to assess the methylation status. For instance, an electrophoregram viewer or even a sequence alignment tool may be necessary. A flowchart of the data acquisition and processing steps is available as Figure 1. An excellent outline of the bisulfite data preprocessing may be found at [11].
The methylation plot is interactive: without the need of reuploading the data, the user can customize the plot dimensions on the fly and therefore produce
publication-ready figures. Accordingly, the user can select different types of arrangement of the samples in the display: for instance, sorting by overall methylation level, by group, by unsupervised clustering or just as provided. Finally, the lollipop plot allows to select whether to keep the distances between CpGs proportional (that is, disregarding the actual distance) or not. Figure 2 shows a typical lollipop-like output plot, as well the by-group sorting (Figure 2B). For bulky datasets, the user can select a more convenient heatmap-like plot that represents all the scrutinized CpGs in a grid-like manner.
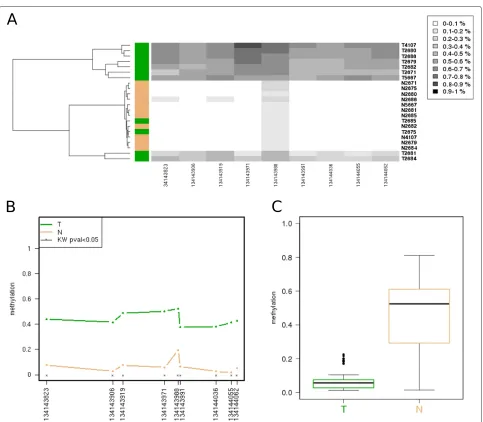
Beyond the lollipop or grid-like methylation plots, the tool provides three data representations. First, a heatmap with its associated dendrogram offers the result of the unsupervised clustering of the samples, colouring each
dendrogram leaf according to the user-provided group (Figure 3A); this allows an easy checking of coherence between the already established groups and those gener-ated by the unsupervised classification. Second, a profile plot summarizes the methylation panorama according to the sample group, labelling those CpGs that show sta-tistical differences according to the nonparametric test Kruskal-Wallis (Figure 3B). And third, a boxplot depicts the methylation profile for each group highlighting its quartiles, thus simultaneously summarizing the methyla-tion status for each group of samples (Figure 3C).
Altogether, Methylation plotter provides descriptive statistics and basic non-parametric variance analysis (Kruskal-Wallis tests). For each sample, a data table sum-marizing the mean, standard deviation, minimum and maximum, and number of not available positions (NAs) is produced. The same descriptive statistics are produced for each CpG and, if the input data is ascribed to two or more groups, each CpG is tested for equality using the Kruskal-Wallis test.
All the figures are available to download as either raster (PNG) or vector format files (PDF), whereas statistical reports are served as spreadsheets (tab-separated values).
Conclusions
In summary, Methylation plotter is a user-friendly tool that produces ready-to-use plots and summary data required by most wet lab users analyzing DNA methyla-tion. The application is freely accessible at http://gattaca. imppc.org:3838/methylation_plotter/.
Availability and requirements
• Project name: Methylation plotter
• Project home page: http://sourceforge.net/projects/ methylationplotter
• Operating system(s): Platform independent
• Programming language: R/shiny
• Other requirements: None
• License: GPL v2
• Any restrictions to use by non-academics: None
Competing interests
The authors declare that they have no competing interests.
Authors’ contributions
IM, ADV and MAP conceived the project. IM and ADV implemented the software using R code. IM designed and coded the Web tool. IM wrote the manuscript and all the authors read and approved it.
Acknowledgements
We thank Judith Flo for her excellent technical assistance and the members of the lab for comments and beta-testing of the tool. AD was supported in part by contract PTC2011-1091 from the Ministry of Economy and Knowledge. This work was supported by grants from the Ministry of Economy and Knowledge (SAF2011/23638), and the Generalitat de Catalunya (2009 SGR 1356).
Received: 27 March 2014 Accepted: 4 June 2014 Published: 7 June 2014
References
1. Esteller M:Cancer epigenomics: dna methylomes and histone-modification maps.Nat Rev Genet2007,8(4):286–298. 2. Jones PA, Baylin SB:The epigenomics of cancer.Cell2007,
128(4):683–692.
3. Suzuki MM, Bird A:Dna methylation landscapes: provocative insights from epigenomics.Nat Rev Genet2008,9(6):465–476.
4. Jordà M, Peinado MA:Methods for dna methylation analysis and applications in colon cancer.Mutat Res Fund Mol Mech Mutagen2010,
693(1):84–93.
5. Laird PW:Principles and challenges of genome-wide dna methylation analysis.Nat Rev Genet2010,11(3):191–203. 6. Mesirov JP:Computer science. Accessible reproducible research.
Science2010,327(5964):415–416.
7. Grunau C, Schattevoy R, Mache N, Rosenthal A:Methtools—a toolbox to visualize and analyze dna methylation data.Nucleic Acids Res2000,
28(5):1053–1058.
8. Xu Y, Manoharan HT, Pitot HC:Cpg analyzer, a windows-based utility program for investigation of dna methylation.Biotechniques2005,
39(5):656.
9. Xu Y-H, Manoharan HT, Pitot HC:Cpg patternfinder: a windows®-based utility program for easy and rapid identification of the cpg methylation status of dna.Biotechniques2007,43:334–342.
10. Grunau C, Renault E, Rosenthal A, Roizes G:Methdb—a public database for dna methylation data.Nucleic Acids Res2001,29(1):270–274. 11. Bock C, Reither S, Mikeska T, Paulsen M, Walter J, Lengauer T:Biq
analyzer: visualization and quality control for dna methylation data from bisulfite sequencing.Bioinformatics2005,21(21):4067–4068. 12. Lutsik P, Feuerbach L, Arand J, Lengauer T, Walter J, Bock C:Biq analyzer
ht: locus-specific analysis of dna methylation by high-throughput bisulfite sequencing.Nucleic Acids Res2011,39(suppl 2):551–556. 13. Kumaki Y, Oda M, Okano M:Quma: quantification tool for methylation
analysis.Nucleic Acids Res2008,36(suppl 2):170–175.
14. RStudio Inc.:Shiny: Web Application Framework for R.2013. R package version 0.8.0. [http://CRAN.R-project.org/package=shiny] 15. Bibikova M, Lin Z, Zhou L, Chudin E, Garcia EW, Wu B, Doucet D, Thomas
NJ, Wang Y, Vollmer E, Goldmann T, Seifart C, Jiang W, Barker DL, Chee MS, Floros J, Fan JB:High-throughput dna methylation profiling using universal bead arrays.Genome Res2006,16(3):383–393.
doi:10.1186/1751-0473-9-11
Cite this article as:Mallonaet al.:Methylation plotter: a web tool for dynamic visualization of DNA methylation data.Source Code for Biology and Medicine20149:11.
Submit your next manuscript to BioMed Central and take full advantage of:
• Convenient online submission
• Thorough peer review
• No space constraints or color figure charges
• Immediate publication on acceptance
• Inclusion in PubMed, CAS, Scopus and Google Scholar
• Research which is freely available for redistribution