www.earth-syst-sci-data.net/5/319/2013/ doi:10.5194/essd-5-319-2013
©Author(s) 2013. CC Attribution 3.0 License. Open
Access
Science
Data
Juneau Icefield Mass Balance Program 1946–2011
M. Pelto1, J. Kavanaugh2, and C. McNeil3
1Department of Environmental Sciences, Nichols College, Dudley, MA 01571, USA
2Department of Earth and Atmospheric Sciences, University of Alberta, Edmonton, AB T6G, Canada
3US Geological Survey (USGS), 4210 University Dr., Anchorage, AK 99508-4626, USA
Correspondence to: M. Pelto ([email protected])
Received: 30 March 2013 – Published in Earth Syst. Sci. Data Discuss.: 24 May 2013 Revised: 3 October 2013 – Accepted: 14 October 2013 – Published: 15 November 2013
Abstract. The annual surface mass balance records of the Lemon Creek Glacier and Taku Glacier observed by the Juneau Icefield Research Program are the longest continuous glacier annual mass balance data sets in North America. Annual surface mass balance (Ba) measured on Taku Glacier averaged+0.40 m a−1 from 1946–1985, and−0.08 m a−1 from 1986–2011. The recent annual mass balance decline has resulted in the cessation of the long-term thickening of the glacier. Mean Ba on Lemon Creek Glacier has declined from
−0.30 m a−1 for the 1953–1985 period to−0.60 m a−1during the 1986–2011 period. The cumulative change in annual surface mass balance is−26.6 m water equivalent, a 29 m of ice thinning over the 55 yr. Snow-pit measurements spanning the accumulation zone, and probing transects above the transient snow line (TSL) on Taku Glacier, indicate a consistent surface mass balance gradient from year to year. Observations of the rate of TSL rise on Lemon Creek Glacier and Taku Glacier indicate a comparatively consistent migration rate of 3.8 to 4.1 m d−1. The relationship between TSL on Lemon Creek Glacier and Taku Glacier to other Juneau Icefield glaciers (Norris, Mendenhall, Herbert, and Eagle) is strong, with correlations exceeding 0.82 in all cases.
doi:10.5065/D6NZ85N3
1 Introduction
The Juneau Icefield Research Program (JIRP) is the longest ongoing program of its kind in North America, facilitat-ing arctic and alpine education and expeditionary trainfacilitat-ing in the fields of climate science, glaciology and glacial ge-ology. JIRP has examined the surface mass balance of the Juneau Icefield since 1946, with principal efforts focused on Lemon Creek Glacier and Taku Glacier. This database is the longest direct measurement of surface mass balance in North America. The data are reported to the World Glacier Monitoring Service (WGMS) annually and made available through the Advanced Cooperative Arctic Data and Infor-mation Service (ACADIS). This paper reports on three data sets: (1) annual surface mass balance (Ba) record of the Taku and Lemon Creek glaciers, including their annually calcu-lated equilibrium line altitude (ELA) and accumulation area ratio (AAR), as well as evaluation of validation and
sustained positive annual mass balance is out of equilibrium and will tend to thicken and advance. It is crucial that we con-tinue to maintain the invaluable climate–glacier data set and provide it to the World Glacier Monitoring Service (WGMS).
2 Field area
2.1 Taku Glacier
Taku Glacier is a temperate, maritime valley glacier in the Coast Mountains of Alaska. With an area of 671 km2, it is the principal outlet glacier of the Juneau Icefield (Fig. 1). Taku Glacier can be divided into three zones with differing mass balance and flow characteristics. (1) The ablation zone, be-low the mean annual ELA of 925 m a.s.l. (113 km2), descends the trunk valley with no tributaries joining the glacier, with the single distributary tongue, Hole in the Wall, branching offfrom the main glacier 9 km above the terminus. (2) The lower firn zone, extending from the ELA at 925 m a.s.l. up to 1350 m, is a zone where summer ablation is significant (178 km2). All of the main tributary glaciers (Southwest, Northwest, Matthes, and Demorest) join in this zone. (3) The upper firn zone extends from 1350 m a.s.l. to the head of the glacier at 2200 m a.s.l. (380 km2), comprising the princi-pal accumulation region for each tributary except the South-west Branch. Ablation is limited in this upper firn zone, with much of the summer meltwater refreezing within the firn, and limited sun cup development. This zone has a unique low backscatter signature in synthetic aperture radar (SAR) im-agery (Ramage et al., 2000).
Taku Glacier attracts special attention because of its con-tinuing, century-long advance (Pelto and Miller, 1990; Post and Motyka, 1995; Motyka and Echelmeyer, 2003), while all other outlet glaciers of the Juneau Icefield are retreat-ing. Taku Glacier is also the thickest glacier yet measured in Alaska, 1477 m at an elevation of 800 m (Nolan et al., 1995). Taku Glacier is noteworthy for its positive annual mass bal-ance from 1946–1988, which resulted from the cessation of calving around 1950 (Pelto and Miller, 1990). The positive mass balance resulting from this dynamic change with calv-ing cessation gives the glacier an unusually high AAR (ac-cumulation area ratio: percentage of glacier in ac(ac-cumulation zone at end of hydrologic year) for a non-calving glacier and makes the glacier relatively insensitive to climate change (Miller and Pelto, 1999; Pelto et al., 2008; Criscitiello, et al., 2010).
2.2 Lemon Creek Glacier
Lemon Creek Glacier, Alaska, was chosen as a representative glacier for the 1957/58 International Geophysical Year global glacier network. This choice was based on its sub-arctic lati-tude and on the ongoing mass balance program of JIRP that had begun in 1953 (Miller, 1972; Miller and Pelto, 1999). JIRP has continued annual surface mass balance
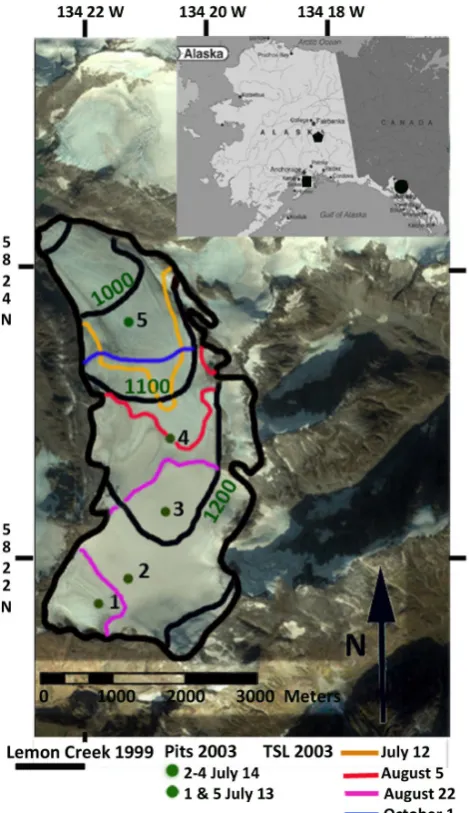
measure-Figure 1.Base map of the Juneau Icefield, indicating the glaciers examined in this study. LC=Lemon Creek Glacier, bold black line=Probing transect on Taku Glacier. Black dots=snow pit lo-cations on Taku Glacier.
ments on Lemon Creek Glacier through the present (Fig. 2). In 1957 Lemon Creek Glacier was 6.4 km long and had an area of 12.67 km2 (Heusser and Marcus, 1964). In 1998 the glacier was 5.6 km long and had an area of 11.8 km2 (Mar-cus et al., 1995). From the head of the glacier at 1450 m a.s.l. to the mean ELA at 1050–1100 m a.s.l. the glacier flows northward; in the ablation zone the glacier turns westward, terminating at 750 m a.s.l. The glacier is divided into four sections: (1) steep peripheral northern and western margins draining into the main valley portion of the glacier; (2) a low slope (40) upper accumulation zone from 1220 m a.s.l. to 1050 m a.s.l.; (3) a steeper section (60) in the ablation zone as the glacier turns west from 1050–850 m a.s.l.; and (4) an icefall (180) leading to the two fingered termini at 600 m a.s.l. This latter section was present up through 2005, but has now melted away and the terminus is at 750 m a.s.l. The maximum thickness exceeding 200 m is 1 km above the icefall (Miller, 1972). Lemon Creek Glacier has retreated 1200 m since 1948 and 800 m since 1957, with an average of 10–13 m a−1 be-tween 1998 and 2009.
3 Surface mass balance methods
Figure 2.Map of Lemon Creek Glacier indicating primary snow pit locations, and the TSL location on specific dates in 2003. The black circle indicates the location of Lemon Creek Glacier, pen-tagon Gulkana Glacier and square Wolverine glacier.
equivalent (w.e.) is directly measured through the entire an-nual snow pack profile); (2) short-term ablation measure-ments at snow pits and along survey profiles with repeated height measurements of the stakes; and (3) observation of the TSL and ELA that allow ablation adjustments to snow pack.
3.1 Snow pits
The standard method used by JIRP to measure accumulation is the snow pit. Each snow pit is excavated down to the previ-ous summer surface, identified by a dirty and/or ice horizon and density discontinuity. The most important aspect of the snow pit is accurate identification of the depth. The previous
summer surface is well developed by the end of the ablation season on the Lemon Creek Glacier and below 1500 m a.s.l. on Taku Glacier (LaChapelle, 1954). Typically, a snow pit reaches the previous summer’s surface, rather than blue ice, although it is not uncommon for a snow pit in the vicinity of the ELA to reach glacier ice. The previous summer’s surface is a laterally continuous surface that typically has undergone several freeze/thaw cycles and often has a low density depth hoar just above it. In surface mass balance the unit of as-sessment is the snow water equivalent (SWE) of the snow pack. This is the mass per unit area of water that would be yielded were the snow pack melted, and is the product of snow depth and snow density. The density of the snow pack is quite variable during the winter and spring, but by July the mean density is generally consistent from year to year and lo-cation to lolo-cation on the Juneau Icefield. LaChapelle (1954) noted remarkable uniformity of snow density in vertical pro-file and distribution over the glacier, and with time during the mid- to late summer. LaChapelle (1954) found the density of the snow pack to be consistently 540–565 kg m−3after early July on the Taku Glacier; this has been observed by many other detailed studies since (Pelto and Miller, 1990). From 2003 to 2013, standard techniques have been used in den-sity measurement through the depth profile of each snow pit; mean density has been 540 kg m−3, with a standard deviation of 30 kg m−3. Since there is no dry snow zone on the Lemon Creek or Taku glaciers, there is no difference in density with elevation. Ramage et al. (2000) found that surface wetness, grain size and density were all uniform across the icefield surface. Despite this fact, density is measured at each snow pit, in part because this is an excellent training tool.
Snow depth can be verified in shallow snow pack, those less than 3.5 m, using probing or crevasse stratigraphy. Mea-surements of retained accumulation in a snow pit are com-pleted during July and August, and are adjusted to end of the balance year values based on the variation of the TSL, ob-served ablation and surface mass balance profile (Pelto and Miller, 1990; Miller and Pelto, 1999).
Figure 3.Snow pit location on Taku Glacier in 2011. Note the ice lenses. Density measurements are being taken from the south wall; the tape measure aids recording ice lens and sample depths.
density measured. The final step of the snow pit observations is to record all ice lenses present in the vertical profile of the snow pack (Fig. 3). An ice lens is a horizontal layer of ice formed when water percolates through the snow pack, hits a denser and/or colder layer of snow, spreads out laterally, and refreezes. The depth, thickness, and continuity of all ice lenses are recorded. Due to the small size of these features, the density of the lens is assumed at 900 kg m−3.
Due to the presence of ice within the snow pack, we report water equivalent depths rather than snow water equivalent depths. The w.e. for each snow pit is calculated using mea-surement of snow depth, snow density, total thickness of ice lenses within the snow pack, and an assumed density of ice.
w.e.=dsρs+diρi (1)
Where dsis the depth of snow minus the sum thickness of all ice lenses, multiplied byρsthe mean column density of snow sampled horizontally in 10 cm intervals unless ice is present. Water equivalent ice lenses present in snow pack is accounted with dias the sum thickness of all ice lenses present along vertical profile of snow pack, multiplied byρi an assumed ice density of 900 kg m−3. The sum of snow water equivalent and ice water equivalent quantifies the water equivalent for each snow pit location.
On Taku Glacier, six of the snow pit sites are near the ELA ranging from 950–1200 m a.s.l., six are located at 1200– 1400 m a.s.l. and five are located at 1400–1800 m a.s.l. alti-tude. Compared with Gulkana Glacier (19 km2) and Wolver-ine Glacier (18 km2), where the USGS annually assesses glacier mass balance from 3 to 4 measurement sites, the number of measurements on Taku Glacier is large (March and Trabant, 1996; Mayo et al., 2004). However, because the size of the Taku Glacier is more than an order of mag-nitude larger than either Gulkana or Wolverine glaciers, the
measurement density is still lower than at the Alaskan bench-mark glaciers. Furthermore, the distribution of annual mea-surements on Taku Glacier is skewed toward the ELA, and is nonexistent in the ablation zone. On Gulkana Glacier there is one site in the ablation zone, two sites near the ELA, and no sites in the upper 600 m of the glacier (March and Trabant, 1996). On Wolverine Glacier there is one site in the abla-tion zone, one site at the ELA and one site in the accumu-lation zone (Mayo et al., 2004). Van Beusekom et al. (2010) noted that the result on Wolverine Glacier was that the an-nual surface mass balance record differed from the geodetic record, leading to an adjustment to the long-term Barecord using a degree day based mass balance model. Because of these differences, extrapolations of mass balance from obser-vations sites are commonly made, and represent a consistent source of error in Alaskan glacier mass balance assessments (Miller and Pelto, 1999). The advantage on Taku Glacier is that there are multiple measurement sites at each elevation, and in each tributary, which provides a more robust basis for annual mass balance gradient; the disadvantage is that the areal extent over which the extrapolations are made is larger. Current work using high frequency ground penetrating radar to precisely assess the annual mass balance retained snow depth in more detail is in progress.
3.2 Ablation assessment
Ablation is also observed annually during the field season, at snow pit locations, survey stakes located along survey lines where repeat surveys are completed, and through satellite ob-servations of the migration of the TSL since 1998 (Pelto and Miller, 1990; Pelto et al., 2008). These ablation stakes, driven into the snow in the accumulation zone record the ablation of the remaining snow pack in the accumulation zone, between the time of snow pit measurements in July and the end of the ablation season in early September. This provides an es-sential measure for adjusting the July accumulation thickness snow pit measurements to the end of the ablation season. On Lemon Creek Glacier, the maximum number of such ablation stakes used during a single season was 200 in 1967. Dur-ing the several years where more than 30 ablation stakes were emplaced, it is apparent that the ablation rate above 900 m a.s.l. is nearly constant on the Lemon Creek Glacier, whereas below 900 m a.s.l. the ablation rate increases with decreasing surface elevation.
On Taku Glacier in the ablation zone, the mass balance profile is adjusted based on the ELA, on measurements of ablation in nine different years from 1950 to 1997, including annual ablation measurements on cross survey profiles since 1998. The resulting ablation is a maximum at the terminus, at 12 m a−1(Pelto and Miller, 1990). Independent examination of ablation at the terminus (Motyka and Echelmeyer, 2003) has identified ablation rates at the terminus of 12–14 m a−1 during two slightly warmer than usual ablation seasons 2003 and 2004. Boyce et al. (2007) noted ablation on neighboring Mendenhall Glacier at elevations from 0–300 m a.s.l. ranged from 10 to 14 m in 1998, 2000, 2003, 2004 and 2005.
3.3 Probing and crevasse stratigraphy
The snow pit is a point measurement of w.e. amidst the vast expanse of the icefield. To address the representativeness of snow pits and the associated error resulting from extrapolat-ing from snow pits; in 1984, 1998, 2004, 2005 and 2010, JIRP measured the mass balance at an additional 100–500 points in the accumulation area with probing transects that extend outward from snow pits, to better determine the dis-tribution of accumulation around a snow pit location. Mea-surements were taken along profiles at 100–250 m intervals. At each measurement point three depth measurements were made 25 m apart. The standard deviation for measurements sites within 25 m of each other was 7 mm, and 17 mm for sites within 100 m of each other; this indicates the consis-tency of mass balance near snow pit sites.
Retained accumulation thickness has been observed at up to 300 points in a single summer season on Lemon Creek Glacier (1998) and 450 measurements on Taku Glacier (1998). Probing is not effective at depths greater than 5 m. The probe used is a 3/4 inch steel probe that easily pene-trates ice lenses within the snow pack because the ice layers have comparatively soft unconsolidated snow beneath them. The previous summer surface cannot be penetrated because the entire layer was melted and refrozen many times, raising its density and cohesion.
Annual layers in the walls of crevasses are often quite ob-vious, similar to reading tree ring width for climate analy-sis. Crevasse stratigraphy provides a means to view the two dimensional nature of the annual layer, in contrast to a point measurement yielded by probing or the small scale view pro-vided by a snow pit. Only vertically walled crevasses can be used for these observations. The key to identification of the annual layer in crevasses is the lateral continuity of the ice layer, as no other feature will be continuous. Crevasse stratig-raphy is not a standard method used on the Taku Glacier, but has been used since the beginning of the program for validat-ing snow pit snow depth observations in specific regions of the glacier where snow depths are large and probing cannot be used for validation.
Figure 4.Cumulative annual surface mass balance record of Taku Glacier (red) and Lemon Creek Glacier (blue).
4 Results
4.1 Annual surface mass balance record
On Taku Glacier, the annual ELA has risen 60 m from the 1946–1985 period to the 1986–2010 period. Mean Ba dur-ing the two periods were+0.40 and−0.08 m w.e. a−1, respec-tively, indicative of the snow line rise resulting in cessation of the long-term thickening of the glacier (Table 1). This cumulative change in Ba from 1946–2011 is +13.7 m w.e. (Fig. 4). The long-term positive Bamass balance is continu-ing to drive glacier advance (Pelto and Miller, 1990; Post and Motyka, 1995; Pelto et al., 2008). All other outlet glaciers of the Juneau Icefield are retreating, and are thus consistent with the dominantly negative alpine glacier mass balance that has been observed globally (Zemp et al., 2009).
Mean Ba on Lemon Creek Glacier has declined from
−0.3 m w.e. a−1for the 1953–1985 period to−0.60 m w.e. a−1 during the 1986–2011 period. The cumulative change Bais
−26.6 m, a 29 m ice thickness loss over the 55 yr (Table 1).
4.2 Mass balance record validation
Table 1.Mass balance record of the Taku and Lemon Creek glaciers, including annual mass balance (Ba), ELA, AAR and cumulative Ba.
Year Taku Ba LC Ba LC cumulative Ba Taku cumulative Ba Taku ELA LC ELA LC AAR Taku AAR
(mm w.e.) (mm w.e.) (mm w.e.) (mm w.e.) (m) (m)
1946 −40 −40 980 85
1947 360 320 900 88
1948 510 830 870 89
1949 930 1760 800 90
1950 −180 1580 1010 84
1951 −340 1240 1160 68
1952 160 1400 950 86
1953 −150 −560 −560 1250 1010 1080 40 84
1954 −70 −180 −740 1180 1160 1025 58 68
1955 970 1120 380 2150 950 810 90 86
1956 −130 −640 −260 2020 1010 1075 40 84
1957 −40 0 −260 1980 980 1000 62 85
1958 210 −580 −840 2190 780 1040 52 91
1959 350 −900 −1740 2540 1000 1150 33 84
1960 160 −820 −2560 2700 1010 1130 35 84
1961 480 −240 −2800 3180 930 1080 40 87
1962 390 −690 −3490 3570 915 1110 37 88
1963 570 170 −3320 4140 950 970 66 86
1964 1130 1040 −2280 5270 885 885 80 90
1965 790 80 −2200 6060 900 980 65 90
1966 80 −490 −2690 6140 875 1100 38 89
1967 250 −600 −3290 6390 750 1130 36 91
1968 460 −220 −3510 6850 810 1060 58 90
1969 1170 210 −3300 8020 965 1000 63 86
1970 760 −90 −3390 8780 930 1060 58 91
1971 630 −400 −3790 9410 885 1110 39 88
1972 420 −650 −4440 9830 730 1140 34 92
1973 520 −520 −4960 10 350 825 1110 39 90
1974 580 −370 −5330 10 930 850 1090 42 89
1975 850 290 −5040 11 780 800 1010 63 90
1976 660 −250 −5290 12 440 850 1080 48 89
1977 470 −480 −5770 12 910 885 1110 40 88
1978 310 −800 −6570 13 220 915 1150 35 87
1979 140 −630 −7200 13 360 950 1110 40 86
1980 540 −270 −7470 13 900 870 1100 42 89
1981 120 −810 −8280 14 020 980 1120 40 85
1982 150 −430 −8710 14 170 950 1070 51 86
1983 −420 −1620 −10 330 13 750 1085 1220 17 79
1984 640 −250 −10 580 14 390 875 1010 65 89
1985 1400 330 −10 250 15 790 600 965 75 93
1986 1200 −510 −10 760 16 990 720 1070 51 92
1987 390 −840 −11 600 17 380 910 1100 43 88
1988 600 110 −11 490 17 980 890 1000 69 88
1989 −810 −1240 −12 730 17 170 1115 1130 40 74
1990 −450 −1110 −13 840 16 720 1080 1125 42 79
1991 380 −380 −14 220 17 100 900 1050 60 88
1992 170 −660 −14 880 17 270 940 1075 54 86
1993 −40 −980 −15 860 17 230 980 1130 43 85
1994 90 −760 −16 620 17 320 970 1100 46 85
1995 −760 −1310 −17 930 16 560 1050 1150 38 81
1996 −960 −1580 −19 510 15 600 1150 1370 5 68
1997 −1340 −1810 −21 320 14 260 1225 1400 5 60
1998 −980 −1460 −22 780 13 280 1120 1300 7 73
1999 400 200 −22 580 13 680 900 1020 68 88
2000 1030 650 −21 930 14 710 750 900 82 91
2001 880 400 −21 530 15 590 850 950 77 89
2002 100 −250 −21 780 15 690 975 1025 67 88
2003 −900 −1900 −23 680 14 790 1100 1400 5 77
2004 −830 −1250 −24 930 13 960 1100 1150 59 86
2005 −720 −470 −25 400 13 240 1050 1050 61 86
2006 230 −170 −25 570 13 470 975 1025 68 86
2007 480 150 −25 420 13 950 930 1000 72 87
2008 750 800 −24 620 14 700 800 920 80 90
2009 −310 −700 −25 320 14 390 960 1060 51 86
2010 −120 −580 −25 900 14 270 1000 1075 55 83
section). The principal error is due to the lack of data from the ablation zone. The mass balance profile for the glacier in the ablation zone is based solely on ablation measurements. These data indicate a consistent gradient in the ablation zone. The profile is adjusted to zero at the observed ELA. Annual observations of ablation are not a standard method because of costs and logistics; this does add uncertainty in the mass balance assessment. The mass balance gradient in the ab-lation zone published by Miller and Pelto (1990) for Taku Glacier has been verified by independent work by Motyka and Echelmeyer (2003) on Taku Glacier and on neighboring Mendenhall Glacier (Boyce et al., 2007).
The Taku Glacier annual surface mass balance record has been validated with geodetic balances from independent ob-servation of glacier surface elevation change, using the on-going laser altimetry by the University of Alaska, Fairbanks (Sapiano et al., 1998; Arendt et al., 2002; Larsen et al., 2007). This was accomplished from a centerline profile pro-viding a mean glacier surface elevation change. Surface el-evation change is not strictly a measure of mass balance, though it is reported as such (Arendt, 2006). Surface dynam-ics can also play a role. On Taku Glacier in the vicinity of the ELA, annual velocity surveys indicate consistent ice dy-namics from 1950 to 2006, indicating that surface elevation change should mostly reflect surface mass balance (Pelto et al., 2008). The observed change in Taku Glacier surface ele-vation was+0.69 m a−1 from 1948 to 1993 and−0.28 m a−1 from 1993 to 1997 (Arendt, 2006). The observed mean Ba for these periods from field observations is+0.38 m a−1 for 1948–1993 and−0.60 m a−1for 1993–1997. The direct mea-surement record includes the large negative mass balance of 1997, while the laser altimetry only includes part of the 1997 ablation season and would tend to underestimate thinning by a small amount (Sapiano et al., 1998). Repeat laser al-timetry profiling indicates a Baof−0.21 m a−1for the 1993– 2007 period, compared to the JIRP mean Baof−0.16 m a−1. Comparisons of surface elevations from the 2000 Shuttle Radar Topography Mission and a DEM derived from the 1948 USGS mapping indicate a mean Baof+0.45 m a−1 ver-sus the JIRP record of+0.27 m a−1for the 1948–2000 period (Larsen et al., 2007). The long-term observed ice surface ele-vation changes taken over varied periods using different tech-niques validates the accuracy of the annual surface mass bal-ance record of the Taku Glacier.
On Lemon Creek Glacier the annual surface mass balance record determined from field measurement yields a cumula-tive mass balance of−26.6 m w.e. from 1953 to 2011. The cumulative Barecord of −12.7 m w.e. (13.9 m of ice thick-ness) from 1957 to 1989 compares well to the thinning iden-tified from geodetic methods of 1957–1989 of−13.2 (Mar-cus et al., 1995). The cumulative Barecord of−17.1 m w.e. (−19.0 m of ice thickness) from the period 1957–1995 com-pares favorably to an observed ice thickness of −16.4 m (Sapiano et al., 1998). Airborne surface profiling by the Uni-versity of Alaska – Fairbanks (Sapiano et al., 1998; Larsen
Figure 5.Taku Glacier mass balance profile determined from prob-ing in various years. Note the similar gradient in this elevation range of the Taku Glacier in July near the ELA.
et al., 2007) noted an additional −12.9 m surface elevation change, equivalent to a cumulative annual mass balance of −11.5 m w.e. compared to annual surface mass balance of −9.7 m w.e. from 1994–2007. The error in both geodetic pro-grams is less than 1.5 m. In each of the three time intervals using two different ice surface elevation change assessment techniques, the Barecord is confirmed. Future work address-ing the minor discrepancies between the geodetic and direct measurement records is currently being reviewed.
5 Probing transects for determination of balance gradient
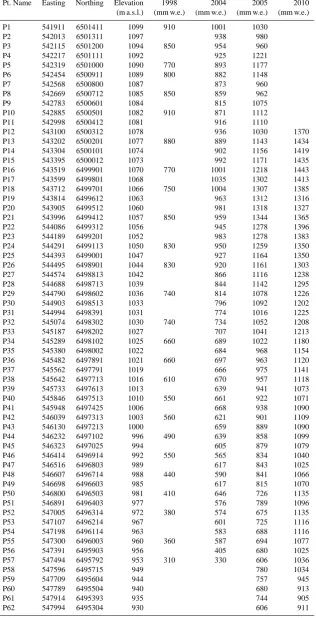
Mauri Pelto in late July of 1984, 1998; Matt Beedle in late July of 2004, 2005; and Chris McNeil in late July of 2010, 2011 measured the mass balance along a transect from near the TSL at 900 to 1150 m on Taku Glacier by probing at a horizontal interval of 200 m. This method allows direct iden-tification of the mass balance gradient at this elevation (Ta-ble 2). The mass balance gradient is determined using data from an elevation of 925 to 1100 m a.s.l., as this is the inter-val with consistent data each year.
Table 2.Accumulation measurements on longitudinal probing transect from 990 to 1100 m a.s.l. above the TSL on Taku Glacier in July 1998, 2004, 2005 and 2010.
Pt. Name Easting Northing Elevation 1998 2004 2005 2010
(m a.s.l.) (mm w.e.) (mm w.e.) (mm w.e.) (mm w.e.)
P1 541911 6501411 1099 910 1001 1030
P2 542013 6501311 1097 938 980
P3 542115 6501200 1094 850 954 960
P4 542217 6501111 1092 925 1221
P5 542319 6501000 1090 770 893 1177
P6 542454 6500911 1089 800 882 1148
P7 542568 6500800 1087 873 960
P8 542669 6500712 1085 850 859 962
P9 542783 6500601 1084 815 1075
P10 542885 6500501 1082 910 871 1112
P11 542998 6500412 1081 916 1110
P12 543100 6500312 1078 936 1030 1370
P13 543202 6500201 1077 880 889 1143 1434
P14 543304 6500101 1074 902 1156 1419
P15 543395 6500012 1073 992 1171 1435
P16 543519 6499901 1070 770 1001 1218 1443
P17 543599 6499801 1068 1035 1302 1413
P18 543712 6499701 1066 750 1004 1307 1385
P19 543814 6499612 1063 963 1312 1316
P20 543905 6499512 1060 981 1318 1327
P21 543996 6499412 1057 850 959 1344 1365
P22 544086 6499312 1056 945 1278 1396
P23 544189 6499201 1052 983 1278 1383
P24 544291 6499113 1050 830 950 1259 1350
P25 544393 6499001 1047 927 1164 1350
P26 544495 6498901 1044 830 920 1161 1303
P27 544574 6498813 1042 866 1116 1238
P28 544688 6498713 1039 844 1142 1295
P29 544790 6498602 1036 740 814 1078 1226
P30 544903 6498513 1033 796 1092 1202
P31 544994 6498391 1031 774 1016 1225
P32 545074 6498302 1030 740 734 1052 1208
P33 545187 6498202 1027 707 1041 1213
P34 545289 6498102 1025 660 689 1022 1180
P35 545380 6498002 1022 684 968 1154
P36 545482 6497891 1021 660 697 963 1120
P37 545562 6497791 1019 666 975 1141
P38 545642 6497713 1016 610 670 957 1118
P39 545733 6497613 1013 639 941 1073
P40 545846 6497513 1010 550 661 922 1071
P41 545948 6497425 1006 668 938 1090
P42 546039 6497313 1003 560 621 901 1109
P43 546130 6497213 1000 659 889 1090
P44 546232 6497102 996 490 639 858 1099
P45 546323 6497025 994 605 879 1079
P46 546414 6496914 992 550 565 834 1040
P47 546516 6496803 989 617 843 1025
P48 546607 6496714 988 440 590 841 1066
P49 546698 6496603 985 617 815 1070
P50 546800 6496503 981 410 646 726 1135
P51 546891 6496403 977 576 789 1096
P52 547005 6496314 972 380 574 675 1135
P53 547107 6496214 967 601 725 1116
P54 547198 6496114 963 583 688 1116
P55 547300 6496003 960 360 587 694 1077
P56 547391 6495903 956 405 680 1025
P57 547494 6495792 953 310 330 606 1036
P58 547596 6495715 949 780 1034
P59 547709 6495604 944 757 945
P60 547789 6495504 940 680 913
P61 547914 6495393 935 744 905
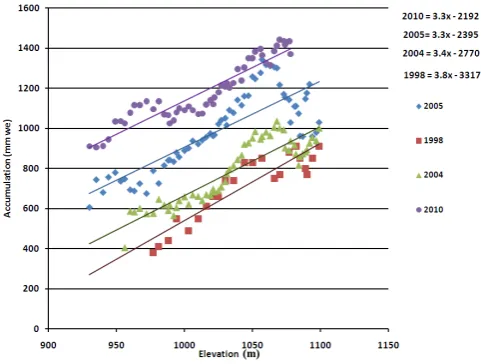
Figure 6.Annual surface mass balance profile on Lemon Creek Glacier for 1998 and 2003–2011, and probing gradient from 1998.
mass balance gradient measurement. The mass balance gra-dient derived from the snow pits was 2.6–3.5 mm m−1. This is less than that for probing, but the TSL on the date of snow pit excavation is almost always lower than the lowest eleva-tion of the probing transects and represents a lower elevaeleva-tion band of 800 to 1000 m a.s.l.
On Lemon Creek Glacier the mass balance gradient gen-erated annually from the ELA and snow pit elevations illus-trates the similarity of the mass balance gradient from year to year. The mass balance gradient parallels the probed gradient in 1998 and has a range of 4.6 to 5.1 mm m−1(Fig. 6).
Balance gradient from TSL variation
The TSL is readily identifiable on 34 Landsat scenes ac-quired from 1995 to 2011, and was delineated using the soft-ware package US Geological Survey Globalization Viewer. The Juneau Icefield falls in path/row 58/19 and 57/19; all im-ages are false color RGB composites, bands 3, 4, and 5, with a 2 % linear stretch applied. Selected scenes are cloud free at the TSL and because of low surrounding mountain slopes shadows are not an issue. The spatial resolution of 30 m, combined with mean surface gradients of 0.04–0.08 m m−1, yields an error of less than ±5 m in TSL elevation. The exception is when the TSL rises to 1200 m a.s.l. or is be-low 900 m a.s.l. on Lemon Creek Glacier; in both cases the surface slopes increases, leading to higher error margins. The satellite images were georeferenced in ArcMap 9.3 us-ing five topographically unique reference points. The data frame containing imagery and base map was transformed to NAD_1983_UTM_Zone_8N to ensure spatial accuracy for measurements (Mernild et al., 2013). For years with multiple images, the rate of rise of the TSL is determined. This rate of rise is only calculated for periods of longer than 15 days. The 15 day or greater time period is chosen because errors in TSL elevation assessment are constant regardless of time
Figure 7.TSL identification on Taku Glacier in 2006 Landsat im-age from 9/14/2006. A=5/26/2006, B=7/5/2006, C=7/28/2006, D=9/14/2006.
period length; hence longer time periods reduce the error in calculation of the rate of rise.
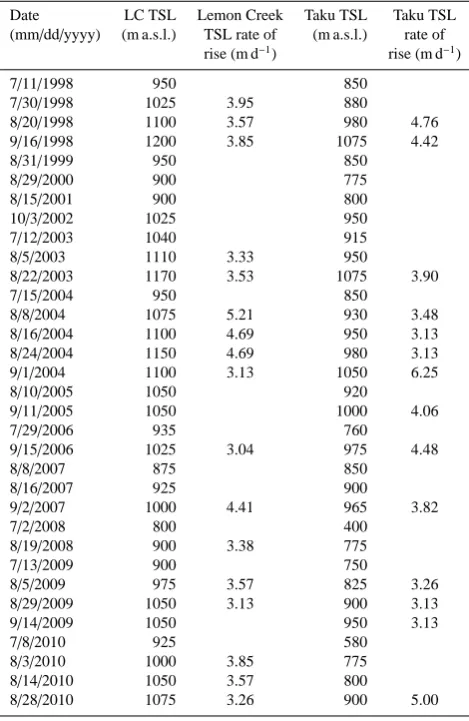
For example, in 2006 the TSL was identified in five Land-sat images on Taku Glacier. The TSL in 2006 rose from 370 m a.s.l. on 26 May to 575 m a.s.l. on 10 June, 730 m a.s.l. on 5 July, 760 m a.s.l. on 29 July, and finally 975 m a.s.l. on 15 September (Fig. 7; Table 3). The TSL rise ranged from 3.1 to 6.2 m d−1. Mean rise of the TSL for 15 periods aver-ages 4.1±0.9 m d−1during the July–September period, for the elevation range between 750–1100 m a.s.l. (Table 3; Fig. 7).
The TSL for Lemon Creek Glacier was observed for 34 dates from 1998–2011; these observations define 18 time periods for which satellite observations were at least 15 days apart (Table 3; Fig. 8). For Lemon Creek Glacier the observed positive TSL migration rates varied from 3.0 to 5.2 m d−1, with a mean of 4.0±0.6 m d−1. The mean TSL mi-gration rate on Lemon Creek Glacier of 3.8 m d−1compares well with the mean migration rate of 3.7 m d−1 on nearby Taku Glacier (Pelto, 2011). This suggests a consistency in the rate of rise of the TSL from glacier to glacier and year to year on the Juneau Icefield.
6 ELA–TSL observations
Table 3.Transient snow line observation on Lemon Creek Glacier (LCG) and Taku Glacier (TG), and the respective rates of rise be-tween image dates at least 16 days apart. The date listed is the final date of the measurement interval. Rate of rise is not calculated for Taku Glacier if the TSL is below 800 m a.s.l.
Date LC TSL Lemon Creek Taku TSL Taku TSL
(mm/dd/yyyy) (m a.s.l.) TSL rate of (m a.s.l.) rate of
rise (m d−1) rise (m d−1)
7/11/1998 950 850
7/30/1998 1025 3.95 880
8/20/1998 1100 3.57 980 4.76
9/16/1998 1200 3.85 1075 4.42
8/31/1999 950 850
8/29/2000 900 775
8/15/2001 900 800
10/3/2002 1025 950
7/12/2003 1040 915
8/5/2003 1110 3.33 950
8/22/2003 1170 3.53 1075 3.90
7/15/2004 950 850
8/8/2004 1075 5.21 930 3.48
8/16/2004 1100 4.69 950 3.13
8/24/2004 1150 4.69 980 3.13
9/1/2004 1100 3.13 1050 6.25
8/10/2005 1050 920
9/11/2005 1050 1000 4.06
7/29/2006 935 760
9/15/2006 1025 3.04 975 4.48
8/8/2007 875 850
8/16/2007 925 900
9/2/2007 1000 4.41 965 3.82
7/2/2008 800 400
8/19/2008 900 3.38 775
7/13/2009 900 750
8/5/2009 975 3.57 825 3.26
8/29/2009 1050 3.13 900 3.13
9/14/2009 1050 950 3.13
7/8/2010 925 580
8/3/2010 1000 3.85 775
8/14/2010 1050 3.57 800
8/28/2010 1075 3.26 900 5.00
having an observation within a short period of the end of the ablation season. The last usable Landsat image for the ablation season is used to assess the TSL for six glaciers of the Juneau Icefield from 1995 to 2011: Eagle, Herbert, Lemon Creek, Mendenhall, Norris and Taku (Table 4; Fig. 9). The observed TSL between glaciers is highly correlated for all glaciers with R2 exceeding 0.82 in all cases. This paper presents only a single late season TSL from each year; addi-tional analysis is required to determine the rate of change of TSL in September for each glacier, which will allow a more precise determination of the ELA. The ELA can be reason-ably estimated from the late season TSL observation on each glacier once both the rate of rise and the date of the end of the ablation season are known. The date of the end of the ablation season can be determined from climate records. The ELA in turn is a good indicator of Ba (Rabatel et al., 2005). The World Glacier Monitoring Service derives plots of ELA
ver-Figure 8.TSL elevation rise rate on Taku Glacier and Lemon Creek Glacier for selected periods of at least 15 days where the TSL could be identified using Landsat imagery. The date given is the end of the period. Table 3 contains the raw data.
Figure 9.Transient snow line elevation on the same date on six Juneau Icefield glaciers, 1995–2011.
sus Baeach year for each glacier. The plots generated for the WGMS (2011) from Lemon Creek Glacier are below. The fit is not good for Taku Glacier, R2=0.66 (Fig. 10). The fit for Lemon Creek Glacier is excellent for the ELA-Ba, R2=0.87 (Fig. 11).
7 Conclusions
Table 4.TSL observation (m a.s.l.) on the same date from Landsat Images on six Juneau Icefield glaciers.
Date (mm/dd/yyyy) Norris Taku Lemon Creek Mendenhall Herbert Eagle
8/29/1995 975 1025 1125 1075 1100 1050
9/4/1996 1050 1075 1150 1125 1150 1175
9/6/1997 1100 1125 1300 1200 1200 1175
9/16/1998 1050 1075 1200 1175 1150 1150
8/31/1999 750 850 950 900 925 900
8/29/2000 750 775 900 875 925 900
8/15/2001 800 800 900 900 925 900
10/3/2002 925 950 1025 1050 1075 1025
10/1/2003 1000 1075 1300 1150 1175 1150
9/1/2004 1075 1050 1100 1150 1200 1200
9/11/2005 1000 1000 1050 1050 1100 1100
9/16/2006 1025 975 1025 1125 1150 1150
9/22/2007 925 925 1000 1050 1050 1025
8/19/2008 700 775 900 850 900 900
9/14/2009 925 950 1050 1050 1050 1050
9/18/2010 950 975 1075 1075 1050 1025
9/11/2011 1000 975 1100 1150 1150 1125
Figure 10.Relationship of Taku Glacier annual surface mass bal-ance and the ELA.
accumulation and ablation across the glacier. The mass bal-ance records also warrant the detailed investigation that has been undertaken on Wolverine Glacier and Gulkana Glacier to better evaluate potential error.
The mass balance profile and gradient of the Taku Glacier and Lemon Creek Glacier is consistent in the region near the ELA from year to year. The rate of rise of the TSL is rela-tively consistent from year to year and glacier to glacier on the Juneau Icefield. The ELA provides a reasonable first es-timate of Baon Taku Glacier and Lemon Creek Glacier, and, as such, determination of this relationship for other Juneau Icefield glaciers utilizing simultaneous TSL variations with
Figure 11.Relationship of Lemon Creek Glacier annual surface mass balance and the ELA.
Lemon Creek and Taku Glacier has value. Taku Glacier has a large surface area in the vicinity of the ELA, which makes the glacier sensitive to small changes in the ELA and small changes in the balance profile near the ELA. Both would re-duce the correlation between ELA and Ba. Continued use of direct field observations of the mass balance gradient and TSL variation should help better identify not only the ELA, but aid in adjusting the annual mass balance gradient in this critical interval (Mernild et al., 2013).
Edited by: D. Carlson
References
Arendt, A. A.: Volume changes of Alaska glaciers: contributions to rising sea level and links to climate change, Ph.D. dissertation, University of Alaska, Fairbanks, 2006.
Arendt, A. A., Echelmeyer, K. A., Harrison, W. D., Lingle, C. S., and Valentine, V. B.: Rapid wastage of Alaska glaciers and their contribution to rising sea level, Science, 297, 382–386, 2002. Boyce, E., Motyka, R., and Truffer, M.: Flotation and retreat of
a lake-calving terminus, Mendenhall Glacier, southeast Alaska, USA, J. Glaciol., 53, 211–224, 2007.
Cogley, J. G., Hock, R., Rasmussen, L. A., Arendt, A. A., Bauder, A., Braithwaite, R. J., Jansson, P., Kaser, G., Möller, M., Nichol-son, L., and Zemp, M.: Glossary of glacier mass balance and re-lated terms, UNESCO – International Hydrological Programme, IACS, IHP-VII Technical Documents in Hydrology, No. 86, 2011.
Criscitiello, A., Kelly, M., and Tremblay, B.: The Response of Taku and Lemon Creek Glaciers to Climate, Arct. Antarct. Alp. Res., 42, 34–44, 2010.
Heusser, C. E. and Marcus, M. G.: Surface movement, hydrological change and equilibrium flow on Lemon Creek Glacier, Alaska, J. Glaciol., 5, 61–75, 1964.
Hock, R., Koostra, D., and Reijmeer, C.: Deriving glacier mass bal-ance from accumulation area ratio on Storglaciären, Sweden, in: Glacier Mass Balance Changes and Meltwater Discharge IAHS, 318, 163–170, 2007.
LaChapelle, E. R.: Snow studies on the Juneau Icefield, in: Variabil-ity of glacier mass, edited by: Walters, R. A. and Meier, M. F., American Geographical Society, JIRP Report no. 9, 1589, 1954. Larsen, C. F., Motyka, R. J., Arendt, A. A., Echelmeyer, K. A., and Geissler, P. E.: Glacier changes in southeast Alaska and north-west British Columbia and contribution to sea level rise, J. Geo-phys. Res., 112, F01007, doi:10.1029/2006JF000586, 2007. March, R. S. and Trabant, D. C.: Mass balance,
meteorologi-cal, ice motion, surface altitude, and runoff data at Gulkana Glacier, Alaska, 1992 balance year: U.S. Geological Survey Water-Resources Investigations Report 95-4277, 1996.
Marcus, M. G., Chambers, F. B., Miller, M. M., and Lang, M.: Re-cent trends in The Lemon Creek Glacier, Alaska, Phys. Geogr., 16, 150–161, 1995.
Mayo, L. R., Trabant, D. C., and March, R. S.: A 30-Year Record of Surface Mass Balance (1966–95), and Motion and Surface Al-titude (1975–95) at Wolverine Glacier, Alaska: U.S. Geological Survey Open-File Report 2004–1069, 2004.
Mernild, S., Pelto, M., Malmros, J., Yde, J., Knudsen, N., and Hanna, E.: Identification of snow ablation rate, ELA, AAR and net mass balance using transient snowline vari-ations on two Arctic glaciers, J. Glaciol., 59, 649–659, doi:10.3189/2013JoG12J221, 2013.
Miller, M. M.: A principles study of factors affecting the hydro-logical balance of the Lemon Creek Glacier system and adjacent sectors of the Juneau Icefield, SE Alaska, 1965–1969, Institute of Water Research, Michigan State University and the U.S. Fed-eral Office of Water Resources Research, Department of Interior, Publication No. 33, 1–295, 1972.
Miller, M. M. and Pelto, M. S.: Mass Balance measurements on the Lemon Creek Glacier, Juneau Icefield, AK 1953–1998, Geogr. Ann., 81A, 671–681, 1999.
Motyka, R. J. and Echelmeyer, K. A.: Taku Glacier (Alaska, U.S.A.) on the move again: active deformation of proglacial sediments, J. Glaciol., 49, 50–59, 2003.
Nolan, M., Motyka, R., Echelmeyer, K., and Trabant, D.: Ice thick-ness Measurements of Taku Glacier, Alaska, USA, and their Rel-evance to it Recent Behavior, J. Glaciol., 41, 541–552, 1995. Pelto, M.: Utility of late summer transient snowline migration
rate on Taku Glacier, Alaska, The Cryosphere, 5, 1127–1133, doi:10.5194/tc-5-1127-2011, 2011.
Pelto, M. and Miller, M. M.: Mass Balance of the Taku Glacier, Alaska from 1946 to 1986, Northwest Sci., 64, 121–130, 1990. Pelto, M. S., Miller, M. M., Adema, G. W., Beedle, M. J., McGee, S.
R., Sprenke, K. F., and Lang, M.: The equilibrium flow and mass balance of the Taku Glacier, Alaska 1950–2006, The Cryosphere, 2, 147–157, doi:10.5194/tc-2-147-2008, 2008.
Post, A. and Motyka, R.: Taku and Le Conte Glaciers, Alaska: Calv-ing speed control of late-Holocene asynchrounous advances and retreats, Phys. Geogr., 16, 59–82, 1995.
Rabatel, A., Dedieu, J., and Vincent, C.: Using remote-sensing data to determine equilibrium line altitude and mass balance time se-ries: validation on three French glaciers, 1994–2002, J. Glaciol., 51, 539–546, 2005.
Ramage, J. M., Isacks, B. L., and Miller, M. M.: Radar Glacier zones in southeast Alaska, U.S.A.: field and satellite observa-tions, J. Glaciol., 46, 287–296, 2000.
Sapiano, J. J., Harrison, W. D., and Echelmeyer, K. A.: Elevation, volume and terminus changes of nine glaciers in North America, J. Glaciol., 44, 119–135, 1998.
Van Beusekom, A. E., O’Neel, S. R., March, R. S., Sass, L. C., and Cox, L. H.: Re-analysis of Alaskan benchmark glacier mass balance data using the index method: U.S. Geological Survey Scientific Investigations Report 2010–5247, 2010.