L E T T E R T O T H E E D I T O R
Open Access
Towards precision quantification of
contamination in metagenomic sequencing
experiments
M. S. Zinter
1, M. Y. Mayday
1, K. K. Ryckman
2, L. L. Jelliffe-Pawlowski
3,4and J. L. DeRisi
5,6,7*Abstract
Metagenomic next-generation sequencing (mNGS) experiments involving small amounts of nucleic acid input are highly susceptible to erroneous conclusions resulting from unintentional sequencing of occult contaminants, especially those derived from molecular biology reagents. Recent work suggests that, for any given microbe detected by mNGS, an inverse linear relationship between microbial sequencing reads and sample mass implicates that microbe as a contaminant. By associating sequencing read output with the mass of a spike-in control, we demonstrate that contaminant nucleic acid can be quantified in order to identify the mass contributions of each constituent. In an experiment using a high-resolution (n= 96) dilution series of HeLa RNA spanning 3-logs of RNA mass input, we identified a complex set of contaminants totaling 9.1 ± 2.0 attograms. Given the competition between contamination and the true microbiome in ultra-low biomass samples such as respiratory fluid, quantification of the contamination within a given batch of biological samples can be used to determine a minimum mass input below which sequencing results may be distorted. Rather than completely censoring contaminant taxa from downstream analyses, we propose here a statistical approach that allows separation of the true microbial components from the actual contribution due to contamination. We demonstrate this approach using a batch ofn= 97 human serum samples and note that despiteE. colicontamination throughout the dataset, we are able to identify a patient sample with significantly moreE. colithan expected from contamination alone. Importantly, our method assumes no prior understanding of possible contaminants, does not rely on any prior collection of environmental or reagent-only sequencing samples, and does not censor potentially clinically relevant taxa, thus making it a generalized approach to any kind of metagenomic sequencing, for any purpose, clinical or otherwise.
Keywords:Metagenomics, Sequence analysis, DNA, DNA contamination, Regression analysis, Microbiota
Main text
Metagenomic next-generation sequencing (mNGS) is a highly sensitive tool capable of detecting even single frag-ments of nucleic acid. While this sensitivity allows for de-tection of rare organisms within a much larger host background, sensitivity is a double-edged sword, as reagent and environmental contamination, ubiquitous in sequen-cing experiments, will also be detected and potentially misinterpreted. Contamination can be introduced by the environment, reagents, handlers, or machines at any point
during the collection of the sample, the extraction of nu-cleic acid, or the preparation of libraries [1–6]. This can lead to results that vary widely between laboratories, re-agent kits, or extraction batches [6–8], can result in false-negative or false-positive assessments [9–12], and can provide misleading information about microbiological niches [13–16]. While steps can be taken to minimize con-tamination, existing best practices are unable to com-pletely prevent it or control for it; therefore, it is critical that contamination is addressed during sequencing ana-lyses in order to prevent misleading results, particularly from low biomass samples [4,8,10,12,16–21].
In the December 2018 issue of Microbiome, Davis et al. present an elegant approach to the identification of contamination in metagenomic sequencing results [22].
© The Author(s). 2019Open AccessThis article is distributed under the terms of the Creative Commons Attribution 4.0 International License (http://creativecommons.org/licenses/by/4.0/), which permits unrestricted use, distribution, and reproduction in any medium, provided you give appropriate credit to the original author(s) and the source, provide a link to the Creative Commons license, and indicate if changes were made. The Creative Commons Public Domain Dedication waiver (http://creativecommons.org/publicdomain/zero/1.0/) applies to the data made available in this article, unless otherwise stated.
* Correspondence:[email protected]
5Department of Biochemistry and Biophysics, University of California, San
Francisco School of Medicine, San Francisco, CA, USA
6Chan Zuckerberg Biohub, San Francisco, CA, USA
Their approach relies on two core principles: first, that contaminant sequences are inversely correlated with total sequencing reads (the frequency-based approach), and second, that contaminant sequences are present in more controls than samples (the prevalence-based ap-proach). Their work employs several statistical methods that culminate in a classification threshold ranging from 0 to 1. Once the threshold is set (the authors recom-mend 0.1 to start), a list of contaminant DNA can be compiled. Analyzing sequences according to these prin-ciples eliminates the need to assign an arbitrary thresh-old for removing sequences and reduces reliance on an a prioriset list of known contaminants. Davis et al. then provide a user-friendly R package entitleddecontamand validate their approach on multiple datasets to demon-strate robust detection of contaminating sequences in both shotgun and 16S sequencing results [22,23].
The approach employed by Davis et al. is particularly useful in identifying contamination in low biomass sam-ples, and the authors rightly point out that the assumptions of their approach break down when the contaminant mass (C) approaches the total input sample mass (S). For any given sample in any given mNGS experiment, the exact limit at which input sample mass becomes so small that contamination dominates the results remains unknown.
In our own work in the area of clinical mNGS, this issue has been a cause of constant concern [16,24]. Paralleling the work of Davis et al., we sought better methods to characterize the lower limit of sample input in order to automatically both identify and quantify the contribution of each contaminating component. Here, we suggest an amendment to the method of Davis et al. This improve-ment relies on determining an association between se-quencing read output and input mass, made possible through the incorporation of a series of precise spike-in controls. In doing so, a straightforward statistical method allows the identification and separation of contaminating components from those inherent to the sample itself, without censoring.
To demonstrate this, we prepared in triplicate a set of 32 samples consisting of between 1 picogram (pg) and 2.5 nanograms (ng) of RNA extracted from a single stock of the HeLa cell line. To each sample, we added 25 pg of a stock of 92 standardized RNA transcripts present in vary-ing concentrations rangvary-ing from 1.4 × 10⁻²
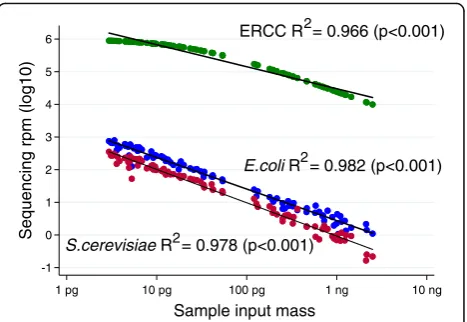
to 3.0 × 10⁻²² mol/L (External RNA Controls Consortium, ERCC, Thermo Fisher Cat #4456740), which we have previously demonstrated can facilitate quantitation of ultra-low bio-mass samples [25]. Each sample then underwent library preparation (New England Biolabs Ultra II RNA Library Prep Kit) followed by 125 base paired-end sequencing on an Illumina HiSeq 4000 to a median depth of 26.9 million read-pairs per sample (interquartile range [IQR] 24.1– 30.8). As depicted in Fig.1, the log10-transformed sum of
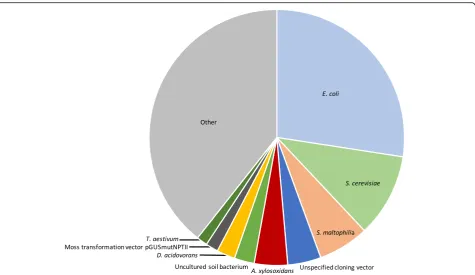
sequencing reads for the 92 ERCC transcripts is indeed in-versely proportional to the log10-transformed total input sample mass (linear regression R2 = 0.966, p < 0.001). Using this fact, the calculation associating microbial se-quencing reads and input sample mass for all microbial taxa identified in the experiment may be automated, thus directly facilitating the unbiased determination of taxa that demonstrate contaminant behavior. Simply by solving the equationcontaminant mass/ERCC mass = contamin-ant reads/ERCC reads, the mass contribution of each con-taminant may be quantified for each experiment (Fig. 2). In this set of samples, the sum mass of all contaminants was 9.1 ± 2.0 attograms, which suggests that samples of less than 10 ag may be overwhelmed by contamination bias and thus would be unusable. This measurement in-corporates only high-quality microbial reads and could be adapted to include other contaminating reads such as human-derived or low-quality microbial reads as needed. Of note, statistical confidence in the ability to estimate the molar contribution of each contaminating taxa actually in-creases when the experimental batch contains samples that vary over a wide range of input masses, suggesting that sub-sampling input nucleic acid across a batch of samples to approximately the same input mass prior to li-brary preparation may, in fact, be contraindicated.
After microbial taxa are binned as either contaminant or true constituent of the microbiome, Davis et al. propose that contaminant taxa are censored from the dataset and nicely demonstrate a reduction in batch effect and other experimental improvements. However, as described by the authors, one significant limitation of the approach is that “decontam assumes that contaminants and true
ERCC R = 0.966 (p<0.001)
E.coli R = 0.982 (p<0.001) 2
2
S.cerevisiae R = 0.978 (p<0.001)2
-1 0 1 2 3 4 5 6
Sequencing rpm (log10)
1 pg 10 pg 100 pg 1 ng 10 ng
Sample input mass
community members are distinct from one another.” In our view, such binary assignments are not realistic for a number of important microbes in numerous experimental situations. Consider the example of a human patient har-boring anEscherichia colibloodstream infection. AsE. coli appears to be a ubiquitous laboratory contaminant, at-tempts to sequence the metagenome from a blood sample would produce a finalE. colisequencing count with contri-butions from both reagent contamination and the true microbiome. Disregarding E. coli as a component of the microbiome based on its identification as a contaminant would result in a false negative report, which could be dis-astrous in the field of clinical metagenomics for infectious disease diagnostic purposes. Similar vignettes can be de-scribed for numerous microbes that are both pathogenic and common laboratory contaminants, including Staphylo-coccus aureusandPseudomonas aeruginosa.
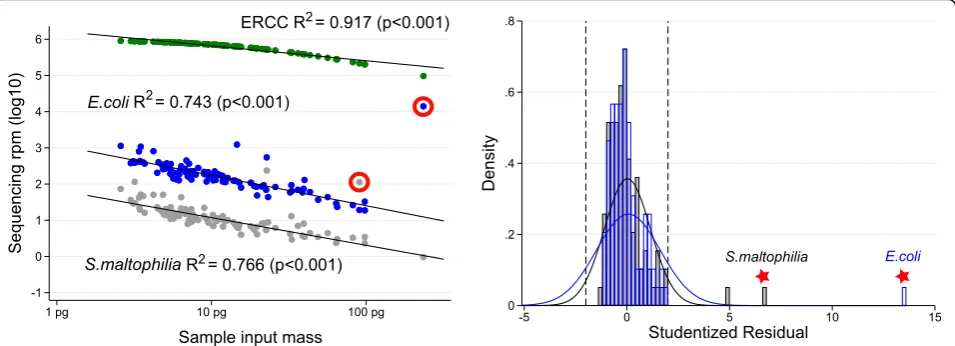
We propose the following logical extension of Davis et al. After the establishment of the inverse linear relation-ship between contaminant reads and input sample mass in an experiment, the quantity of microbial reads for a given taxa in a given sample can be described according to its deviation from the value predicted by the above-described linear regression. Dividing this value by
the standard error produces the studentized residual, which can serve to identify outliers to the linear relation-ship while also accounting for varying statistical power at different points along the linear regression [26]. To dem-onstrate the value of this approach, we prepared sequen-cing libraries from 97 de-identified serum samples from pregnant women collected with informed consent (UCSF IRB 12-090702). As described above, RNA was extracted from 100 microliters (uL) of serum, and then combined with 25 pg ERCC RNA spike-in control set. Following li-brary preparation, as described in [23], 125 base paired-end sequencing on an Illumina NovaSeq instru-ment was conducted to a median depth of 34.6 million read-pairs per sample (IQR 28.3–43.6). Using the above-described workflow, we identified numerous con-taminant microbes including both non-pathogenic labora-tory contaminants such as Delftia acidovorans and Achromobacter xylosoxidansas well as potentially patho-genic organisms including Escherichia coliand Stenotro-phomonas maltophilia. Rather than censoring E. coli results from the dataset, we use the studentized residual approach to identify a patient withmore E. coli than ex-pected from contamination alone (Fig. 3). Phylogenetic tree analysis suggests the E. coli in this sample to be
Fig. 2Precision quantification of microbial contamination in sequencing experiments. For each ofn= 32 HeLa input masses (measured in triplicate), microbial contaminants were identified if the inverse linear relationship associating log10-transformed rpm of any given microbe with the log10
phylogenetically distinct from the E. coli in our no-template controls. Using this methodology, we noted an additional patient sample as possessing a quantity ofS. maltophiliain excess of what was expected from contam-ination alone. Orthogonal confirmation of the presence of E. coli and S. maltophilia RNA in the original sera was performed using custom reverse transcription primers followed by Sanger sequencing1. Of note, to avoid the po-tential for confusing distinct organisms with highly similar genomes, we recommend examining each taxa at the highest resolution (lowest phylogenetic level) supported by the depth of sequencing and the detection within the metagenome. The non-human (microbial) reads from this dataset are available under the Sequence Read Archive (SRA) BioProject ID PRJNA516238.
In summary, Davis et al. present an intuitive and straightforward approach to identifying contamination in metagenomic sequencing experiments. When microbe se-quencing quantity is inversely proportional to total sample input mass, it is suspicious for contamination; we thus suggest that assessing the studentized residual for each sample can provide a probabilistic assessment of the de-gree to which a contaminant might also be present in the true sample metagenome. The inclusion of ERCC controls provides the additional benefit of allowing sample input mass to be calculated even for picogram-level samples. In short, this statistical approach allows an investigator to separate the estimated contribution from contamination from the true sample-derived component without censor-ing the organism from all further analyses. Importantly, our method assumes no prior understanding of possible contaminants and does not rely on any prior collection of
environmental or reagent-only sequencing samples, thus making it a generalized approach to any kind of metage-nomic sequencing, for any purpose, clinical or otherwise.
Endnotes 1
The presence ofE. coliandS. maltophilia RNA in the original sera was confirmed using custom PCR primers for the following inserts with 100% BLAST homology for their respective species. E. coli insert: TCAGCACGATTT CAGTCTGAGTCGGACATTCAGCAGTGATACCCGCA GGCAGCTGATGGTCAACAGGATGAGAGAAACCCA GAGACAGGTTAATCACATTGCCTTTAACCGCTGCA CGGTAACCTACACCAACCAGCTGCAGCTTCTTAGT GAAGCCTTCGGTAACACCGATAACCATTGAGTTCA GCAGGGCACGCGCGGTACCAGCCTGTGCCCAACC GTCTGCGTAACCATCACGCGGACCGAAGGTCAGG GTATTATCTGCATGTTTAACTTCAACAGCATCGTT. S. maltophilia insert: ATAGCCCTGTATCTGAAAGGG CCATTTCAGTGAAGACGAGTAGGGCGGGGCACGT GAAACCCTGTCTGAACATGGGGGGACCATCCTCCA AGGCTAAATACTACTGACCGACCGATAGTGAACCA GTACCGTGAGGGAAAGGCGAAAAGAACCCCGGAG AGGGGAGTGAAATAGAACCTGAAACCGTGTGCGT ACAAGCAGTAGGAGCTCCGCAAGGAGTGACTGCG TACCTTTTGTATAATGGGTCAGCGACTTACTG
Abbreviations
ERCC:External RNA Controls Consortium; IQR: Interquartile range;
mNGS: Metagenomic next-generation sequencing; SRA: Sequence Read Archive
Acknowledgements
Not applicable.
Fig. 3Identification of outliers among contaminant microbes. Left: for each ofn= 97 serum sample RNA input masses, sequencing reads for the total ERCC set (n= 92 different transcripts) are normalized per million (rpm) and presented in green; sequencing rpm aligning to theE. coligenome are presented in blue; and sequencing rpm aligning to theS. maltophiliagenome are presented in grey. The linear regressions associating sample input mass with ERCC,E. coli, andS. cerevisiaeare described with the adjustedR2andpvalue. Right: a histogram of the studentized residual for each observation informing the linear regression between log10-transformed sequencing reads (E. coliin blue,S. maltophiliain grey) and log10-transformed
Funding
Zinter MS received funding from the Eunice Kennedy Shriver National Institute of Child Health & Development K12HD000850. Ryckman KK and Jelliffe-Pawlowski LL received funding from the University of California, San Francisco California Preterm Birth Initiative (PTBi-CA). DeRisi JL received funding from the Chan Zuckerberg Biohub.
Availability of data and materials
Data files are available in the Sequence Read Archive as BioProjects PRJNA516238 and PRJNA516235. The IDseq bioinformatics pipeline for microbial taxa detection within metagenomic samples is freely available at: https://github.com/chanzuckerberg/idseq-web
Authors’contributions
All authors participated in the conception, planning, and writing of this manuscript. All authors approved of the final version.
Ethics approval and consent to participate
Methods and protocols for the study were approved by the Committee for the Protection of Human Subjects within the Health and Human Services Agency of the State of California (#12-090702).
Consent for publication
Not applicable.
Competing interests
The authors declare that they have no competing interests.
Publisher’s Note
Springer Nature remains neutral with regard to jurisdictional claims in published maps and institutional affiliations.
Author details
1Department of Pediatrics, Division of Critical Care, University of California,
San Francisco School of Medicine, Benioff Children’s Hospital, San Francisco, CA, USA.2Department of Epidemiology, University of Iowa, College of Public
Health, Iowa City, IA, USA.3Department of Epidemiology and Biostatistics, University of California, San Francisco School of Medicine, San Francisco, CA, USA.4California Preterm Birth Initiative, University of California San Francisco School of Medicine, San Francisco, CA, USA.5Department of Biochemistry
and Biophysics, University of California, San Francisco School of Medicine, San Francisco, CA, USA.6Chan Zuckerberg Biohub, San Francisco, CA, USA. 7
1700 4th St, 403C, Campus Box 2542, San Francisco, CA 94158-2330, USA.
Received: 30 January 2019 Accepted: 28 March 2019
References
1. Adams RI, Bateman AC, Bik HM, Meadow JF. Microbiota of the indoor environment: a meta-analysis. Microbiome. 2015;3:49.
2. Weiss S, Amir A, Hyde ER, Metcalf JL, Song SJ, Knight R. Tracking down the sources of experimental contamination in microbiome studies. Genome Biol. 2014;15(12):564.
3. Sinha R, Abnet CC, White O, Knight R, Huttenhower C. The microbiome quality control project: baseline study design and future directions. Genome Biol. 2015;16:276.
4. Salter SJ, Cox MJ, Turek EM, Calus ST, Cookson WO, Moffatt MF, Turner P, Parkhill J, Loman NJ, Walker AW. Reagent and laboratory contamination can critically impact sequence-based microbiome analyses. BMC Biol. 2014;12:87. 5. Kim D, Hofstaedter CE, Zhao C, Mattei L, Tanes C, Clarke E, Lauder A, Sherrill-Mix S, Chehoud C, Kelsen J, Conrad M, Collman RG, Baldassano R, Bushman FD, Bittinger K. Optimizing methods and dodging pitfalls in microbiome research. Microbiome. 2017;5(1):52.
6. de Goffau MC, Lager S, Salter SJ, Wagner J, Kronbichler A, Charnock-Jones DS, Peacock SJ, Smith GCS, Parkhill J. Recognizing the reagent microbiome. Nat Microbiol. 2018;3(8):851–3.
7. Willerslev E, Hansen AJ, Poinar HN. Isolation of nucleic acids and cultures from fossil ice and permafrost. Trends Ecol Evol. 2004;19(3):141–7. 8. Glassing A, Dowd SE, Galandiuk S, Davis B, Chiodini RJ. Inherent bacterial
DNA contamination of extraction and sequencing reagents may affect
interpretation of microbiota in low bacterial biomass samples. Gut Pathog. 2016;8:24. eCollection 2016.
9. Lee D, Das Gupta J, Gaughan C, Steffen I, Tang N, Luk KC, Qiu X, Urisman A, Fischer N, Molinaro R, Broz M, Schochetman G, Klein EA, Ganem D, Derisi JL, Simmons G, Hackett J Jr, Silverman RH, Chiu CY. In-depth investigation of archival and prospectively collected samples reveals no evidence for XMRV infection in prostate cancer. PloS One. 2012;7(9):e44954.
10. Bittinger K, Charlson ES, Loy E, Shirley DJ, Haas AR, Laughlin A, Yi Y, Wu GD, Lewis JD, Frank I, Cantu E, Diamond JM, Christie JD, Collman RG, Bushman FD. Improved characterization of medically relevant fungi in the human respiratory tract using next-generation sequencing. Genome Biol. 2014;15(10):487.
11. van der Zee A, Peeters M, de Jong C, Verbakel H, Crielaard JW, Claas EC, Templeton KE. Qiagen DNA extraction kits for sample preparation for legionella PCR are not suitable for diagnostic purposes. J Clin Microbiol. 2002;40(3):1126.
12. Laurence M, Hatzis C, Brash DE. Common contaminants in next-generation sequencing that hinder discovery of low-abundance microbes. PloS One. 2014;9(5):e97876.
13. Herrera A, Cockell CS. Exploring microbial diversity in volcanic
environments: a review of methods in DNA extraction. J Microbiol Methods. 2007;70(1):1–12.
14. Naccache SN, Greninger AL, Lee D, Coffey LL, Phan T, Rein-Weston A, Aronsohn A, Hackett J Jr, Delwart EL, Chiu CY. The perils of pathogen discovery: origin of a novel parvovirus-like hybrid genome traced to nucleic acid extraction spin columns. J Virol. 2013;87(22):11966–77.
15. Branton WG, Ellestad KK, Maingat F, Wheatley BM, Rud E, Warren RL, Holt RA, Surette MG, Power C. Brain microbial populations in HIV/AIDS: alpha-proteobacteria predominate independent of host immune status. PloS One. 2013;8(1):e54673.
16. Wilson MR, O'Donovan BD, Gelfand JM, Sample HA, Chow FC, Betjemann JP, Shah MP, Richie MB, Gorman MP, Hajj-Ali RA, Calabrese LH, Zorn KC, Chow ED, Greenlee JE, Blum JH, Green G, Khan LM, Banerji D, Langelier C, Bryson-Cahn C, Harrington W, Lingappa JR, Shanbhag NM, Green AJ, Brew BJ, Soldatos A, Strnad L, Doernberg SB, Jay CA, Douglas V, Josephson SA, DeRisi JL. Chronic Meningitis Investigated via Metagenomic Next-Generation Sequencing. JAMA Neurol. 2018.
17. Lauder AP, Roche AM, Sherrill-Mix S, Bailey A, Laughlin AL, Bittinger K, Leite R, Elovitz MA, Parry S, Bushman FD. Comparison of placenta samples with contamination controls does not provide evidence for a distinct placenta microbiota. Microbiome. 2016;4(1):29.
18. Kennedy K, Hall MW, Lynch MD, Moreno-Hagelsieb G, Neufeld JD. Evaluating bias of illumina-based bacterial 16S rRNA gene profiles. Appl Environ Microbiol. 2014;80(18):5717–22.
19. Aho VTE, Pereira PAB, Haahtela T, Pawankar R, Auvinen P, Koskinen K. The microbiome of the human lower airways: a next generation sequencing perspective. World Allergy Organ J. 2015;8(1):23. eCollection 2015. 20. Minich JJ, Zhu Q, Janssen S, Hendrickson R, Amir A, Vetter R, Hyde J, Doty
MM, Stillwell K, Benardini J, Kim JH, Allen EE, Venkateswaran K, Knight R. KatharoSeq enables high-throughput microbiome analysis from low-biomass samples. mSystems. 2018;3(3).https://doi.org/10.1128/mSystems. 00218-17. eCollection 2018 May-Jun.
21. Eisenhofer R, Minich JJ, Marotz C, Cooper A, Knight R, Weyrich LS. Contamination in low microbial biomass microbiome studies: issues and recommendations. Trends Microbiol. 2019;27(2):105–17.
22. Davis NM, Proctor DM, Holmes SP, Relman DA, Callahan BJ. Simple statistical identification and removal of contaminant sequences in marker-gene and metagenomics data. Microbiome. 2018;6(1):226.
23. Karstens L, Asquith M, Davin S, Fair D, Gregory WT, Wolfe AJ, Braun J, McWeeney S. Controlling for contaminants in low biomass 16S rRNA gene sequencing experiments. bioRxiv.
24. Zinter MS, Dvorak CC, Mayday MY, Iwanaga K, Ly NP, McGarry ME, Church GD, Faricy LE, Rowan CM, Hume JR, Steiner ME, Crawford ED, Langelier C, Kalantar K, Chow ED, Miller S, Shimano K, Melton A, Yanik GA, Sapru A, DeRisi JL. Pulmonary Metagenomic Sequencing Suggests Missed Infections in Immunocompromised Children. Clin Infect Dis. 2018.
25. Mayday MY, Khan LM, Chow ED, Zinter MS, DeRisi JL. Miniaturization and optimization of 384-well compatible RNA sequencing library preparation. PloS one. 2019;14(1):e0206194.