DEMOGRAPHIC RESEARCH
VOLUME 28, ARTICLE 32, PAGES 917-950
PUBLISHED 24 APRIL 2013
http://www.demographic-research.org/Volumes/Vol28/32/ DOI: 10.4054/DemRes.2013.28.32
Research Article
Components and possible determinants
of the decrease in Russian mortality in
2004-2010
Vladimir M. Shkolnikov
Evgeny M. Andreev
Martin McKee
David A. Leon
© 2013 Shkolnikov, Andreev, McKee & Leon.
This open-access work is published under the terms of the Creative Commons Attribution NonCommercial License 2.0 Germany, which permits use, reproduction & distribution in any medium for non-commercial purposes, provided the original author(s) and source are given credit.
1 Background 918
2 Methods 919
2.1 Data and techniques 919
3 Results 920
3.1 Life expectancy at birth in Russia and comparator countries 920
3.2 Age patterns 922
3.3 Causes of death 922
3.4 Age- and cause-specific contributions to the increase in life expectancy
926
3.5 Russia compared with the UK 928
4 Discussion 930
4.1 Limitations 930
4.2 Cause-specific trends and international differences 931
4.3 Alcohol 932
4.4 Smoking 934
4.5 Health system performance 934
5 Conclusion 937
6 Acknowledgements 938
References 939
Components and possible determinants of the decrease in Russian
mortality in 2004-2010
Vladimir M. Shkolnikov1,2
Evgeny M. Andreev2
Martin McKee3
David A. Leon3
Abstract
BACKGROUND
After a long decline, life expectancy in Russia substantially increased in 2004-2010; this is the longest period of health improvement that has been observed in the country since 1965. This study is the first analysis of this positive trend.
OBJECTIVES
We seek to determine the causes and age groups that account for the additional years of life gained in 2004-10 and the remaining gap between Russia and Western countries, to assess to what extent these recent trends represent a new development relative to previous mortality fluctuations, and to identify possible explanations for the improvement.
METHODS
We present an analysis of trends in life expectancy, and in age- and cause-specific mortality in Russia and selected countries in Eastern and Western Europe. We use decomposition techniques to examine the life expectancy rise in 2004-2010 and the Russia-UK life expectancy gap in 2010.
1 Max Planck Institute for Demographic Research, Rostock, Germany. Corresponding author. E-mail: [email protected].
2 New Economic School, Moscow, Russia. 3
RESULTS
Like the previous mortality fluctuations that have occurred in Russia since the mid-1980s, the increase in life expectancy was driven by deaths at ages 15 to 60 from alcohol-related causes. Uniquely in the recent period, there were also improvements at older ages, especially in cerebrovascular disease mortality among women. In addition, there were reductions in deaths from avoidable causes, such as from tuberculosis and diabetes. The life expectancy gap between Russia and Western countries remains large, and is mostly attributable to deaths from cardiovascular disease, alcohol-related conditions, and violence.
CONCLUSIONS
The decrease in alcohol-related mortality may be attributable to measures taken in 2006 to control the production and sale of ethanol. The lower number of cerebrovascular-related deaths may reflect advancements in blood pressure control. The reduction in the number of deaths from tuberculosis and diabetes may be associated with a general improvement in health care. Although the decline in mortality since 2004 has been substantial, the question of whether it can be sustained remains open.
1. Background
Worldwide, life expectancy has increased steadily over the past six decades, with two main exceptions: the countries of sub-Saharan Africa severely afflicted by the AIDS epidemic, and the countries of the former Soviet Union (McMichael et al. 2004). However, in this latter group, it appears that there may be some grounds for optimism. Since 2004, Russia, along with most other former Soviet republics, has experienced clear and relatively steep increases in life expectancy. This is the longest period of improvement seen in Russia since the mid-1960s. What is unclear, however, is whether these trends are simply the latest phase in a continuing cycle of increases and decreases that have characterized mortality in Russia over the past three decades, or whether there are new features that mark a break from the past.
recovery. Again, however, this positive trend was short-lived (Shkolnikov, McKee, and Leon 2001), as it was reversed in the wake of a major financial crisis that hit Russia in 1998 (Shkolnikov et al. 2004). Remarkably, even though the 15 former Soviet republics had been independent since 1991, these trends were similar across the post-Soviet states until 1998, albeit with peaks and troughs of different magnitudes. After 1998, the three Baltic states, which by then were candidates for entry to the European Union, moved onto a new upward trajectory, which they have—with some minor interruptions— subsequently sustained (Karanikolos et al. in press).
In previous analyses, we have investigated the fluctuations in Russian mortality up to the mid-2000s (Leon et al. 1997; Shkolnikov, McKee, and Leon 2001; Shkolnikov et al. 2004; Shkolnikov, Andreev, and Jdanov 2008). We identified the key role played by the hazardous consumption of alcohol in these fluctuations (McKee, Shkolnikov and Leon 2001; Chenet et al. 1998; Leon, Shkolnikov, and McKee 2009), underpinned by a chaotic and rapid economic and social transition against a backdrop of minimally effective social safety nets (Walberg et al. 1998).
In this paper, we examine events in Russia, the largest of the former Soviet republics, in the years since 2004, the point at which life expectancy once again started to rise. In line with our previous approach, we systematically investigate how deaths from major causes in each age group contributed to this improvement, paying particular attention to the features that differentiate this positive trend from past periods of improvement, when the gains were less enduring. We also compare the current mortality profile in Russia with that of a Western European country (the United Kingdom4) in order to better understand what additional steps may be required for Russia to converge with the West. Finally, we discuss the factors that may have led to these improvements in life expectancy in Russia, and the possible implications of our findings for future trends.
2. Methods
2.1 Data and techniques
We used data on mortality in Russia by sex, age, and cause of death since 1965. For the period 1965 to 1994, the data were extracted from the reconstructed series of mortality by causes of death produced by the Institut National d‘Edudes Démographiques (INED,
Paris, France) and the Centre for Demography and Human Ecology, Moscow, Russia (Meslé et al. 1996). Compared to the data in the WHO Mortality Database, these data include more detailed causes of death, cover a longer time period, and are adjusted for distortions induced by changes in the classification of causes of death.
For the period 1994 to 2010, similar data were extracted from the original files compiled by Rosstat, the Russian State Statistical Agency. It should be noted that, historically, the Russian statistical system used aggregated diagnostic categories rather than the more detailed International Classification of Diseases (ICD) issued by the World Health Organization. However, in the reconstructed data set, the 175 categories have been mapped onto broad categories within ICD-9. The data series was continued up to 1998. For the period 1999-2010, the data include about 270 causes based on detailed ICD-10 codes. In this paper, we aggregate these categories into broad groupings that are consistent across the time period.
We place the changes in Russia since 1965 within a broader context by comparing them with developments in selected comparator countries, from Eastern Europe (the Czech Republic, Estonia, and Ukraine) and from Western Europe (the UK), with these data extracted from the Human Mortality Database (Human Mortality Database 2012).
We then examined in more detail the change in overall life expectancy in Russia between 2003 and 2010, identifying the contribution of deaths from major causes, and in different age groups using the decomposition method developed by Andreev and colleagues (Andreev 1982; Andreev, Shkolnikov, and Begun 2002). A more detailed analysis of temporal changes in Russia and of the differences between Russia and the UK was undertaken using cause-specific age-standardized death rates. These were (directly) age-standardized using the European Standard Population (Benjamin and Pollard 1980; World Health Organisation Regional Office for Europe, 2012).
3. Results
3.1 Life expectancy at birth in Russia and comparator countries
expectancy gap between Russia and the UK from three years for men and 1.5 years for women in 1965, to 15 and seven years, respectively, in 2010.
The other extraordinary feature of the Russian trends shown in Figure 1 is the sharp fluctuation in life expectancy, which became particularly pronounced after 1984, when a series of steep increases and decreases occurred. These can be broken down into a number of phases: an increase in 1985-1987 (during the anti-alcohol campaign), a slow decrease in 1986-1991 (during the weakening of the campaign), a dramatic drop in 1992-1994 (following the collapse of the Soviet Union), an increase in 1995-1998 (a period of adaptation), a decrease in 1999-2003 (following the financial crisis in Russia in August 1998), and, finally, an increase since 2004. This most recent upward trend is of longer duration than any of the other preceding increases or decreases. The rate of improvement varied somewhat across the period. It was low in 2004-5, but greatly accelerated in 2006. A slowdown at the end can be attributed to the summer heat wave in 2010 (Revich and Shaposhnikov 2012).
Figure 1: Trends in life expectancy at birth in Russia and four other countries since 1965. In years
Men
55 60 65 70 75 80 85
1965 1970 1975 1980 1985 1990 1995 2000 2005 2010
Czech Republic Estonia Russia Ukraine United Kingdom
Women
55 60 65 70 75 80 85
1965 1970 1975 1980 1985 1990 1995 2000 2005 2010
The trends in Ukraine have broadly paralleled those in Russia. Although Estonia initially underwent the same sharp fluctuations in life expectancy, from 1998 onward its trajectory diverged from that of Russia, as the Baltic state experienced steep and consistent increases. Life expectancy in the Czech Republic, which had stagnated in the 1970s and 1980s (Chenet et al. 1996), started to increase almost as soon as communism in Czechoslovakia collapsed in 1989.
3.2 Age patterns
Figure 2 shows proportional changes in all-cause mortality at different ages in Russia since 1980. Although the amplitude of variation in each age group is larger for men than women, the pattern is very similar. During the period 1970 to 2003, the well-known contrast between improvement among children and deterioration or stagnation among adults is apparent. This has long been characteristic of the trends in mortality in Russia (Leon et al. 1997; Shkolnikov, Meslé, and Vallin 1996). Mortality in infancy and childhood had decreased continuously, while mortality in every adult age group has gone up and down with the same tempo. In relative terms, however, these fluctuations have been the most pronounced at the working ages of 15 to 59.
Since 2000, mortality among children has been decreasing at a faster pace than in the preceding decades. Since 2005, mortality has also declined at every adult age among both men and women, although at ages 50 and above the decline was already underway from 2003. As a consequence, the age-standardized death rates in 2010 were lower than those in 2003 by about 40% at ages zero to 14, 25% at ages 15 to 59, 20% at ages 60 to 74, and 15% at ages 75 and older. However, despite this relatively long period of improvement, it was only at ages 75 and above for men and 65 and above for women that mortality in 2010 was lower than at any point in the past. At younger adult ages, mortality in 2010 remained higher than the levels seen in the mid-1980s, when the anti-alcohol campaign was in full swing.
Figure 2: Trends in age-standardized death rates by broad age groups in Russia since 1980. Per 100,000 person-years
0-14 15-29 30-44 45-59 60-74 75+
2003 10
100 1000 10000 100000
1980 1985 1990 1995 2000 2005 2010
Year Men
15-29 30-44 45-59 60-74
0-14
75+
2003 10
100 1000 10000 100000
1980 1985 1990 1995 2000 2005 2010
Year Women
The upper two panels of Figure 3 display trends in circulatory diseases and in external and alcohol-related causes. This latter group of causes underwent the largest relative changes. The lower left-hand panel shows mortality trends from various cancers. These are remarkable in that they appear to have had their own dynamic, which was largely independent of the fluctuations seen for most other causes. Most notably, there was no indication of a rise in rates following the collapse of the Soviet Union in the 1990s. The causes of death in the lower-right panel were selected because they are generally regarded as being especially sensitive to medical interventions; thus, fluctuations in the rates at which people die from these causes may reflect changes in the health care system (Nolte and McKee 2004). This is an area in which the USSR increasingly lagged behind Western Europe from the 1960s onwards (Andreev et al. 2003).
It is evident from Figure 3 that the trends for a number of causes of death have been steady, moving either up or down for two decades or more. These include all of the cancers shown. Because of the stability of these trends, none of them is useful in explaining why mortality as a whole declined from 2004 onwards. However, after around 2002-3, all of the other causes of death shown in Figure 3 had either stopped increasing, had plateaued, or had started to decrease. Most notably, mortality from tuberculosis, which had increased consistently since 1990, started to decline in 2006.
Figure 3: Trends in age-standardized death rates by selected causes of death in Russia for both sexes since 1970. Per 100,000 person-years
1 10 100 1000
1970 1975 1980 1985 1990 1995 2000 2005 2010
IHD Cerebrovascular Other circulatory
1 10 100 1000
1970 1975 1980 1985 1990 1995 2000 2005 2010 Year
Cancer trachea, broncus, lung Cancers of the upper aerodigestive tract Cancer of the stomach
Cancer intestine, rectum, anus Cancer of the breast Leukemia
1 10 100 1000
1970 1975 1980 1985 1990 1995 2000 2005 2010 Year
TB Diabetes mellitus 1
10 100 1000
1970 1975 1980 1985 1990 1995 2000 2005 2010
Transport accidents Alcohol poisoning Liver cirrhosis Homicide and unspec. violence Suicide
Note 1: In logarithmic scale.
3.4 Age- and cause-specific contributions to the increase in life expectancy
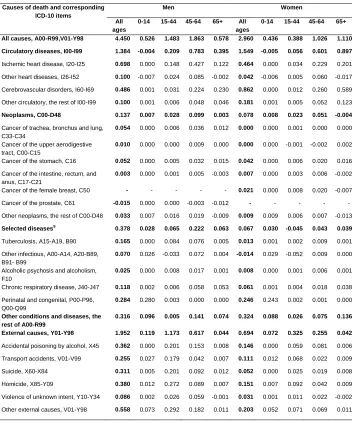
Table 1 shows how these variations in age- and cause-specific-mortality contributed to the increase in Russian life expectancy between 2003 and 2010. An additional table presenting changes in age-standardized death rates between 2003 and 2010 for the same causes of death is in the appendix (Table A-2).
Over this period, male life expectancy at birth increased from 58.50 to 62.95 years, while female life expectancy increased from 71.83 to 74.79 years. Consistent with the trends noted above, reduced mortality at all age groups contributed to the improvements in life expectancy among both males and females. While lower mortality among children ages zero to 14 had a considerable impact on life expectancy, reduced mortality among adults had an even greater effect. Fewer deaths at working ages (45-64 years) had the most significant impact on increased life expectancy among men. Meanwhile, among women, lower mortality at ages 65 and above contributed the most to improvements in life expectancy, although the effect of fewer deaths at ages 45-64 was almost as large.
Table 1: Decomposition of the life expectancy difference between 2010 and 2003 by ages and selected causes of death for men and women. In years
Causes of death and corresponding ICD-10 items
Men Women
All ages
0-14 15-44 45-64 65+ All ages
0-14 15-44 45-64 65+
All causes, A00-R99,V01-Y98 4.450 0.526 1.483 1.863 0.578 2.960 0.436 0.388 1.026 1.110
Circulatory diseases, I00-I99 1.384 -0.004 0.209 0.783 0.395 1.549 -0.005 0.056 0.601 0.897
Ischemic heart disease, I20-I25 0.698 0.000 0.148 0.427 0.122 0.464 0.000 0.034 0.229 0.201 Other heart diseases, I26-I52 0.100 -0.007 0.024 0.085 -0.002 0.042 -0.006 0.005 0.060 -0.017 Cerebrovascular disorders, I60-I69 0.486 0.001 0.031 0.224 0.230 0.862 0.000 0.012 0.260 0.589 Other circulatory, the rest of I00-I99 0.100 0.001 0.006 0.048 0.046 0.181 0.001 0.005 0.052 0.123
Neoplasms, C00-D48 0.137 0.007 0.028 0.099 0.003 0.078 0.008 0.023 0.051 -0.004
Cancer of trachea, bronchus and lung, C33-C34
0.054 0.000 0.006 0.036 0.012 0.000 0.000 0.001 0.000 0.000
Cancer of the upper aerodigestive tract, C00-C15
0.010 0.000 0.000 0.009 0.000 0.000 0.000 -0.001 -0.002 0.002
Cancer of the stomach, C16 0.052 0.000 0.005 0.032 0.015 0.042 0.000 0.006 0.020 0.016 Cancer of the intestine, rectum, and
anus, C17-C21
0.003 0.000 0.001 0.005 -0.003 0.007 0.000 0.003 0.006 -0.002
Cancer of the female breast, C50 - - - - - 0.021 0.000 0.008 0.020 -0.007 Cancer of the prostate, C61 -0.015 0.000 0.000 -0.003 -0.012 - - - - - Other neoplasms, the rest of C00-D48 0.033 0.007 0.016 0.019 -0.009 0.009 0.009 0.006 0.007 -0.013
Selected diseases$ 0.378 0.028 0.065 0.222 0.063 0.067 0.030 -0.045 0.043 0.039
Tuberculosis, A15-A19, B90 0.165 0.000 0.084 0.076 0.005 0.013 0.001 0.002 0.009 0.001 Other infectious, A00-A14, A20-B89,
B91- B99
0.070 0.026 -0.033 0.072 0.004 -0.014 0.029 -0.052 0.009 0.000
Alcoholic psychosis and alcoholism, F10
0.025 0.000 0.008 0.017 0.001 0.008 0.000 0.001 0.006 0.001
Chronic respiratory disease, J40-J47 0.118 0.002 0.006 0.058 0.053 0.061 0.001 0.004 0.018 0.038 Perinatal and congenital, P00-P96,
Q00-Q99
0.284 0.280 0.003 0.000 0.000 0.246 0.243 0.002 0.001 0.000
Other conditions and diseases, the rest of A00-R99
0.316 0.096 0.005 0.141 0.074 0.324 0.088 0.026 0.075 0.136
External causes, Y01-Y98 1.952 0.119 1.173 0.617 0.044 0.694 0.072 0.325 0.255 0.042
Accidental poisoning by alcohol, X45 0.362 0.000 0.201 0.153 0.008 0.146 0.000 0.059 0.081 0.006 Transport accidents, V01-V99 0.255 0.027 0.179 0.042 0.007 0.111 0.012 0.068 0.022 0.009 Suicide, X60-X84 0.311 0.005 0.201 0.092 0.012 0.052 0.000 0.025 0.019 0.008 Homicide, X85-Y09 0.380 0.012 0.272 0.089 0.007 0.151 0.007 0.092 0.042 0.009 Violence of unknown intent, Y10-Y34 0.086 0.002 0.026 0.059 -0.001 0.031 0.001 0.011 0.022 -0.002 Other external causes, V01-Y98 0.558 0.073 0.292 0.182 0.011 0.203 0.052 0.071 0.069 0.011
3.5 Russia compared with the UK
While substantial progress has been made in recent years, mortality in Russia remains very high compared to mortality in other European countries. With a combined life expectancy of 68.9 years, Russia ranked 49th out of 50 countries in Europe in 2010, just ahead of Kazakhstan (World Health Organization Regional Office for Europe 2012). However, in order to understand Russian mortality in an international context, it is helpful to compare it with the mortality of a specific country, rather than of a regional grouping. The country we have chosen for this comparison is the UK. Relative to the rest of Europe, the UK ranks in the middle, with a life expectancy in 2009 of 78.1 years for males and 82.3 years for females.
Overall, the age-standardized total mortality among men is about 2.5 times greater in Russia than it is in the UK, and it is twice as high among women. In fact, at every age mortality in Russia is greater than in the UK, although the size of the gap varies substantially across the age spectrum: in infancy and childhood (0-14 years) mortality is twice as high, at ages 15-44 years it is four times higher, at ages 45-64 it is three times higher, and at ages 65+ years it is 1.4 times higher.
Table 2: Comparison of age-standardized mortality rates (per 100,000) in Russia (2010) and the United Kingdom (2009) by cause and sex
Males Females
Russia UK Diff Ratio Russia UK Diff Ratio
All causes, A00-R99,V01-Y98 1763.1 670.7 1092.4 2.6 867.1 472.6 394.4 1.8
Circulatory diseases, I00-I99 918.6 210.9 707.7 4.4 522.2 133.7 388.6 3.9
Ischemic heart disease, I20-I25 503.2 115.6 387.6 4.4 257.5 52.2 205.2 4.9 Other heart diseases, I26-I52 97.6 26.9 70.8 3.6 42.6 22.1 20.5 1.9 Cerebrovascular disorders, I60-I69 261.5 44.1 217.4 5.9 186.4 41.7 144.7 4.5 Other circulatory, the rest of I00-I99 56.1 24.3 31.9 2.3 36.1 17.6 18.5 2.1
Neoplasms, C00-D48 265.1 209.7 55.3 1.3 133.0 151.3 -18.3 0.9
Cancer of trachea, bronchus and lung, C33-C34 71.6 49.7 21.9 1.4 8.3 31.3 -23.0 0.3 Cancer of the upper aerodigestive tract, C00-C15 20.4 17.4 3.1 1.2 2.9 6.3 -3.3 0.5 Cancer of the stomach, C16 33.1 7.8 25.3 4.3 13.7 3.3 10.4 4.1 Cancer of the intestine, rectum, and anus, C17-C21 30.7 22.0 8.7 1.4 19.8 13.8 6.0 1.4 Cancer of the female breast, C50 - - - - 23.8 25.4 -1.6 0.9 Cancer of the prostate, C61 18.7 23.8 -5.1 0.8 - - - - Other neoplasms, the rest of C00-D48 90.5 89.0 1.5 1.0 64.5 71.3 -6.8 0.9
Selected diseases$
81.3 44.3 37.1 1.8 19.7 31.0 -11.2 0.6
Tuberculosis, A15-A19, B90 25.1 0.6 24.5 41.9 5.2 0.3 4.9 16.8 Other infectious, A00-A14, A20-B89, B91- B99 10.8 7.1 3.7 1.5 5.0 6.0 -1.0 0.8 Alcoholic psychosis and alcoholism, F10 5.5 1.8 3.7 3.1 1.5 0.7 0.8 2.1 Chronic respiratory disease, J40-J47 40.0 34.8 5.2 1.1 8.0 24.0 -16.0 0.3 Perinatal and congenital, P00-P96, Q00-Q99 11.2 8.3 2.9 1.3 9.0 7.0 2.0 1.3 Other conditions and diseases, the rest of A00-R99 246.2 158.2 88.0 1.6 125.3 133.7 -8.4 0.9
External causes, Y01-Y98 240.8 39.3 201.4 6.1 57.9 16.0 41.8 3.6
Accidental poisoning by alcohol, X45 21.2 0.6 20.6 35.4 5.4 0.3 5.1 21.0 Transport accidents, V01-V99 29.3 6.4 22.9 4.6 9.2 1.7 7.6 5.6 Suicide, X60-X84 39.4 10.5 28.9 3.7 6.6 2.8 3.8 2.4 Homicide, X85-Y09 19.9 0.4 19.5 47.5 5.7 0.2 5.5 29.9 Violence of unknown intent, Y10-Y34 44.6 3.2 41.4 14.0 10.1 1.3 8.7 7.6 Other external causes, V01-Y98 86.5 18.2 68.3 4.8 21.0 9.8 11.2 2.1
4. Discussion
This is the first study to examine systematically the increase in life expectancy in Russia that has occurred since 2004. The relatively long and continuous upward trend in life expectancy appears to have broken the pattern observed since the mid-1980s, in which relatively brief periods of improvement were followed by longer periods of deterioration. Recently published data show that life expectancy levels for both men and women have increased by a further 0.8-0.9 years in 2011, reaching 64 years for men and 75.6 years for women (Rosstat 2013).
Our analyses have shown that the recent improvements in life expectancy in Russia have mainly been driven by reductions in mortality from circulatory diseases and external causes. However, the marked improvements in these cause-of-death categories have been reinforced by positive trends in several other causes, most notably in tuberculosis, which increased between the collapse of the Soviet Union to the mid-2000s.
4.1 Limitations
Before considering possible substantive explanations for these trends, we should note the limitations of our analyses. The main limitation is that the measurements and decompositions presented in this study relate to population-level effects, which cannot be used to establish causal relationships that apply at the level of individuals. These effects do, however, provide the necessary basis for formulating plausible hypotheses regarding the underlying causes of the improvements in life expectancy, and thus allow us to identify promising directions for future research based on more detailed data, which would enable us to better evaluate causal effects.
death was not known (Shkolnikov et al. 1999). More recently, a number of additional problems have arisen, such as an increase in the number of deaths at unknown ages and from unspecified causes (Shkolnikov, Meslé, and Vallin 1996; Andreev et al. 2008; Gavrilova 2008), and in the number of violent deaths of undetermined intent (Pridemore 2003). For example, rates of homicide and suicide may have been affected by the misclassification of deaths from these two causes as unspecified violent deaths. While all of these problems are relatively minor and cannot affect the estimates of life expectancy and mortality rates by broad groups of causes (Leon et al. 1997; Wassermann and Varnik 1998; Andreev, Scherbov, Willekens 1995), caution is advised when considering more specific and smaller cause-of-death categories, such as diabetes or liver cirrhosis, as there may have been some variation in registration practices.
4.2 Cause-specific trends and international differences
There are several important and unique features of recent trends which distinguish them from previous cyclical fluctuations. In 2010, female life expectancy reached an all-time high for Russia. This is attributable in large part to the marked decline in cerebrovascular disease mortality among women, particularly at older ages: among women ages 60 and above (and among men ages 75 and above), all-cause mortality reached a historically low level for Russia, even as the cerebrovascular disease mortality rate fell to its lowest point in four decades. This recent downward trend in cerebrovascular disease mortality brings the level in Russia closer to the levels observed in high-income European countries, where there have seen long-term declines in deaths from this cause (Feigin et al. 2009). Deaths from several other causes in 2010 had also decreased to the lowest levels seen in Russia since 1980, including suicide and stomach cancer. As the rate of stomach cancer had been declining for a very long time, most likely as a result of improvements in conditions during childhood (Leon 2001), this cause is not implicated in the cyclical fluctuations we have observed.
1987, for most causes), life expectancy in 2010 would have been 69.7 years for men and 78.2 years for women (increases of 6.7 and 3.5 years, respectively). These figures suggest possible benchmarks that are realistically achievable in the short term. It is important to recognize, however, that, although this potential improvement is very substantial, it still would not close the current gap between Russia and the countries with the lowest mortality levels.
One striking observation from our analyses is that the causes of death which have fluctuated the most over time in Russia, and have tended to contribute most to the recent improvements in life expectancy, are generally the causes for which the biggest relative and sometimes absolute differences relative to the UK have been observed. At the other end of the spectrum, the death rates from cancer in Russia were found to have been immune to cyclical mortality fluctuations, to have contributed little to the overall improvement in life expectancy, and to have been more similar to the rates in the UK than for any other cause. Moreover, mortality was shown to have been lower in Russia than in the UK for some cancer sites (e.g., for female lung and breast cancers). However, circulatory disease mortality in Russia was found to have undergone moderate fluctuations over time, to have made a major contribution to recent improvements in life expectancy, and to have been much higher than in the UK. This strongly suggests that the best strategy for bringing life expectancy in Russia closer to European levels lies in tackling mortality from circulatory diseases and external causes.
4.3 Alcohol
The most dynamic element of mortality is driven by changeable contemporary conditions. Since the late 1980s, Russian mortality has undergone sharp fluctuations, especially at working ages. Many of these fluctuations have been related to the harmful effects of alcohol consumption (Shkolnikov et al. 2004; Shkolnikov, Andreev, and Jdanov 2008).
introduction of new federal controls on ethanol production and sales in 2006 (Khalturina and Korotaev 2008; Levintova 2007).
In the group of alcohol-related causes, there currently appears to be a disconnect between liver cirrhosis and other causes. Before 2004, mortality rates from liver cirrhosis and alcohol poisoning had always fluctuated in parallel. However, the substantial decline in acute alcohol poisoning in 2004-2010 was, unusually, accompanied by a persistently high rate of mortality from liver cirrhosis. While we cannot exclude some change in coding practices, this may indicate a reduction in the frequency of the kind of extreme drinking behavior associated with alcohol poisoning, even as the overall level of alcohol consumption remains high, which may be expected to result in chronic damage affecting not only the liver, but also the pancreas, heart, and other organs (Leon et al. 2010).
So far, alcohol control policies in Russia have been characterized by episodic ―campaigns,‖ each of which has had some short-term success. The most effective campaign was the one instituted by Gorbachev in 1985. But that initiative, like some earlier small-scale efforts, was based on short-lived, top-down strategies of coercion and control that failed to tackle the underlying causes of hazardous drinking or popular attitudes toward it. The measures implemented in 2006 were broader structural efforts that focused on controlling and limiting supply. Crucially, they required all companies that manufactured ethanol for any purpose to pay a large registration fee to do so. This led to the closure of many smaller companies unable to pay the fee. Those companies that were authorized were then covered by a new monitoring scheme: the United State Automated Information System (USIS). This system allowed for the computerized tracking of ethanol production on the premises where it was actually manufactured. Alongside these measures, industrial ethanol production became subject to excise tax, and a new list of denaturating substances was introduced that made a much larger proportion of non-beverage ethanol unpalatable to drink (Levintova 2007). The introduction of USIS and the excise taxation on all ethanols were particularly important, as they made it much less likely that ―hidden‖ ethanol would be diverted into the production of very cheap vodkas and non-beverage alcohols. This measure was of crucial importance given the compelling evidence that the consumption of ethanol from medical tinctures, eau-de-colognes, after-shaves, and industrial solvents has been a major factor in the high death rates at working ages in Russia (Leon et al. 2007). The net effect of these measures was a reduction in the total production of ethanol in Russia for the first time since 1998.
enforcement. On the other hand, data from the Russian Longitudinal Monitoring Survey (RLMS) (Higher School of Economics 2012) suggest that there have been some favorable changes in drinking patterns that could mark the beginning of a sustained shift. A comparison of Round 9 (2000) and Round 17 (2008) of the RLMS shows that the share of beer in overall consumption of pure ethanol has increased, and the share of vodka has decreased. Among respondents aged 15 to 54, these shares in 2000 were 14.2% and 56.1% (n=2127), respectively; while the shares in 2008 were 31.6% and 50.9% (n=2593), respectively. The greatest change has taken place among the young. For example, among respondents aged 20 to 29, the share of beer in overall consumption increased from 23.2% (n=626) in 2000 to 51.8% (n=622) in 2008.
4.4 Smoking
circulatory disease mortality at older ages fell to historically low levels. It is notable that, in this recent period, both the absolute and relative declines were greater for cerebrovascular mortality than for mortality from ischemic heart disease. As with alcohol-related causes, this represented a break with the past, as the fluctuations in mortality from ischemic heart disease had always been much larger than the fluctuations in cerebrovascular mortality. This may be attributable to improved blood pressure control. The management of hypertension has long been poor in Russia, not only because it is under-diagnosed and undertreated, but also because there has been a failure to recognize the need for continuous treatment, rather than for only treating people when they are feeling unwell. Although longitudinal survey data on hypertension management in Russia are scarce, some data are available. Two surveys that posed the same questions in 2001 and 2010 found a slight decrease in the daily use of medication among respondents with a hypertension diagnosis (Roberts et al. 2010; 2012).
Data collected in the framework of the Federal Target Program ―Prevention and Treatment of Arterial Hypertension in the Russian Federation‖ (PTAH, initiated in 2002) (Federal Agency for Health and Social Development 2012) compared blood pressure control in 2003-2004 and in 2009-2010. During that time there was an increase in control of hypertension among women, from 13.7% (n=8233) to 19.3% (n=3363); but not among men (10.8%, n=4862 vs. 10.9%, n=1754) (Oganov et al. 2011). Of perhaps greater importance, however, was the significant decrease in the prevalence of highly elevated blood pressure (SBP>170 mmHg or DBP>110 mmHg), from 19% to 10.1% among men and from 22.4% to 10.7% among women (Shalnova 2012). Unfortunately, in the cited studies the sampling procedures and characteristics of the samples were not described in detail, and thus it is difficult to assess the validity of the findings.
began in 2006, approximately coincides with the implementation of the related health program.
The improvement in mortality from treatable cardiovascular causes seen at older ages is echoed in reductions in mortality from some other causes that contributed much less to the overall increase in life expectancy, but which might also be indicative of improvements in health care, and especially of the prevention of premature deaths from causes amenable to health care, such as tuberculosis and diabetes. While deaths from tuberculosis started to decrease in the mid-2000s, a reduction in deaths from diabetes began in the mid-1990s.
Mortality from a number of cancers has also declined. Most of these improvements started gradually in the 1990s. For the most common cancers, such as lung and stomach cancers, these changes were mainly determined by the incidence of these malignancies, and had little to do with medical practices (Shkolnikov et al. 1999; Leon 2001; Zaridze et al. 2002; Zaridze 2012; Davidov and Axel 2011). At the same time, mortality from some less common but more treatable cancers, such as leukemia, has decreased, despite an increase in the incidence of these cancers (Davidov and Axel 2011); again, this is consistent with improvements in medical care.
Although mortality among children under age 15 had been decreasing for decades, this trend accelerated after 2000. The increase has been especially steep for early neonatal mortality, and is therefore mainly attributable to the greater use of advanced technology in perinatal care (Kvasha and Kharkova 2011).
heart disease performed (Minzdravsotsrazvitiya 2012). These interventions might have contributed to the reduction in mortality from ischemic heart disease, and from some other pathologies.
However, despite these initiatives, the health service in Russia is still insufficient to respond adequately to the current health challenges, and many Russians in need of care are not yet receiving it (Balabanova et al. 2012). Thus, recent news that the Russian government intends to substantially reduce health care expenditures in the federal budgets for 2013-2015 is particularly worrying (Ministerstvo finansov Rossii 2012).
5. Conclusion
This study represents the first attempt to examine systematically the recent increases in Russian life expectancy. The improvements in the 2000s were mostly driven by decreases in mortality from cardiovascular diseases and external causes among adults. Our finding that the recent reduction in mortality at older ages from circulatory (and especially cerebrovascular) diseases has been greater than the earlier decreases in 1995-1998 and 1985-1987 is important. To some extent, this development is similar to changes that have taken place in the Czech Republic, Poland, and other Central European countries over the past two decades; as well as to shifts that occurred in the UK and other high-income countries in the 1970s (Meslé 2004; Rychtařiková 2004). Does this mean that Russia is entering a new stage of health transition, known also as ―cardiovascular revolution‖ (Vallin and Meslé 2004)? It is not yet possible to determine whether we are witnessing the beginning of a sustained trend that will allow Russians to join the citizens of other developed countries as they progress toward having longer and healthier lives (Christensen et al. 2009). Further monitoring of mortality trends in Russia and detailed comparisons with earlier developments in other countries remain a priority for future research if we are to understand the ongoing changes in Russia.
The measures to improve health through primary and secondary prevention of disease that have already been taken should be continued and reinforced. The profile of excess mortality in Russia relative to Western Europe suggests that the priorities in Russia should be discouraging alcohol consumption and tobacco use, and the provision of more effective and universally available health care.
6. Acknowledgements
References
Andreev, E., Scherbov, S., and Willekens, F. (1995). Sources of information on the population of Russia. Groningen: University of Groningen Press.
Andreev, E., Pridemore, W.A., Shkolnikov, V.M., and Antonova, O.I. (2008). An investigation of the growing number of deaths of unidentified people in Russia.
European Journal of Public Health 18(3): 252–257. doi:10.1093/eurpub/ ckm124.
Andreev, E.M. (1982). Metod komponent v analize prodoljitelnosty zjizni. [The method of components in the analysis of length of life]. Vestnik Statistiki 9: 42–47. Andreev, E.M. (1995). Mladencheskaya smertnost‘ v Rossii [Infant mortality in
Russia]. Voprosi Statistiki [Statistical Issues] 5: 66–71.
Andreev, E.M., Nolte, E., Shkolnikov, V.M., Varavikova, E., and McKee, M. (2003). The evolving pattern of avoidable mortality in Russia. International Journal of Epidemiology 32(3): 437–446. doi:10.1093/ije/dyg085.
Andreev, E.M., Shkolnikov, V.M., and Begun, A.Z. (2002). Algorithm for decomposition of differences between aggregate demographic measures and its application to life expectancies, healthy life expectancies, parity-progression ratios and total fertility rates. Demographic Research 7(14): 499–522.
doi:10.4054/DemRes.2002.7.14.
Balabanova, D., Roberts, B., Richardson, E., Haerpfer, C., and McKee, M. (2012). Health care reform in the former soviet union: Beyond the transition. Health Services Research 47(2): 840–864. doi:10.1111/j.1475-6773.2011.01323.x.
Benjamin, B. and Pollard, J.H. (1980). The analysis of mortality and other actuarial statistics. London: Heineman.
Capewell, S. and O'Flaherty, M. (2011). Rapid mortality falls after risk-factor changes in populations. The Lancet 378(9793): 752–753. doi:10.1016/S0140-6736(10)62302-1.
Chenet, L., McKee, M., Fulop, N., Bojan, F., Brand, H., Hort, A., and Kalbarczyk, P. (1996). Changing life expectancy in central Europe: Is there a single reason?
Chenet, L., McKee, M., Leon, D., Shkolnikov, V., and Vassin, S. (1998). Alcohol and cardiovascular mortality in Moscow; new evidence of a causal association.
Journal of Epidemiology and Community Health 52(12): 772–774.
doi:10.1136/jech.52.12.772.
Christensen, K., Doblhammer, G., Rau, R., and Vaupel, J.W. (2009). Ageing populations: The challenges ahead. The Lancet 374(9696): 1196–1208.
doi:10.1016/S0140-6736(09)61460-4.
Davidov, M. and Axel, E.M. (2011). Zabolevaemost‗ zlokachestvennimi novoobrazovaniyami [Morbidity by malignant neoplasms]. Bulletin of Research Institute, RAMS 22(3 (Appendix 1)): 54–92.
Federal Agency for Health and Social Development (2012). The Federal Target Program "Preventive maintenance and treatment of arterial hypertension in the Russian Federation". Moscow: Government of the Russian Federation.
http://fcp.economy.gov.ru/cgi-bin/cis/fcp.cgi/Fcp/ViewFcp/View/2006/80. Feigin, V.L., Lawes, C.M., Bennett, D.A., Barker-Collo, S.L., and Parag, V. (2009).
Worldwide stroke incidence and early case fatality reported in 56 population-based studies: A systematic review. The Lancet Neurology 8(4): 355–369.
doi:10.1016/S1474-4422(09)70025-0.
Gavrilova, N.S., Semyonova, V.G., Dubrovina, E., Evdokushkina, G.N., Ivanova, A.E., and Gavrilov, L.A. (2008). Russian mortality crisis and the quality of vital statistics. Population Research and Policy Review 27(5): 551–574.
doi:10.1007/s11113-008-9085-6.
Gil, A., Polikina, O., Koroleva, N., McKee, M., Tomkins, S., and Leon, D.A. (2009). Availability and characteristics of nonbeverage alcohols sold in 17 Russian cities in 2007. Alcoholism: Clinical and Experimental Research 33(1): 79–85.
doi:10.1111/j.1530-0277.2008.00813.x.
Khalturina, D.A. and Korotaev, A.V. (2008) Vvedeniye. Alkogolnaya katasrofa: kak ostanovit vimiraniye Rossii. [Introduction. How to stop dying of Russia]. In: Khalturina, D.A. and Korotayev, A.V. (eds.). Alkogolnaya katastrofa Vozmozhnosti gosudarstevennoy politiki v preodolenii alkogolnoy smertnosti v Rossii [Alcohol catastrophe and options for state policy for surmounting the alcohol mortality in Russia]. Moscow: Lenand: 5–58.
Kvasha, E.A. and Kharkova, T.L. (2011) Smertnost‘ mladentsev v Rossii: Uspekhi i nereshennye problemy. [Infant mortality in Russia: Successes and unresolved issues]. Demoscope Weekly 461-462: 1–17.
Leon, D.A. (2001). Common threads: Underlying components of inequalities in mortality between and within countries. In: Leon, D.A. and Walt, G. (eds.).
Poverty, Inequality, and Health. Oxford: Oxford University Press: 58–87. Leon, D.A., Chenet, L., Shkolnikov, V.M., Zakharov, S., Shapiro, J., Rakhmanova, G.,
Vassin, S., and McKee, M. (1997). Huge variation in Russian mortality rates 1984-94: Artefact, alcohol, or what? The Lancet 350(9075): 383–388.
doi:10.1016/S0140-6736(97)03360-6.
Leon, D.A., Saburova, L., Tomkins, S., Andreev, E., Kiryanov, N., McKee, M., and Shkolnikov, V.M. (2007). Hazardous alcohol drinking and premature mortality in Russia: A population based case-control study. The Lancet 369(9578): 2001– 2009. doi:10.1016/S0140-6736(07)60941-6.
Leon, D.A., Shkolnikov, V.M., and McKee, M. (2009). Alcohol and Russian mortality: A continuing crisis. Addiction 104(10): 1630–1636. doi:10.1111/j.1360-0443.2009.02655.x.
Leon, D.A., Shkolnikov, V.M., McKee, M., Kiryanov, N., and Andreev, E. (2010). Alcohol increases circulatory disease mortality in Russia: Acute and chronic effects or misattribution of cause? International Journal of Epidemiology 39(5): 1279–1290. doi:10.1093/ije/dyq102.
Levintova, M. (2007). Russian alcohol policy in the making. Alcohol and Alcoholism
42(5): 500–505. doi:10.1093/alcalc/agm040.
Lightwood, J.M. and Glantz, S.A. (1997 ). Short-term economic and health benefits of smoking cessation: Myocardial infarction and stroke. Circulation 96(4): 1089– 1096. doi:10.1161/01.CIR.96.4.1089.
McMichael, A.J., McKee, M., Shkolnikov, V., and Valkonen T. (2004). Mortality trends and setbacks: Global convergence or divergence? The Lancet 363(9415): 1155–1159. doi:10.1016/S0140-6736(04)15902-3.
Meslé, F. (2004). Mortality in Central and Eastern Europe: Long-term trends and recent upturns. Demographic Research, Special Collection 2(3): 45–70.
doi:10.4054/DemRes.2004.S2.3.
Meslé, F., Shkolnikov, V.M., Hertrich, V., and Vallin, J. (1996). Tendences recentes de la mortalite par cause en Russie 1965–1994. Serie: Donées Statistiques 2. Paris: INED.
Ministerstvo finansov Rossii (2012). Osnovniye napravleniya budzhetnoi politiki na 2013 god i na planoviy period 2014 i 2015 godov. Materialy k zasedaniyu Pravitelstva Rossiyskoy Federatsii 6 iyulya 2012 goda. [Principal dimensions of the budget policies for 2013 and for the planning period 2014 and 2015. Materials for the Session of the Government of the Russian Federation on the 6th of July 2012][electronic resource]. http://www.consultant.ru/law/hotdocs/ 20071.html.
Minzdravsotsrazvitiya Rossii (2012). Meditsina visokikh technologiy stala dostupnee. [High-tech medicine has become more affordable]. Form number 14. "Information on the activities of the hospital," 2006-2011. Moscow: Ministry of Health and Social Development.
Minzdrav Rossii (2012). Proekt prikaza Minzdrava Rossii ot 22 oktyabrya 2012 g. Ob utverzhdenii perechnya vidov vysokotechnologichnoi pomoschi. [Project of the decree of the Ministry of Health of Russia of the 22nd of October 2012. On the approval of the list of high-tech medical services]. http://rosminzdrav.ru/ docs/mzsr/projects/1784.
Nolte, E. and McKee, M. (2004). Does health care save lives? Avoidable mortality revisited. London: The Nuffield Trust.
Popovich, L., Potapchik, E., Shishkin, S., Richardson, E., Vacroux, A., and Mathivet, B. (2011). Russian Federation health system review. Health Systems in Transition 13(7): 1–190.
Pridemore, W.A. (2003). Measuring homicide in Russia: A comparison of estimates from the crime and vital statistics reporting systems. Social Science & Medicine
57(8): 1343–1354. doi:10.1016/S0277-9536(02)00509-9.
Pridemore, W.A. and Chamlin, M.B. (2006). A time series analysis of the effects of heavy drinking on homicide and suicide rates in Russia, 1956-2002. Addiction
101(12): 1719–1729. doi:10.1111/j.1360-0443.2006.01631.x.
Revich, B.A. and Shaposhnikov, D.A. (2012). Climate change, heat waves, and cold spells as risk factors for increased mortality in some regions of Russia. Studies on Russian Economic Development 23(2): 195–207. doi:10.1134/S10757007 12020116.
Roberts, B., Stickley, A., Balabanova, D., Haerpfer, C., and McKee, M. (2012). The persistence of irregular treatment of hypertension in the former Soviet Union.
Journal of Epidemiology and Community Health 66(11): 1078–1082.
doi:10.1136/jech-2011-200645.
Roberts, B., Stickley, A., Balabanova, D., and McKee, M. (2010). Irregular treatment of hypertension in the former Soviet Union. Journal of Epidemiology and Community Health 66(6):482–488. doi:10.1136/jech.2010.111377.
Rosstat (2013). The Russian Federal Service for Statistics. Demography.
http://www.gks.ru/wps/wcm/connect/rosstat_main/rosstat/ru/statistics/population /demography/#.
Rychtařiková, J. (2004). The case of the Czech Republic. Determinants of the recent favourable turnover in mortality. Demographic Research, Special Collection
2(5): 105-138. doi:10.4054/DemRes.2004.S2.5.
Shalnova, S.A. (2012). Control of arterial hypertension - a surety of reduction of cardiovascular morbidity and mortality. Presented at the VII All-Russia Congress ―Arterial Hypertension from A.L.Myasnikov to our days‖, Moscow, 5 March 2012.
Shkolnikov, V., McKee, M., and Leon, D.A. (2001). Changes in life expectancy in Russia in the mid-1990s. The Lancet 357(9260): 917–921. doi:10.1016/S0140-6736(00)04212-4.
Shkolnikov, V.M., Andreev, E.M., and Jdanov, D.A. (2008). Smetrnost trudosposobnogo naseleniya, alkogol i prodolzhitelnost zhizni v Rossii. [Mortality of working-age population, alcohol and length of life in Russia. In: Khalturina, D.A. and Korotayev A.V. (eds.). Alkogolnaya katastrofa Vozmozhnosti gosudarstevennoy politiki v preodolenii alkogolnoy smertnosti v Rossii [Alcohol catastrophe and options for state policy for surmounting the alcohol mortality in Russia]. Moscow: Lenand: 85–104.
Shkolnikov, V.M., Andreev, E.M., Leon, D.A., McKee, M., Meslé, F., and Vallin, J. (2004). Mortality reversal in Russia: The story so far. Hygiea Internationalis
4(1): 29–80. doi:10.3384/hygiea.1403-8668.044129.
Shkolnikov, V.M., McKee, M., Vallin, J., Aksel, E., Leon, D., Chenet, L., and Meslé, F. (1999). Cancer mortality in Russia and Ukraine: Validity, competing risks and cohort effects. International Journal of Epidemiology 28(1): 19–29. doi:10.1093/ ije/28.1.19.
Shkolnikov, V.M., Meslé, F., and Vallin, J. (1996). Health crisis in Russia I. Recent trends in life expectancy and causes of death. Population: An English Selection
8: 123–154.
Takala, I.R. (2002). Veselie Rusi: Istorija alkogol'noj problemy v Rossii [A fun of the Rus’: History of the alcohol problem in Russia]. Sankt-Peterburg: Zurnal Neva, Nauécnoe izd. ed.
Vallin, J. and Meslé, F. (2004). Convergences and divergences in mortality. A new approach to health transition. Demographic Research, Special collection
“Determinants of Diverging Trends in Mortality” 2(2): 11–44.
doi:10.4054/DemRes.2004.S2.2.
World Health Organisation, Regional Office for Europe (2012). Health for All Database. Copenhagen: World Health Organisation Regional Office for Europe.
http://www.euro.who.int/en/what-we-do/data-and-evidence/databases/european-health-for-all-database-hfa-db2.
Zaridze, D.G. (2012). Onkologicheskaya mifologiya I realnost‘ [Cancer Mythology and Reality]. Независимая газета [Independent Newspaper]. http://www.ng.ru/ health/2012-06-26/8_oncology.html.
Zaridze, D.G., Karpov, R.S., Kiseleva, S., Konobeevskaia, I.N., Men‘ T.X., Shain, A.A., and Shikhman, S.M. (2002). Kureniye – osnovnaya prichina visokoi smertnosti rossiyan [Smoking - the main cause of high mortality of Russians].
Appendix
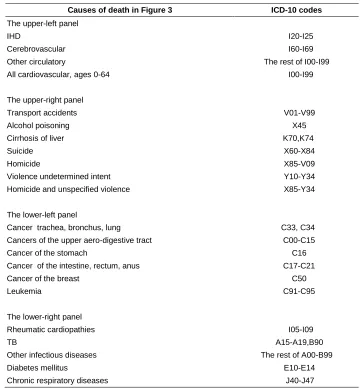
Table A-1: Causes of death in Figures 3, A-3, A-4 and the corresponding ICD-10 items
Causes of death in Figure 3 ICD-10 codes
The upper-left panel
IHD I20-I25
Cerebrovascular I60-I69
Other circulatory The rest of I00-I99
All cardiovascular, ages 0-64 I00-I99
The upper-right panel
Transport accidents V01-V99
Alcohol poisoning X45
Cirrhosis of liver K70,K74
Suicide X60-X84
Homicide X85-V09
Violence undetermined intent Y10-Y34
Homicide and unspecified violence X85-Y34
The lower-left panel
Cancer trachea, bronchus, lung C33, C34
Cancers of the upper aero-digestive tract C00-C15
Cancer of the stomach C16
Cancer of the intestine, rectum, anus C17-C21
Cancer of the breast C50
Leukemia C91-C95
The lower-right panel
Figure A-2: Trends in age-standardized death rates by selected causes of death in Russia for males since 1970. Per 100,000 person-years
1 10 100 1000
1970 1975 1980 1985 1990 1995 2000 2005 2010
IHD Cerebrovascular Other circulatory
1 10 100 1000
1970 1975 1980 1985 1990 1995 2000 2005 2010 Year
Cancer trachea, broncus, lung Cancers of the upper aerodigestive tract Cancer of the stomach
Cancer intestine, rectum, anus Leukemia
1 10 100 1000
1970 1975 1980 1985 1990 1995 2000 2005 2010 Year
TB Diabetes mellitus 1
10 100 1000
1970 1975 1980 1985 1990 1995 2000 2005 2010
Transport accidents Alcohol poisoning Cirrhosis of liver Homicide and unspec. violence Suicide
Note 1: In logarithmic scale.
Figure A-3: Trends in age-standardized death rates by selected causes of death in Russia for females since 1970. Per 100,000 person-years
1 10 100 1000
1970 1975 1980 1985 1990 1995 2000 2005 2010
IHD Cerebrovascular Other circulatory
1 10 100 1000
1970 1975 1980 1985 1990 1995 2000 2005 2010 Year
Cancer trachea, broncus, lung Cancers of the upper aerodigestive tract Cancer of the stomach
Cancer intestine, rectum, anus Cancer of the breast Leukemia
1 10 100 1000
1970 1975 1980 1985 1990 1995 2000 2005 2010 Year
TB Diabetes mellitus 1
10 100 1000
1970 1975 1980 1985 1990 1995 2000 2005 2010
Transport accidents Alcohol poisoning Cirrhosis of liver Homicide and unspec. violence Suicide
Note 1: In logarithmic scale.
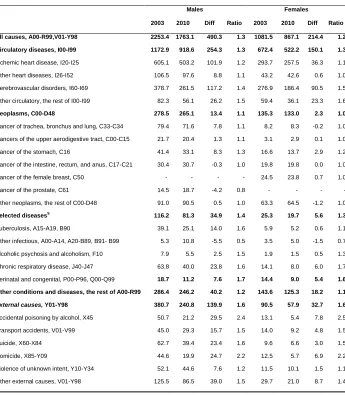
Table A-4: Comparison of age-standardized death rates (per 100,000) between 2003 and 2010 by cause and sex in Russia
Males Females
2003 2010 Diff Ratio 2003 2010 Diff Ratio
All causes, A00-R99,V01-Y98 2253.4 1763.1 490.3 1.3 1081.5 867.1 214.4 1.2
Circulatory diseases, I00-I99 1172.9 918.6 254.3 1.3 672.4 522.2 150.1 1.3
Ischemic heart disease, I20-I25 605.1 503.2 101.9 1.2 293.7 257.5 36.3 1.1 Other heart diseases, I26-I52 106.5 97.6 8.8 1.1 43.2 42.6 0.6 1.0 Cerebrovascular disorders, I60-I69 378.7 261.5 117.2 1.4 276.9 186.4 90.5 1.5 Other circulatory, the rest of I00-I99 82.3 56.1 26.2 1.5 59.4 36.1 23.3 1.6
Neoplasms, C00-D48 278.5 265.1 13.4 1.1 135.3 133.0 2.3 1.0
Cancer of trachea, bronchus and lung, C33-C34 79.4 71.6 7.8 1.1 8.2 8.3 -0.2 1.0 Cancers of the upper aerodigestive tract, C00-C15 21.7 20.4 1.3 1.1 3.1 2.9 0.1 1.0 Cancer of the stomach, C16 41.4 33.1 8.3 1.3 16.6 13.7 2.9 1.2 Cancer of the intestine, rectum, and anus, C17-C21 30.4 30.7 -0.3 1.0 19.8 19.8 0.0 1.0 Cancer of the female breast, C50 - - - - 24.5 23.8 0.7 1.0 Cancer of the prostate, C61 14.5 18.7 -4.2 0.8 - - - - Other neoplasms, the rest of C00-D48 91.0 90.5 0.5 1.0 63.3 64.5 -1.2 1.0
Selected diseases$
116.2 81.3 34.9 1.4 25.3 19.7 5.6 1.3
Tuberculosis, A15-A19, B90 39.1 25.1 14.0 1.6 5.9 5.2 0.6 1.1 Other infectious, A00-A14, A20-B89, B91- B99 5.3 10.8 -5.5 0.5 3.5 5.0 -1.5 0.7 Alcoholic psychosis and alcoholism, F10 7.9 5.5 2.5 1.5 1.9 1.5 0.5 1.3 Chronic respiratory disease, J40-J47 63.8 40.0 23.8 1.6 14.1 8.0 6.0 1.7 Perinatal and congenital, P00-P96, Q00-Q99 18.7 11.2 7.6 1.7 14.4 9.0 5.4 1.6 Other conditions and diseases, the rest of A00-R99 286.4 246.2 40.2 1.2 143.6 125.3 18.2 1.1
External causes, Y01-Y98 380.7 240.8 139.9 1.6 90.5 57.9 32.7 1.6
Accidental poisoning by alcohol, X45 50.7 21.2 29.5 2.4 13.1 5.4 7.8 2.5 Transport accidents, V01-V99 45.0 29.3 15.7 1.5 14.0 9.2 4.8 1.5 Suicide, X60-X84 62.7 39.4 23.4 1.6 9.6 6.6 3.0 1.5 Homicide, X85-Y09 44.6 19.9 24.7 2.2 12.5 5.7 6.9 2.2 Violence of unknown intent, Y10-Y34 52.1 44.6 7.6 1.2 11.5 10.1 1.5 1.1 Other external causes, V01-Y98 125.5 86.5 39.0 1.5 29.7 21.0 8.7 1.4
Note: $