in the population sciences published by the Max Planck Institute for Demographic Research Konrad-Zuse Str. 1, D-18057 Rostock · GERMANY www.demographic-research.org
DEMOGRAPHIC RESEARCH
VOLUME 15, ARTICLE 6, PAGES 147-180
PUBLISHED 22 SEPTEMBER 2006
http://www.demographic-research.org/Volumes/Vol15/6/ DOI: 10.4054/DemRes.2006.15.6
Research Article
First birth trends in developed countries:
Persisting parenthood postponement
Tomas Frejka
Jean-Paul Sardon
1.1 Introduction 148
1.2 Background 148
1.3 The data 149
1.4 Findings of the overall project to date 150
2 First birth levels and trends 150
3 Advancement and postponement of first births 154 3.1 The cohort mean age at first birth 155 3.2 The age structure of first births 157
3.3 Fertility of older women 157
3.4 A crude international comparison of first birth fertility of young women
159
4 The age patterns of first births 162
5 Findings and conclusions 175
6 Acknowledgements 177
First birth trends in developed countries:
Persisting parenthood postponement
Tomas Frejka 1 Jean-Paul Sardon 2
Abstract:
Levels and trends of various facets concerning first births are continuously changing. The evidence confirms that the postponement of first births is an ongoing and persisting process which started in western countries among cohorts of the 1940s, but only in the 1960s cohorts in Central and Eastern Europe. The mean age of women having first births is universally rising. Fertility of older women was increasing. The decline in childbearing of young women is robust among the cohorts of the late 1960s and the 1970s; in Southern Europe as well as in central and Eastern Europe the rates of decline have accelerated. Childbearing behavior in the formerly socialist countries is in transition to a different regime.
1
Independent consultant; E-mail: [email protected]
1. Introductory sections
1.1 Introduction
The present paper is intended to analyze in detail one crucial element of contemporary childbearing trends: the levels and trends of first births in developed countries. It is part of a larger project which has been analyzing childbearing trends and prospects in advanced countries using the cohort method. The project has been in progress during the past six years (Frejka, Sardon 2004 and 2005).
1.2 Background
Up until the end of the 20th century almost all fertility research as well as policy
discussions and decisions were based on period indicators, crude birth rates, total fertility rates and net reproduction rates. There were exceptions represented mainly by Hajnal (1947), Henry (1953), Ryder (1951, 1986), Whelpton (1954) who developed the cohort approach to fertility research. Ryder (1964) also elaborated the technique of “demographic translation,” namely the interrelationships of period and cohort fertility measures. For all intents and purposes this approach was considered important and interesting in academia, but hardly had any impact in the “real” world.
It was Hajnal (1947) who demonstrated theoretically and empirically the apparent dilemma of period rates increasing (or declining) considerably at the same time as cohort rates remained stable. The principal contribution was to reveal that changes in the timing of cohort childbearing may, and do, bring about wide fluctuations of period fertility rates. He also introduced the concepts of “postponement,” “anticipation” and “making up” of childbearing and clarified their effects on period fertility rates, namely he demonstrated why “family size” can and often does remain relatively stable yet period rates may, and at times do, “fluctuate widely.”
cross-sectional period approach as the point of departure, as the base for a better understanding of contemporary fertility.
Calot and Frejka designed a project to complement this work using the cohort analysis approach. The first paper “The cohort fertility story: industrialized countries in
the second half of the 20th and in the early 21st century” was presented at the 2000 PAA
Annual Meeting in Los Angeles. An abbreviated version was published in the
Population and Development Review (Frejka, Calot 2001). Since then about a dozen
papers were published, and in 2004 a comprehensive report came out in book form (Frejka, Sardon 2004) and an update was presented at the 2005 IUSSP Conference (Frejka, Sardon 2005).
1.3 The data
The project analyzes a body of data on fertility for a large number of cohorts in 35 countries. More specifically, in the overall research project data were analyzed for a majority of European countries and for major overseas countries with populations that were principally of European origin and for Japan. These data were gathered at the
Institut National d'Études Démographiques in Paris since the end of the 1970s and
since 1996 by the Observatoire Démographique Européen, which was founded by Gérard Calot and of which Jean-Paul Sardon has been director in recent years. In addition we obtained data for several non-European low-fertility countries.
For the first birth analysis the range of countries, as well as the numbers of cohorts, are not as many as those for the total numbers of births. Only 27 countries and a lesser number of cohorts were available for analysis. In general, data are available for almost all the formerly socialist countries, for the Nordic countries and for Southern Europe. For the western countries data were available for England & Wales, the Netherlands and the United States. In the other countries birth order data were registered and gathered for births in current marriages, not for all births.
1.4 Findings of the overall project to date
The analysis for the low-fertility countries presented in the book (Frejka, Sardon 2004) and in the IUSSP paper (Frejka, Sardon 2005) came to the following principal substantive conclusions: Childbearing has never been as low as at the outset of the 21st century. A moderate fertility decline is likely to continue during the first decade. A fertility increase in the foreseeable future is unlikely. Incipient signs of fertility plateaus are apparent. Rates of recuperation among older women are slowing down. A low fertility plateau might be reached in individual countries with completed cohort fertility as low as 1.3 or less and probably no higher than 2.0 births per woman. The analysis implies that increases of total period fertility rates, including those of adjusted TFRs, in most countries are not a reflection of increases in cohort childbearing, but a result of lesser postponement of births.
The present paper is intended to investigate in greater detail aspects related to first births with the goal of furthering the understanding of the facts and mechanisms generating contemporary low fertility. Furthermore, we wish to be able to make some judgments about developments in the near future.
2. First birth levels and trends
Among the cohorts of the 1960s, i.e. those ending their reproductive careers early in the
21st century, the proportions of women having first births range from around 80 to 95
percent (Table 1 and Figures 1-3).
Populations with high proportions of women with first births were in Portugal, Bulgaria, Macedonia and Yugoslavia. All of these were from countries more to the South or South-East of Europe. The reliability of data when the percentage of women having first births exceeds about 95 percent is questionable and should be re-evaluated. Nevertheless, despite the measurement problems, apparently the degree of childlessness was relatively low in these countries.
At the other extreme, populations in which only close to 80 percent of women of the 1960s cohorts had first births were in Finland, England and Wales, the Netherlands, Austria, and Poland.
In most countries the percentage of women with first births in the 1960s cohorts was around 85 to 90 percent.
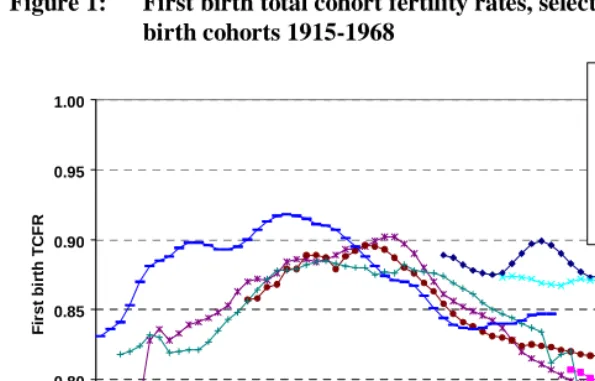
As already noted, unfortunately there is a limited number of western countries for which data are available. In Denmark and Sweden the frequency of first births was quite high and relatively stable (Table 1 and Figure 1). In England & Wales, the Netherlands and Austria there has been a declining trend starting with the cohorts of the mid- to late1940s when around 90 percent of women were having first births. For Finland we have only a short time series, but this fits in with the trends for England & Wales and Austria rather than with the other Nordic countries. In the Netherlands the proportion of women with first births stabilized around 82 percent among the cohorts of the 1960s. Since only about 80 percent of women born in the mid-1960s in these countries were having first births, with the reciprocal of 20 percent remaining childless, the question of whether this declining trend will continue is of considerable interest to demographers, policy makers and the general public.
The United States population experienced a long-term decline in the proportion of women having first births from 92 percent among the cohorts of the early 1930s to 84 percent in the cohorts of the early to mid-1950s. Since then it has remained stable at about 84 to 85 percent of women having first births (Table 1 and Figure 1).
Judging from the data in Table 1, in almost all of the formerly socialist countries of central and Eastern Europe the proportion of women born during the 1960s having a first birth was quite high. For the 1965 birth cohort the range was from 85 percent in
Poland to as high as 96 percent in Bulgaria3. For about thirty birth cohorts the first birth
total cohort fertility rates were stable at around 0.9 births per woman or higher starting with women born in the early 1930s (Figure 2). What needs to be realized is that the birth cohorts of the 1960s commenced their childbearing under the socialist regimes. As will become evident in a subsequent section of this paper, starting out with women born during the 1960s and especially those born in the 1970s life-time strategies of childbearing were changing at first modestly but increasingly at an accelerated pace. This is becoming evident in the trends of the first birth TCFRs which as a rule were declining. These populations are, however, in the middle of momentous changes of reproductive behavior. Based on the data available thus far, there are indications that the decline in the first birth TCFRs is likely to continue, with all probability quite rapidly and to low levels. All of this is, however, uncertain and only the future will tell.
The birth cohorts of the 1960s in the countries of Southern Europe, except for Portugal, experienced first birth TCFRs around 0.85 births per woman (Table 1 and Figure 3). These cohorts also appear to be in a transition to lower first birth TCFRs. Evidence below strengthens this hypothesis.
3
Table 1: Total first birth cohort fertility rates, 27 low fertility countries, birth cohorts 1930, 1940, 1950, 1960 and the latest available (1960s or early 1970s)
Total cohort fertility rates of cohort born in Annual change between birth cohorts (percent) Country
1930 1940 1950 1960 1965 Latest available 1930-1940 1940-1950 1950-1960 1960-1965 1965-latest Nordic Region
Denmark … … … 0.899 0.873 0.878g … … … -0.6 0.2
Finland … … … … 0.801 0.796f … … … … -0.3
Norway … … … … … … … ..
Sweden … … … 0.870 0.870 0.868f … … … 0.0 -0.1
Western Europe
England & Wales
0.870 0.893 0.861 0.811 … 0.796c 0.3 -0.4 -0.6 … -0.5
Netherlands … 0.888 0.854 0.824 0.817 0.816f … -0.4 -0.4 -0.2 -0.1
West Central Europe
Austria … … … … … … … …
Former GDR … 0.890 0.927 0.922 … 0.922b ... 0.4 -0.1 … …
Southern Europe
Greece … … 0.903 0.894 0.834 0.834e ... … -0.1 -1.4 -0.1
Italy … 0.854 0.870 0.849 … 0.849b … 0.2 -0.2 … …
Portugal … … … … 0.959 0.948g … … … … -0.4
Spain … … … 0.899 0.866 0.866d … … … -0.7 …
East Central Europe
Czech Republic … 0.923 0.933 0.936 0.929 0.887j … 0.1 0.0 -0.2 -0.8
Hungary … 0.910 0.909 0.924 0.903 0.865i … 0.0 0.2 -0.5 -0.9
Poland … … … 0.845 0.802j … … … … -0.9
Slovak Republic … 0.915 0.902 0.902 0.888 0.850j … -0.1 0.0 -0.3 -0.7
Eastern Europe
Bulgaria 0.907 0.960 0.984 0.969 0.955 0.926j 0.6 0.2 -0.2 -0.3 -0.5
Romania … … … 0.919 0.885 0.865i … … … -0.7 -0.4
Russia … … … 0.942 0.917 0.916e … … … -0.5 -0.1
Balkan Region
Bosnia & Herzegovina
… 0.884 0.896 … … 0.815a … 0.1 … … -1.4
Croatia … 0.914 0.939 0.952 0.882 0.867e … 0.3 0.1 -1.5 -1.8
Macedonia … 0.972 0.943 0.942 0.938 0.956j … -0.3 0.0 -0.1 0.3
Slovenia … 0.917 0.956 0.959 0.909 0.874h … 0.4 0.0 -1.1 -1.0
Serbia & Montenegro
… 0.961 0.998 0.972 0.940 0.933g … 0.4 -0.3 -0.7 -0.3
Baltic Region
Estonia … … … … … … … …
Latvia … … … … … … … …
Non European Countries
United States 0.900 0.901 0.844 0.846 … 0.846b 0.0 -0.7 0.0 … …
Figure 1: First birth total cohort fertility rates, selected western countries, birth cohorts 1915-1968
0.75 0.80 0.85 0.90 0.95 1.00
1915 1920 1925 1930 1935 1940 1945 1950 1955 1960 1965 1970 1975 Birth cohort
Fir
s
t bi
rt
h
TCF
R
Denmark Finland Norway Sweden England &Wales Netherlands Austria United States
Figure 2: First birth total cohort fertility rates, Central and East European countries, birth cohorts 1929-1972
0.75 0.80 0.85 0.90 0.95 1.00
1915 1920 1925 1930 1935 1940 1945 1950 1955 1960 1965 1970 1975 Birth cohort
F
ir
s
t bi
rt
h
TC
F
R
Figure 3: First birth total cohort fertility rates, South European countries, birth cohorts 1933-1968
0.75 0.80 0.85 0.90 0.95 1.00
1915 1920 1925 1930 1935 1940 1945 1950 1955 1960 1965 1970 1975 Birth cohort
Fi
rs
t bi
rt
h
TC
FR
Greece Italy Portugal Spain
3. Advancement and postponement of first births
Changes in the age patterns of births, in particular of first births, reflect numerous social processes taking place in a population. These could be changes in employment and education patterns, availability and affordability of housing for young people, changes in value systems and social norms, changes in public policies, to name some of the more obvious ones. Age patterns of first births and their changes are particularly important because of the potential room or lack thereof that is left for higher order births.
The advancements and postponement of childbearing have several manifestations, namely in the trends of mean ages of childbearing and in changes of age structures, as well as in changes of the intensity of childbearing at young and older ages. Consequently, the following investigation of changes in first birth advancement and postponement uses several different approaches and measures:
• the cohort mean age of first birth (section 3.A.),
• the age structure of first births in cohorts that have effectively completed their
childbearing (section 3.B),
• analyses of trends in first birth cumulated rates of older and young women
(sections 3.C and 3.D)
• detailed analyses of age patterns of first births in cohorts that have completed
3.1 The cohort mean age at first birth
The cohort mean ages of first births inform on whether first births occur on average early or late, and the trends are a crude indication of whether fertility is being advanced or postponed (Table 2 and Figure 4).
Among western countries the United States has a low mean age of first birth (CMAFB) in the birth cohorts of the early 1960s, 24.5 years. In contrast, the Netherlands has one of the highest CMAFB, almost 29 years among the birth cohorts of the mid-1960s. Other countries of Western and Southern Europe had CMAFB around 26 or 27 years in the 1960s cohorts.
The long-term trends of the CMAFBs typically exhibit a decline among the birth cohorts of the 1920s, 1930s and possibly even the 1940s indicating the advancement of first births into younger ages. After reaching a turning point the CMAFBs invariably start to increase, a manifestation of first birth postponement. The turning point occurs first in the United States among the cohorts of the late 1930s; in England & Wales and the Netherlands among the cohorts of the 1940s; in Italy among the cohorts of the mid-1950s; and in Greece in the cohorts born around 1960.
In the Czech Republic and Hungary patterns are very different. CMAFBs are considerably younger and up to the cohorts born around 1960 trends are rather flat compared to the Western ones (Figure 4). An apparent increase of the CMAFBs occurred among the cohorts of the 1960s demonstrating birth postponement.
Figure 4: Cohort mean age at first birth, selected countries, birth cohorts 1915-1971
21 22 23 24 25 26 27 28 29 30
1915 1920 1925 1930 1935 1940 1945 1950 1955 1960 1965 1970 1975 Birth cohort Co h o rt mea n ag e at f ir s t b ir th
Table 2: Cohort mean age at first birth, 27 low fertility countries, birth cohorts 1930, 1940, 1950, 1960 and the latest available (1960s or early 1970s)
Mean age at first birth of cohort born in Annual change between birth cohorts (percent) Country
1930 1940 1950 1960 1965 Latest available 1930-1940 1940-1950 1950-1960 1960-1965 1965-latest Nordic Region
Denmark … … 23.91 26.20 27.20 27.41e … … 0.9 0.8 0.3
Finland … … … … 27.03 27.25d … … … … 0.4
Norway … … … …
Sweden … … … 26.47 26.88 27.05d … … … 0.3 0.3
Western Europe
England & Wales 24.94 23.89 24.22 25.83 26.34 … -0.4 0.1 0.6 0.4 …
Netherlands 26.03 24.98 25.07 27.54 28.40 28.71d -0.4 0.0 0.9 0.6 0.5
West Central Europe
Austria … … … … … 25.91f … … … … …
Former GDR … 22.76 22.17 22.07 … 22.09a … -0.3 0.0 … 0.1
Southern Europe
Greece … … 24.51 24.30 25.36 25.93d … … -0.1 0.9 1.1
Italy … 25.35 24.86 26.01 … 26.30a … -0.2 0.5 … 1.1
Portugal … … … … 25.24 25.75e … … … … 0.7
Spain … … … 26.00 27.38 27.65c … … … 1.0 2.1
East Central Europe
Czech Republic … 22.48 22.57 22.35 22.54 23.28g … 0.0 -0.1 0.2 0.5
Hungary … 22.77 22.68 22.51 23.06 23.92f … 0.0 -0.1 0.5 0.7
Poland … … … 23.30 23.31 23.93h … … … 0.0 0.4
Slovak Republic … 22.33 22.88 22.66 22.67 23.09g … 0.2 -0.1 0.0 0.3
Eastern Europe
Bulgaria 22.60 22.01 22.10 21.99 22.12 22.89g -0.3 0.0 -0.1 0.1 0.6
Romania … … … 22.27 22.50 23.30g … … … 0.2 0.6
Russia … … … 22.91 22.66 22.54d … … … -0.2 -0.3
Balkan Region
Bosnia & Herzegovina 23.13 23.03 … … … … 0.0 … … …
Croatia 23.29 23.18 23.38 23.87 23.95d … 0.0 0.1 0.4 0.2
Macedonia 23.30 23.32 23.37 23.56 23.78h … 0.0 0.0 0.2 0.1
Slovenia 23.96 23.17 22.71 23.69 25.04f … -0.3 -0.2 0.8 1.1
Serbia & Montenegro … 22.91 22.93 23.66 24.16 24.22e … 0.0 0.3 0.4 0.1
Baltic Region
Estonia … … … … …
Latvia … … … … …
Non European Countries
United States 22.51 22.00 23.45 24.53 … 24.61a -0.2 0.6 0.5 … …
3.2 The age structure of first births
A simple device to express the state of the age structure of first births in cohorts that have effectively completed their childbearing is the proportion of these births borne by
“young” women, for instance, those up to the 27th birthday (Table 3). In the formerly
socialist countries of central and Eastern Europe this proportion was between 80 and 90 percent in the birth cohorts of the mid-1960s. It had remained stable among several decades of previous cohorts, but it was beginning to decline in all these populations, except for the Russian Federation.
Among the market economies, the proportion of first births borne by “young”
women up to the 27th birthday in the 1960s birth cohorts was as low as 40 percent in the
Netherlands, between 50 and 60 percent in the Nordic countries and in England & Wales, and between 60 and 65 percent in the South European countries (Table 3). These proportions had been changing notably among earlier cohorts. For instance, in England & Wales this proportion was increasing among the cohorts of the 1930s, up to over 80 percent. Among the subsequent cohorts of the 1940s and 1950s it was continuously declining. Similar changes were apparently under way in the Nordic countries. In the United States close to 90 percent of first births were borne by young women among the 1930s birth cohorts and this proportion then declined to below 70 percent in the 1960 cohort (Table 3).
Whatever the absolute level, whether it was 40 percent or close to 90 percent, the prevailing trend among the latest cohorts was a decline in the proportions of births borne by young women.
3.3 Fertility of older women
Another type of insight is gained from data on the levels and trends in fertility of older women. Table 4 provides information on the cumulated first birth cohort fertility rates after the 27th birthday.
In the Nordic and West European countries in the 1960s birth cohorts around 0.4 children were born per woman, in the Netherlands 0.5 (Table 4). This was about double or more above the level of cohorts born in the 1940s. In the United States older women were bearing less than 0.3 births in the 1960s cohorts. Nonetheless, the value for the 1960 cohort was 2.5 times above that of the 1940 cohort.
Table 3: The proportion of first birth total cohort fertility (TCFR ) completed by 27th birthday, 27 low fertility countries, birth cohorts 1930, 1940, 1950, 1960, 1965 and 1970.
Proportion of 1st birth TCFR completed up
to 27th birthday of cohort born in Annual change between birth cohorts (percent)
Country
1930 1940 1950 1960 1965 1970
1930-1940 1940-1950 1950-1960 1960-1965 1965- 1970 Nordic Region
Denmark … … … 60.0 51.6 ... … … … -3.0 ...
Finland … … … … 53.0 ... … … … … ...
Norway … … … … … ... … … … … ...
Sweden … … … 56.7 56.6 ... … … … 0.0 ...
Western Europe
England & Wales 72.0 81.0 73.1 61.3 … ... 1.2 -1.0 -1.8 … ...
Netherlands … 74.8 71.2 48.0 39.7 ... … -0.5 -4.0 -3.8 ...
West Central Europe
Austria … … … … … ... … … … … ...
Former GDR ... 88.1 91.3 92.8 … ... ... 0.4 0.2 … ...
Southern Europe
Greece ... … 74.2 73.9 64.4 ... ... … 0.0 -2.8 ...
Italy ... 70.6 73.7 60.5 ... ... ... 0.4 -2.0 ... ...
Portugal … … … … 66.5 ... … … … … ...
Spain … … … 61.0 ... ... … … … ... ...
East Central Europe
Czech Republic … 90.3 90.1 89.9 89.3 82.8 … 0.0 0.0 -0.1 -1.5
Hungary … 86.3 87.7 87.0 84.3 76.4 … 0.2 -0.1 -0.6 -2.0
Poland … ... ... … 85.9 82.0 … ... ... … -0.9
Slovak Republic … 91.1 88.5 89.1 89.2 84.6 … -0.3 0.1 0.0 -1.0
Eastern Europe
Bulgaria 88.4 91.2 90.8 90.6 89.6 83.9 0.3 0.0 0.0 -0.2 -1.3
Romania ... … … 89.5 87.0 82.2 ... … … -0.6 -1.1
Russia … … … 87.4 89.0 ... … … … 0.4 ...
Balkan Region
Bosnia & Herzegovina
… 86.5 85.1 ... ... ... … -0.2 ... ... ...
Croatia … 84.9 83.3 82.1 79.6 ... … -0.2 -0.1 -0.6 ...
Macedonia … 86.8 84.4 83.3 80.8 79.6 … -0.3 -0.1 -0.6 -0.3
Slovenia … 82.0 84.7 86.2 79.9 ... … 0.3 0.2 -1.5 ...
Serbia & Montenegro
… 86.3 83.7 78.9 76.0 … … -0.3 -0.6 -0.7 …
Baltic Region
Estonia ... ... … … … ... ... ... … … …
Latvia ... ... … … … … ... ... … … …
Non European Countries
In the formerly socialist countries of central and Eastern Europe the cumulated cohort first birth fertility rates in the 1960s cohorts were only about 0.1 birth per woman, almost unchanged since the cohorts of the 1930s (Table 4). It was only among the cohorts of the late 1960s that these started to change more markedly.
To the extent data are available, there is a general tendency for the fertility of older women to increase among the more recent cohorts.
3.4 A crude international comparison of first birth fertility of young women
So far we have dealt exclusively with cohorts that have effectively completed their childbearing. The fertility patterns of cohorts that are in various stages of incomplete childbearing can also provide useful insights. The main contribution of such an exploration is to provide an understanding of the childbearing behavior of women of various ages that are shaping contemporary fertility.
First birth cumulative cohort fertility rates (CCFR) up to the 27th birthday
including the cohorts of the 1970s are in Table 5. The first birth CCFRs of young women in the Nordic and West European countries in the early and mid-1970s birth cohorts were between 0.3 and 0.4 births per woman. In the South European countries they were lower, between 0.2 and 0.3 births per woman; Portugal was an exception with a first birth CCFR of 0.4. In the formerly socialist countries these CCFRs were in the order of 0.5 to 0.7 births per woman in the 1975 birth cohort (Table 5). In the United States the first birth CCFR of young women was 0.6 per woman in the 1960s birth cohorts.
The first birth fertility rates of young women have been declining starting with the birth cohorts of around 1940 in the market economy populations. In the formerly socialist countries the first birth CCFRs were stable through the birth cohorts of around 1960. Thereafter these started to decline and this decline has accelerated markedly among the cohorts born in the 1970s (Table 5). The decline of first birth fertility of young women has also been rapid among the countries of Southern Europe in the birth cohorts of the 1960s and early 1970s; and of a robust pace in the Nordic countries, England & Wales and Austria.
Table 4: Childbearing (cumulated 1st birth cohort fertility rate, CCFR) after 27th birthday, 27 low fertility countries, birth cohorts 1930, 1940, 1950, 1960, 1965 and 1970.
Cumulated fertility after 27th birthday Decennial change between cohorts (percent) Country
1930 1940 1950 1960 1965 1970 1930-1940 1940-1950 1950-1960 1960-1965 1965-1970 Nordic Region
Denmark … … … 0.360 0.422 … … … … 17.4 ...
Finland … … … … 0.376 … … … ...
Norway … … … ...
Sweden … … … 0.377 0.378 … … … … 0.2 ...
Western Europe
England & Wales 0.243 0.169 0.231 0.314 … … -30.4 36.6 35.7 … ...
Netherlands … 0.223 0.246 0.429 0.493 … … 10.0 74.5 14.9 ...
West Central Europe
Austria … … … … … ... … … … … ...
Former GDR … 0.106 0.080 0.066 … … ... -24.5 -17.2 … ...
Southern Europe
Greece … … 0.233 0.233 0.297 … ... … -0.2 27.5 ...
Italy … 0.251 0.229 0.335 … … ... -8.8 46.5 ... ...
Portugal … … … … 0.321 … … … ...
Spain … … … 0.351 0.447 … … … … 27.4 ...
East Central Europe
Czech Republic … 0.090 0.092 0.095 0.099 0.156 … 3.1 2.2 4.9 56.9
Hungary … 0.124 0.112 0.120 0.142 0.204 … -10.2 7.5 18.5 43.6
Poland … … … … 0.119 0.147 … ... ... … 23.6
Slovak Republic … 0.081 0.104 0.098 0.096 0.133 … 27.8 -5.3 -1.8 38.0
Eastern Europe
Bulgaria 0.106 0.085 0.091 0.091 0.099 0.151 -19.7 7.3 0.5 8.3 52.7
Romania … … … 0.096 0.115 0.154 ... … … 19.6 33.4
Russia … … … 0.119 0.101 … … … … -14.7 ...
Balkan Region
Bosnia & Herzegovina
… 0.119 0.134 … … … … 12.3 ... ... ...
Croatia … 0.138 0.157 0.170 0.180 … … 13.5 8.7 5.6 ...
Macedonia … 0.128 0.147 0.158 0.180 0.193 … 15.0 7.1 13.9 7.2
Slovenia … 0.165 0.146 0.132 0.183 … … -11.5 -9.3 38.3 ...
Serbia & Montenegro … 0.131 0.163 0.205 0.226 … … 24.1 26.0 10.0 …
Baltic Region
Estonia … … … … ... ... … … …
Latvia … … … … ... ... … … …
Non European Countries
Table 5: First birth cumulated cohort fertility rates (CCFRs) up to 27th birthday, 27 low fertility countries, birth cohorts 1930, 1940, 1950, 1960, 1970 and 1975 (or latest available)
Country First birth CCFR up to 27th birthday Annual change between birth cohorts (percent)
1930 1940 1950 1960 1965 1970 1975 or latest available 1930-1940 1940-1950 1950-1960 1960-1965 1965-1970 1970-1975 (or latest available) Nordic Region
Denmark … … … 0.539 0.451 0.421 0.350 … … … -3.6 -1.4 -3.7
Finland … … … … 0.425 0.393 0.348 … … … … -1.5 -2.5
Norway … … … … … 0.493 0.419 … … … … -3.3
Sweden … … … 0.493 0.493 0.427 0.319 … … … 0.0 -2.9 -5.9
Western Europe
England & Wales 0.627 0.723 0.630 0.497 0.455 0.433 0.392d 1.4 -1.4 -2.4 -1.8 -1.0 -2.5
Netherlands … 0.665 0.608 0.395 0.324 0.268 0.268 … -0.9 -4.3 -4.0 -3.8 0.1
West Central Europe
Austria … … … … … 0.471 0.407 … … … … … -2.9
Former GDR … 0.784 0.847 0.856 … … … ... 0.8 0.1 … … ...
Southern Europe
Greece … … 0.670 0.661 0.537 0.397 0.311 ... … -0.1 -4.1 -6.1 -4.9
Italy … 0.604 0.641 0.514 0.391 0.298 0.298a ... 0.6 -2.2 -5.5 -5.5 ...
Portugal … … … … 0.638 0.528 0.445 … … … … -3.8 -3.4
Spain … … … 0.548 0.419 0.278 0.192 … … … ... -8.2 -7.4
East Central Europe
Czech Republic … 0.833 0.841 0.842 0.830 0.748 0.536 … 0.1 0.0 -0.3 -2.1 -6.6
Hungary … 0.785 0.797 0.804 0.761 0.661 0.481 … 0.1 0.1 -1.1 -2.8 -6.4
Poland … … … … 0.726 0.672 0.546 … ... ... … -1.5 -4.2
Slovak Republic … 0.834 0.798 0.804 0.792 0.731 0.574 … -0.4 0.1 -0.3 -1.6 -4.8
Eastern Europe
Bulgaria 0.801 0.875 0.893 0.877 0.856 0.787 0.604 0.9 0.2 -0.2 -0.5 -1.7 -5.3
Romania … … … 0.822 0.770 0.712 0.569 ... … … -1.3 -1.6 -4.5
Russia … … … 0.823 0.816 0.798 0.778b … … … -0.2 -0.4 -2.5
Balkan Region
Bosnia & Herzegovina… 0.764 0.762 0.681 … … … … 0.0 -1.1 ... … ...
Croatia … 0.776 0.782 0.782 0.702 0.554 0.505c … 0.1 0.0 -2.2 -4.8 -3.1
Macedonia … 0.844 0.796 0.785 0.758 0.753 0.708 … -0.6 -0.1 -0.7 -0.2 -1.2
Slovenia … 0.753 0.810 0.826 0.726 0.584 0.443 … 0.7 0.2 -2.6 -4.4 -5.5
Serbia & Montenegro… 0.830 0.835 0.767 0.715 0.675 0.578 … 0.1 -0.9 -1.4 -1.2 -3.1
Baltic Region
Estonia … … … … 0.592 ... ... … … … …
Latvia … … … … 0.582 ... ... … … … …
Non European Countries
United States 0.780 0.793 0.649 0.577 0.563 … … 0.2 -2.0 -1.2 -0.5 … ...
The decline in the first birth fertility of young women in the cohorts born in the late 1960s and early 1970s is a combination of two factors which cannot be isolated, namely it is the combination of childbearing postponement and fertility quantum changes. The relative weight of the two forces will not be known until these cohorts will have completed their first birth childbearing. It is however evident that in almost all the countries of our sample the decline of first birth childbearing among the youngest cohorts was robust.
4. The age patterns of first births
A better understanding of first births levels and trends can be gained by observing detailed changes of the age patterns of childbearing, measured by single-year age-specific fertility rates, in individual populations. Insights are gained by analyzing trends in cohorts that have completed their childbearing as well as in cohorts that are at various stages of their childbearing careers.
Brief analyses of these changes in the following selected countries are presented4:
Denmark
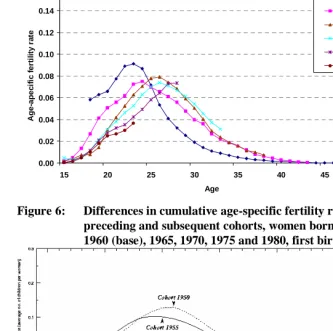
In Denmark the first birth TCFR was between 0.88 to and 0.90 births per woman in the cohorts of the 1950s and 1960s. In other words, 88 to 90 percent of women were having a first birth which was at the high end for the advanced western countries (Figure 1). The age-specific fertility schedules of the 1950 through 1975 birth cohorts depict a steady progression of childbearing postponement (Figure 5). The peak age of childbearing was shifting steadily to the right from age 23 in the 1950 cohort to age 26 in the 1965 and 1970 schedules, to at least age 28 in the 1975 schedule.
The fertility of younger women prior to the peak age was declining from one cohort to the next. Conversely, fertility after the peak age was increasing in successive cohorts.
Taking the age-specific fertility schedule of the 1960 birth cohort as a base for comparison with previous and subsequent cohorts, the magnitude of the differences between cumulated fertility is depicted (Figure 6). First, one can observe the continuing fertility decline prior to the peak age of childbearing, which indicates the continuing postponement of childbearing. At the ages 25 to 27 the curve for each subsequent cohort is below that of the previous cohort. Second, when the fertility of the older ages is added, all curves for the cohorts of the 1950s, the 1960s and the 1970 birth cohort
4
converge to approximately the same level, namely to 0.88 to 0.90 births per woman. The first birth fertility that was being postponed at younger ages was being fully recuperated when women became older (Figure 6).
Figure 5: Age-specific fertility rates, first births, birth cohorts 1950, 1960, 1965, 1970, 1975 and 1980, Denmark
0.00 0.02 0.04 0.06 0.08 0.10 0.12 0.14 0.16
15 20 25 30 35 40 45
Age
A
g
e-ap
ec
if
ic
f
e
rt
il
it
y
ra
te
1950 1960 1965 1970 1975 1980
England & Wales
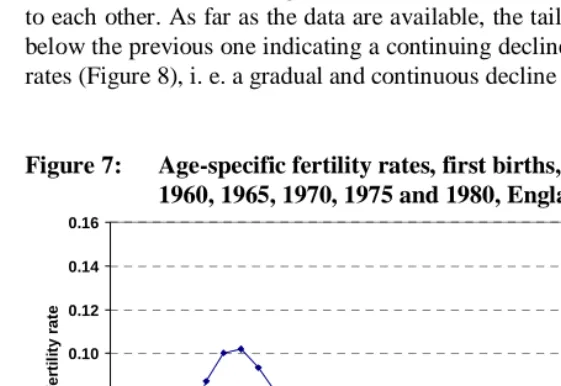
The overall level of first births had been declining since the cohorts of the early 1940s from a TCFR of 0.90 in the cohorts of 1942 to 1946, to 0.86 in the 1950 cohort and 0.81 in the 1960 cohort (Figure 1). This decline is reflected in the comparisons of the curves for the 1940, 1950 and 1960 cohorts in Figure 7.
In England & Wales the process of childbearing postponement also has the characteristic that fertility of young women starting with the cohorts of the early 1940s is declining from one cohort to the next; and conversely fertility of older women is increasing in subsequent cohorts (Figure 7). In distinction to many other advanced western countries, the peak fertility age among women in their twenties has disappeared and instead age-specific fertility rates of these women in their twenties tend to be at an even level, the curves are flat.
Altogether cumulatively the postponement of fertility at young ages and the fertility recuperation at older ages was moderate starting with the cohorts of the mid-1950s as can be seen in Figure 8. The curves of the 1955 to 1970 cohorts are quite close to each other. As far as the data are available, the tail end of each subsequent cohort is below the previous one indicating a continuing decline of total first birth cohort fertility rates (Figure 8), i. e. a gradual and continuous decline in the quantum of childbearing.
Figure 7: Age-specific fertility rates, first births, birth cohorts 1940, 1950, 1960, 1965, 1970, 1975 and 1980, England & Wales
0.00 0.02 0.04 0.06 0.08 0.10 0.12 0.14 0.16
15 20 25 30 35 40 45
Netherlands
The first birth TCFR was declining from its peak in the 1942 cohort through the cohorts of the mid 1950s. The peak of age-specific fertility was at age 24 in the 1940 and 1950 cohorts. This was followed by a considerable change in the shape of the curve to the right in the 1960 cohort (Figure 9). Childbearing at young ages declined notably, and increased substantially at the older ages. The peak of the curve however shifted by only one year, namely to age 25.
Among the cohorts of the 1960s the postponement of childbearing continued at a more moderate pace with declines of fertility among young women and an increase among the older women (Figure 9). At the same time, the peak of childbearing shifted considerably to the right with a peak at age 29 in the 1970 cohort. -- Childbearing postponement appears to have ceased so far among the cohorts of the 1970s. The curves of the 1970, the 1975 and the 1980 cohorts are proceeding along very similar age trajectories. Of course this can be observed only up to age 28 for the 1975 cohort, and up to age 23 in the 1980 cohort.
Figure 10 confirms the above findings. The postponement of fertility was quite pronounced among the cohorts of the 1950s, less so among the 1960s cohorts, and so far it has ceased among the cohorts of the 1970s. At the same time, the first birth TCFRs declined only moderately among the cohorts of the 1950s, and even less so among the 1960s cohorts.
Figure 9: Age-specific fertility rates, first births, birth cohorts 1940, 1950, 1960, 1965, 1970, 1975 and 1980, Netherlands
0.00 0.02 0.04 0.06 0.08 0.10 0.12 0.14 0.16
15 20 25 30 35 40 45
Italy
Among the Italian birth cohorts of the 1930s, 1940s and 1950s between 85 and 89 percent of women were having first births. This proportion showed some decline among the most recent cohorts of the late 1950s (Figure 3).
Following an advancement of fertility between the 1940 and 1950 cohorts, a steady progress of childbearing postponement became clear among the cohorts of the 1950s and 1960s (Figure 11). Unfortunately, the available data series are shorter than for other countries. Nonetheless, the data demonstrate a continuing decline of fertility of young women through the cohorts of the 1970s, and an increase of childbearing of older women from one cohort to the next among the cohorts of the 1960s.
The decline of fertility among young women was notable, especially between the 1960 and 1970 cohorts (Table 4 and Figure 12). A propensity to recuperate the postponed births at older ages was demonstrated. Among the 1950s cohorts only a part of the postponed births were recuperated which resulted in a moderate decline of the first birth TCFRs. The data series are not long enough to show the final outcome for the 1960s cohorts.
Figure 11: Age-specific fertility rates, first births, birth cohorts 1940, 1950, 1960, 1965, 1970, 1975 and 1980, Italy
0.00 0.02 0.04 0.06 0.08 0.10 0.12 0.14 0.16
15 20 25 30 35 40 45
Age
A
g
e-s
p
eci
fi
c fer
ti
li
ty
r
a
te
Czech Republic
The first birth TCFRs were consistently high for over 30 cohorts through those of the early 1960s. The proportion of women having first births was around 92 to 94 percent (Figure 2). Women were having the first births early; over 80 percent were born between the ages of 18 and 25 (Figure 13). And the age pattern of first births differed very little from one cohort to the next.
The collapse of the authoritarian communist regime in 1989 and the ensuing transformation of the political and economic system triggered changes in the fertility patterns. The quantum of first births started to decline among the cohorts of the 1960s (Figure 2) and the age patterns of childbearing started to change (Figure 13). A continuing considerable postponement of childbearing started with the birth cohorts of the late 1960s. Compared to the 1965 cohort fertility was notably lower among women at ages 23 to 25 in the 1970 cohort, and many of these births were born after age 27.
A large and unprecedented decline of first birth childbearing took place among young women in the cohorts of the 1970s (Figure 13). Many of these births were being realized as women were aging. After age 25 the intensity of first births was considerably higher in the 1975 compared to the 1970 cohort. At age 28 the 1975 age-specific fertility rate in the 1975 cohort was almost twice as large as in the cohort five years older (Figure 13).
Figure 13: Age-specific fertility rates, first births, birth cohorts 1940, 1950, 1960, 1965, 1970, 1975 and 1980, Czech Republic
0.00 0.02 0.04 0.06 0.08 0.10 0.12 0.14 0.16
15 20 25 30 35 40 45
Age
A
g
e
-sp
eci
fi
c fer
ti
li
ty r
a
te
1940 1950 1960 1965 1970 1975 1980
Romania
The proportion of women having first births was declining from about 94 percent in the cohorts born around 1950 to 92 percent in the 1960 cohort and to estimates of about 86 percent in the cohorts born around 1970 (Figure 2).
The age patterns of childbearing were steady among the cohorts of the 1950s and early 1960s (Figure 15). Similarly as in the other central and East European formerly socialist countries, the transition from an authoritarian to a more democratic and market oriented society affected childbearing behavior. Among the cohorts of the late 1960s and the 1970s, fertility of young women declined from one cohort to the next (Figure 15). At the same time, as far as can be observed so far, fertility of these women when they become older has been increasing. The childbearing transition has been proceeding at a slower pace in Romania compared, for instance, to the Czech Republic.
Figure 16 illustrates the continuous decline of fertility of young women among the cohorts of the late 1960s and 1970s. As the women were getting older there was a propensity for recuperation, but it is not conclusive whether there will be a full catching up. Trends for the cohorts of the 1970s point to some skepticism.
Figure 15: Age-specific fertility rates, first births, birth cohorts 1940, 1950, 1960, 1965, 1970, 1975 and 1980, Romania
0.00 0.02 0.04 0.06 0.08 0.10 0.12 0.14 0.16
15 20 25 30 35 40 45
United States
First birth TCFRs were declining from a high of 0.92 in the birth cohorts of the early 1930s to a turning point of 0.84 in the mid-1950s cohorts after which a moderate increase ensued to 0.85 in the cohorts born around 1960 (Figure 1).
The decline in first birth fertility among the cohorts of the 1940s and early 1950s was accompanied by a distinct postponement of first births (Figure 17). Age-specific fertility rates were declining rapidly among young women, especially in the peak ages of childbearing, i.e. between the ages of 18 to 21; and increasing notably when women of these cohorts were in their late 20s and thirties.
The postponement of childbearing slowed down considerably among the cohorts of the early 1960s (Figure 17). Fertility postponement ceased altogether among the cohorts of the late 1960s and apparently started to reverse itself in the birth cohorts of the early 1970s.
Figure 18 illustrates that changes in the timing of childbearing which occurred starting with the 1955 cohort were small as the curves differ very little one from the other.
Figure 17: Age-specific fertility rates, first births, birth cohorts 1940, 1950, 1960, 1965, 1970, 1975 and 1980, United States
0.00 0.02 0.04 0.06 0.08 0.10 0.12 0.14 0.16
15 20 25 30 35 40 45
Figure 18: Differences in cumulative age-specific fertility rates between base, preceding and subsequent cohorts, women born in 1950, 1955, 1960 (base), 1965, 1970, 1975 and 1980, first births, United States
5. Findings and conclusions
The general overriding conclusion is that the levels and trends of various facets concerning first births are continuously changing and in a state of flux. More specifically, all the evidence confirms that the postponement of first births is an ongoing and persisting process. To date this process has ceased only in two countries, the Netherlands and the United States. The continuous postponement of first births can lead to a decline in fertility because there is less time remaining for second and higher order births.
Other specific findings of the present investigation are the following:
• In many countries the proportions of women having first births are declining
countries the proportions of women having first births have stabilized, namely in Northern Europe, the Netherlands and the United States. The prevailing trend of decline in women with first births by definition means that the proportion of childless women is increasing. Other things being equal, an increase in childlessness contributes to the exacerbation of low fertility in advanced countries. Furthermore, the decline in the level of first births can lead to lower fertility, because the base of women for second and higher order births diminishes.
• The mean age of women having a first birth is almost universally on the rise
indicating a strong tendency of continued first birth postponement. Other things being equal, continued first birth postponement leaves less room for higher order births. Also, higher order births are deferred to ages of lower fecundability, increasing the probability of lower fertility.
• The age structure of first births varies widely. In western and Nordic countries
40 to 60 percent of first births are borne by women below age 27 in the 1960s birth cohorts; in the central and East European countries between 80 to 90 percent of all first births were still borne by women below age 27. Whatever the absolute level, whether it was 40 percent or close to 90 percent, the prevailing trend among the latest cohorts was a decline in the proportions of births borne by young women.
• The age patterns of first birth fertility differ widely. They can be concentrated
within a narrow age range or spread out over a larger range of ages within the reproductive period. Most importantly, age patterns of first birth fertility are changing everywhere.
• Fertility of older women was increasing almost everywhere among the cohorts
of the 1960s. In the western countries fertility of these women was two to three times above that of the 1930s and 1940s birth cohorts. In the formerly socialist countries the increase in childbearing of older women was only just starting in the 1960s birth cohorts.
• Childbearing of young women was declining almost universally. In the South
late 1960s and the early 1970s; in Southern Europe as well as in central and Eastern Europe the rates of decline have accelerated.
• Age patterns of childbearing of young women in the birth cohorts of the 1960s
and 1970s were changing almost everywhere. The changes were more pronounced in the formerly socialist countries, especially among the cohorts born during the 1970s. Childbearing behavior in these countries is in transition to a different regime. The US continues to have exceptional age patterns of fertility: they are stable.
• Apparently a considerable part of the decline in first birth fertility of young
women in the cohorts born in the late 1960s and early 1970s is due to the postponement of first births. At the same time there could be a decline in the overall quantum of fertility. The relative weight of the two forces cannot be isolated at present and it will not be known until these cohorts will have completed their first birth childbearing.
• The magnitude of first birth fertility decline among the cohorts of the late
1960s and the early 1970s in a number of countries is so large that a major increase of fertility when these women will be older will be needed in order to avoid further declines in the quantum of first births.
6. Acknowledgements
References
Frejka, Tomas and Gérard Calot. 2001. "Cohort reproductive patterns in low-fertility countries," Population and Development Review, 27 (1): 103-132.
Frejka, Tomas, and Jean-Paul Sardon. 2004. Childbearing Trends and Prospects in
Low-Fertility countries: A cohort analysis, Dorbrecht: Kluwer Academic
Publishers, 2004.
---. 2005. “The direction of contemporary fertility trends in the developed countries: Further decline, plateau or upswing?” (with J.-P. Sardon) Proceedings
of the XXV IUSSP International Conference, Tours, France, 2005.
Hajnal, John. 1947. “The analysis of birth statistics in the light of recent international recovery of the birth-rate,” Population Studies 1 (2): 137-164.
Henry, Louis. 1953. Fécondité des mariages. Nouvelle méthode de mesure. Travaux et Documents, Cahier n° 16, INED-PUF.
Kim, Young J. and Robert Schoen. 2000. “On the quantum and tempo of fertility: Limits to the Bongaarts-Feeney adjustment,” Population and Development
Review 26(3): 554-559.
Kohler, Hans-Peter and Dimiter Philipov. 2001. “Variance effects in the Bongaarts-Feeney formula,” Demography 38(1): 1-16.
Kohler, Hans-Peter, Francesco C. Billari and José Antonio Ortega. 2002.”The emergence of lowest-low fertility in Europe during the 1990s,” Population and
Development Review 28 (4): 641-680.
Philipov, Dimiter and Hans-Peter Kohler. 2001. “Tempo effects in the fertility decline in Eastern Europe: Evidence from Bulgaria, the Czech Republic, Hungary, Poland and Russia,” European Journal of Population 17(1): 37-60.
Ryder, Norman B. 1951. The Cohort Approach. Ph. D. Dissertation. Princeton University. New York: Arno Press, 1980.
---. 1986. “Observations on the history of cohort fertility in the United States,”
Population and Development Review 12 (4): 617-643.
Schoen, Robert. 2004. “Timing effects and the interpretation of period fertility,”
Demography, 41(4): 801-819.
Sweden,” Demographic Research 8(6): 151-213. [www.demographic-research.org]
---. 2004. “Is lowest-low fertility in Europe explained by the postponement of childbearing?” Population and Development Review 30 (2): 195-220.
Van Imhoff, Evert and Nico Keilman. 2000. “On the quantum and tempo of fertility: Comment,” Population and Development Review 26(3): 549-553.
Whelpton. Pascal K. 1954. Cohort Fertility: Native White Women in the United States. Princeton, N.J.: Princeton University Press.