in the population sciences published by the Max Planck Institute for Demographic Research Konrad-Zuse Str. 1, D-18057 Rostock · GERMANY www.demographic-research.org
DEMOGRAPHIC RESEARCH
VOLUME 11, ARTICLE 9, PAGES 235-262
PUBLISHED 30 NOVEMBER 2004
www.demographic-research.org/Volumes/Vol11/9/
DOI: 10.4054/DemRes.2004.11.9
Research Article
A Method for Estimating Size of
Population Aged 90 and over with
Application to the 2000 U.S. Census Data
Kirill F. Andreev
1 Introduction 236
2 Das Gupta’s original method 237
3 Implicit assumptions underlying the Das Gupta method 240
4 Method 242
5 Performance evaluation 244
6 Application to the 2000 U.S. Census data 245
7 Summary and future enhancements 248
8 Acknowledgments 250
Notes 251
References 252
Figures and tables 254
Research Article
A Method for Estimating Size of Population Aged 90 and over with
Application to the 2000 U.S. Census Data
Kirill F. Andreev 1
Abstract
In many countries population estimates are unreliable at higher ages. In this article a method for producing an independent estimate of population aged 90+ from data on deaths and population estimates at lower ages is developed. The method builds on an indirect mortality estimate from deaths only and on an estimate of rate of mortality change. Theoretical foundation and bias expected on application of this procedure to the real data are discussed as well. Testing of this method on accurate demographic data shows its superiority over available procedures. The method has been applied to the evaluation of size of population 90+ in the census 2000 of the United States. The results show a high degree of agreement between two estimates, but the possibility of slight overestimation of males in census data cannot be completely ruled out. To facilitate the application of this method, a computer program is provided as well.
1
Department of Community Health & Epidemiology, Abramsky Hall, Queen's University Kingston, Ontario, Canada K7L 3N6. E-mail: [email protected]. Phone: +1 (613) 533-6000 ext. 78153. Fax: +1 (613) 533 6353.
1. Introduction
Over the last century, developed countries experienced an unprecedented increase in life expectancy at birth. As death rates at younger ages reached exceptionally low levels, the focus of mortality research shifted towards analysis of mortality developments at older ages. It turned out that only a few countries have reliable data for advanced ages covering mostly recent periods. Population figures regularly returned by censuses at ages exceeding ninety or one hundred years are often overstated, and if combined with deaths, produce obviously incorrect estimates of death rates. This observation is often supported by analysis of time trends in death rates and age specific schedules at the time a census is conducted. More reasonable estimates of death rates can be obtained by the extinct generation method pioneered by Vincent in 1951. In this method a population at risk is produced by summing up the deaths that occur in the current cohort above a certain age. This method relies on higher accuracy of age reporting on death certificates than on census returns. It also assumes that migration is negligible and can be safely ignored.
To apply the extinct generation method, it is necessary to wait until there are no survivors in a cohort. As a result we are not able to produce estimates for the most recent years, as younger cohorts are not extinct yet. This realization led to the development of the almost extinct generation (cohort) method in which populations at risk are obtained by summing up both deaths and survivors of the respective cohorts (Kannisto, 1994). By applying this method, death rates can be computed for all years with available deaths.
The almost extinct cohort method requires population estimates at the end of the last year with available death data. These population estimates have to be available by single year of age up to the highest age attained (Kannisto, 1994; Wilmoth, 2002). In many countries such data are not readily available. A common observation is that population estimates become progressively unreliable with age. Consequently, they are often published as an open age group e.g. 90 and over. To apply this method, we therefore need to estimate the population above 90 by single year of age.
Thatcher et. al. (2002) carried out an extensive evaluation of three methods and their several variants for estimating population at high ages from data on deaths. They can all use either information on deaths only for producing population estimates, or constrain the resulting population estimates to available external population estimates e.g. 90 or 90+. With help of the adjustable parameters or simple prorating, the constrained variants of the methods are able to reproduce external population 90 or 90+ exactly.
underestimate population and have larger errors, typically 5%–15%. As a result, the survivor ratio method SR(5,5,90+) (Thatcher et. al., 2002) has been incorporated into the methodology of two major resources on human mortality: Kannisto-Thatcher Database and Human Mortality Database.
Aggregating population in a lump sum above a certain age does not eliminate all data inaccuracies. Population in an open age group might be lower or more commonly higher than a true value. If the published total at ages 90+ is overstated, then the population estimates returned by the SR(5,5,90+) method for ages above 90 will be too high, the corresponding death rates will be too low, and time series of death rates will exhibit a sharp downward trend. An independent check for size of population 90+ is therefore needed.
Unconstrained variants tested by Thatcher et. al. (2002) might serve this purpose, but as noted by the authors, they tend to underestimate the observed population as mortality decline at advanced ages is not taken into account in both methods. The only method, MD(10), which addresses these problems, requires a long series of death rates which might not be available or be of doubtful quality, so this method has been excluded from consideration.
To overcome bias inherent in these two methods, a new procedure based on the Das Gupta’s method has been developed. This method incorporates population estimates at lower ages in order to produce an indirect estimate of rate of mortality decline, improving by this means the original method. Evaluation of performance of this method has been carried out on reliable data for several developed countries. Finally, this method has been applied to estimating the size of the 90+ U.S. population on 1 January 2000, for purposes of comparison with the 2000 census data. To facilitate application of this method, a numerical example and computer programs written in Matlab language (The MathWorks, 2004) are provided as well.
2. Das Gupta’s original method
declines in death rates are likely to be attributed to age misreporting in population and death data.
Migration at advanced ages is very low, and by taking advantage of this fact, alternative population estimates can be produced. If we need, for example, to estimate the population on January 1st, aged [x,x+1] in the year y, we can sum all deaths that occurred in the cohort y-x-1 after this date. In essence, this procedure constitutes a method of extinct generations proposed by Vincent (1951).
At the time Das Gupta was working on this problem, the death counts were only available for years 1980–88, so application of the extinct generation method was not possible, as cohorts aged 85 and over in the year 1980 were not extinct by January 1, 1989. Therefore he needed to estimate the population on January 1, 1989, which, in combination with deaths between 1980 and 1988, can produce population estimates for the year 1980.
This extension of the extinct cohort method is sometimes denoted as the almost extinct cohort method, as it does not rely entirely on deaths as proposed originally by Vincent (1951). Rather, it also incorporates population estimates at the end of the last year with available death data. Clearly, for any closed population, death rates for the entire period can be estimated from the population structure in the last year and deaths in the preceding years, provided there are no errors in the data.
Before constructing the new estimates, Das Gupta also made several adjustments to the raw data on deaths for the years 1980–1988 in attempt to correct for possible data errors. Firstly, he applied age-specific distribution of deaths available from Medicare data to all deaths above 70. The Medicare data are expected to provide more reliable pattern of death distribution at ages 70+ because of the legal requirement; the enrollees must provide proof of age at the time they enroll. He also converted Medicare data from “calendar age” to “age last birthday” by averaging two successive ages, distributed deaths with unknown age and sex-race attributes, and applied 3-year moving average smoothing to correct for possible age-heaping.
In order to compute the population on January 1, 1989, Das Gupta estimates the number of deaths which are still to come in the cohorts reaching age 85 and over in 1988. He does this by estimating vector of age-specific death ratios from observed data, and by applying them to the deaths in the last year to compute future deaths. By summing up deaths starting with the oldest population, estimates for 1989 are produced. As a next step he combines population estimates with deaths in the years 1980–1988 to produce population estimates at the time of the 1980 census. Finally, he adjusts population estimates by multiplying them by a constant factor for the totals at ages 85+ to agree with the corresponding totals in the U.S. census for each race-sex group.
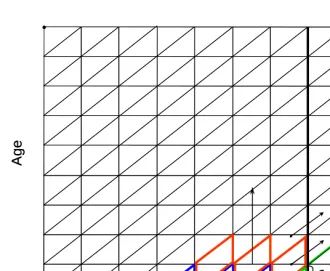
letDx,t−1 be deaths in the cohort c = t-x-2 in the year t-1 (single green vertical trapezoid in Fig. 1) and let nr be the n-years death ratio of deaths at age x+1 to deaths at age x x
in the cohort direction. Figure 1 shows computations of 3rx which is a ratio of deaths aggregated over the red area on Lexis diagram to those in the blue area (n=3):
∑
∑
= −− = − + = n i i t x n i i t x x n D D r 1 1 , 1 , 1 (1)Future deaths for the cohort c are estimated by applying estimated death ratios r x to the observed deaths at age x (green vertical trapezoids in Fig. 1):
1 , ,
1 −
+ t=n x xt
x rD
D
Finally, deaths are summed up to produce an estimate of population:
∑
= + +− + = ω 1 1 , , 1 i i t i x t x D Nwhere ω denotes the highest age with rx>0.
The procedure used here for computation of the death ratios nr and survivor x estimates differs in several respects from that which was originally described by Das Gupta. First, no adjustments have been applied to the raw data on deaths. Second, Das Gupta used deaths aggregated over cohorts and ages (horizontal trapezoids on Lexis diagram) while the death ratios computed here are based on deaths aggregated over cohorts and years (vertical trapezoids on Lexis diagram).
Furthermore, no estimation of future deaths is required. Indeed, if age-specific probability of dying (Note 1) is defined as follows
1 , 1 , 1 , − − − = t x t x t x N D
q (2)
and the odds of survival as
1 , 1 , 1 , 1 − − − − = t x t x t x q q
It is easy to show that Das Gupta’s procedure results in the following estimates for the odds
0 ),
1
( 1, 1 1, 1
1
,t− = x + x+ t− + t− =
x r u u
u ω (4)
and population
1 , 1 , ,
1 − −
+ t = xt xt
x D u
N (5)
Equations (2)–(5) demonstrate that despite computations of the future deaths in the original Das Gupta method, no projections of the future deaths are really made. Instead, the Das Gupta method relies on deaths observed in preceding years to produce an indirect estimate of death rates in the current year. In the following section implicit mortality assumptions underlying this estimation procedure are provided.
3. Implicit assumptions underlying the Das Gupta method
Bennett and Horiuchi (1981) derived a general relationship of the dynamics of closed populations which states that for a given year y population density at age x N(x) can be computed from deaths in this year D(x) and age specific growth rate of population
y y x N y
x
∂ ∂
= ln ( , )
) , (
ρ as
∫
∞
∫
=
x
du u
dt e
t D x N
t
x
) (
) ( ) (
ρ
(6)
These functions depend both on age and on time, but the time parameter y is omitted here and later on if no ambiguity is introduced. By definition mortality surface is equal to µ(x,y)=D(x,y)/N(x,y) and it follows immediately that ρ can be decomposed as
η ν
where y y x D ∂ ∂
= ln ( , )
ν , y y x ∂ ∂
= lnµ( , )
η represent the time rates of death and mortality
changes, respectively. Introducing two additional functions
0 ) , ( ln ) , ( = ∂ + + ∂ = u u u y u x D y x λ and x y x D y x ∂ ∂
= ln ( , )
) , (
θ for rates of change of death
density surface in cohort and age direction, respectively, yields
θ λ
ν = − (8)
Substituting (8) into (7), and (7) into (6) yields
∫
∞
∫
− − = x du u u u dt e t D x N t x ) ( ) ( ) ( ) ( ) ( η θ λ .Noting that =
∫
t x du u e x D t D ) ( ) ( ) ( θ
we finally obtain a relation between population and death density surfaces at the same age x (and time):
dt e x D x N x du u u t x
∫
∞∫
− = ) ( ) ( ) ( ) ( η λ (9)It follows from (9) that for computation of population from deaths at the same age, both )λ(x and η(x) functions are required. Suppose that death rates are stable in the
current year ( η(x)≡0 ) then Equ. (9) can be indeed approximated by
∏
∑
=∞ = + = i x j j x i x x DN (1 1λ ). In this case the quantity (1+1λj) corresponds to the Das
Gupta’s cohort death ratios. In other words population N can be indeed estimated by x
applying the cohort death ratios to the deaths D at the same age provided that the x
population is stable and we are able to estimate all quantities from real data without errors. This relation is precise as it follows from theoretical relations in closed populations.
bias is important for the application of this method because Kannisto (1994) showed that death rates at older ages have been declining over the past several decades. Implying that η =0 constitutes, hence the main source of bias in the original Das Gupta method.
Another way to look at Equ. (9) is to take the reciprocal of both parts and multiply them by D(x). This produces a relation between death and mortality surfaces:
dt e
x
x
du u u
t
x
∫
∞
∫
− =) ( ) (
1 )
(
η λ
µ (10)
Again, if η(x)≡0, then the period mortality can be estimated entirely from the observed cohort death ratios in the same year. Therefore Das Gupta’s death ratios include all the necessary information for producing an indirect estimate of death rates in the current year. This estimate is based though on the assumption that mortality is constant in the current year. If death rates were declining, mortality would be overestimated by this procedure. The value of bias depends on the magnitude of the rate of mortality decline.
In general case µ depends both on λ and η functions but the η is not known until the estimates of mortality are obtained. Therefore, information on deaths above age x is not sufficient to produce an estimate of death rates in a population with changing mortality because there is no data for estimating the rate of mortality change
η. This function can be only predicted by using some additional information. In the
method described below, this function η is predicted by using information on an
observed population at lower ages.
4. Method
The method proposed here is based on an empirical observation that rates of mortality improvement at advanced ages are declining over age (Fig. 2). For example, if death rates are declining by 2% at age 80, the rate of decline might be down to 1% at age 90 and maybe close to 0 at age 100. This suggests that the η(x) can be reasonably approximated by a linear function:
x x) 0 1
( β β
There is no compelling evidence on the functional forms of η as estimated from real data; it might be closer to exponential or logistic than to the linear form, but for our purposes such specification of η(x) appeared to be flexible enough to cope with the problems inherent in the original Das Gupta method.
Let us write Equ. (9) as N x D t dt
x
∫
∞ = () )
( * which can be recognized as the method
of extinct generations (D* - deaths still to come in the Das Gupta’s terminology). For any given t ratio of deaths at adjacent ages can be approximated by the product of two items: one is related to the observed death ratio in the current year and another to the unobserved rate of mortality improvement:
) ( ) ( ) ( ) ( * * 1 ) ( ) 1
( t t
du u u e e e t D t D t
t λ η
η λ − − ≅ = +
∫
+By taking (11) into account, Equ. (1) can be modified as follows
) ( * 0 1 x x0
x n x
nr = r e + −
β β
(12)
where nrx is obtained by (1) and x is the starting age of the 0 nrxsequence.
If N*x is a population estimate produced by using the modified death ratio sequence (12) and by applying equations (4), (5), and if P is the observed population x
at lower ages, then parameters β0,β1 can be estimated by minimizing the squared difference between two population series:
Find β0,β1 such as ( ) min
1 0 1 2 * → −
∑
+ = x x x x x NP (13)
For contemporary populations and ordinary annual conditions we would expect
0
β to be positive and equal approximately to the rate of mortality decline at age x0+1. Parameter β1 is expected to be negative to capture the age-specific pattern of mortality change over time.
information is usually readily available and expected to be of a better quality than that at the higher ages.
5. Performance evaluation
The proposed method (hereafter DA, Das Gupta Advanced) has been compared with the SR(5,5), DG(3) and DG(5) methods (Thatcher et. al., 2002) on data for ten populations over the 1980–1995 period. Death ratios have been estimated from deaths in four previous years (n=3), and population estimates at ages 81 to 89 have been used to estimate theβ's parameters. No information on the population at age 90 or above has been incorporated for producing survivor estimates. This variant of the DA method is designated hereafter as DA(3).
Data for all countries has been retrieved either from the Human Mortality Database or from the Kannisto-Thatcher database. Population estimates produced by all methods have been compared with the population estimates obtained by the extinct generation method, which is believed to provide the most reliable basis for comparison (Kannisto, 1994). This method relies entirely on death statistics, which is generally of better quality than population statistics; still its performance might deteriorate from age misreporting on death certificates (Rosenwaike, 1981; Preston, Elo and Stewart, 1999).
To rely on the extinct cohort population only, data until 1995 has been used despite the fact that data for almost all countries are available up to the year 2000 and later. Both databases that supplied data for this project rely on almost extinct generation methods for reconstructing a population at age 80 and over. By selecting the year 1995 as the last year in our comparisons, we can ensure that benchmark population is produced almost entirely by the extinct cohort method. Estimates of survivors of non-extinct cohorts, especially stemming from the postcensal population estimates, might be less reliable than the extinct cohort population estimates, so they have been deliberately excluded from the analysis.
For each calendar year, sex and country population at age 90 and over has been estimated by all methods included in comparisons, and compared with estimates
produced by the almost extinct cohort method. Relative errors 90 1 100%
90
⋅
− + +
extinct method
P P
by
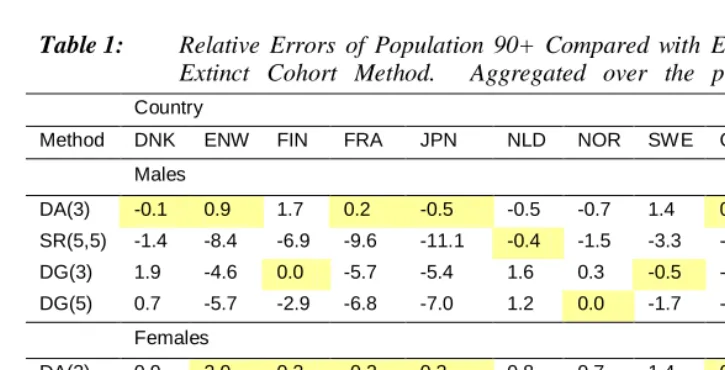
single calendar year are plotted in Figure 3 and overall totals for the entire period are provided in Table 1.
have been declining very rapidly over the last several decades and we would expect that the methods which are not taking the current rate of mortality improvement into account i.e. DG and SR, would produce significantly lower survivor estimates than the DA method, even at such extreme ages as 90 and over.
Indeed as it follows from Table 1, the total relative error is only 0.3% for the DA(3) method, while it is -16.8%, -10.1% and -11.9% for the SR(5,5), DG(3) and DG(5) methods, respectively. Such great underestimating of a population by ordinary methods is attributed to the extraordinary reductions in Japanese mortality.
For England and Wales, France and the United States, the DA(3) method also shows superior performance as compared to its competitors. Population estimates produced by this method differ usually by less than 5%, as compared to almost extinct cohort estimates with quite a few exceptions. The total relative errors are even lower: ranging from 2% for the female population of England and Wales to 0.2% for France.
For smaller countries (Denmark, Finland, the Netherlands, Norway, Sweden, and Switzerland) the results are less perfect. Variance in population estimates appears to be comparable with other methods and it is significantly higher than that for large countries. The method still produces good results but the difference between this method and others is not as marked as before.
A good sign is that the method does not introduce any constant bias into the estimates, suggesting that the main source of variation in population estimates is variation in the estimated cohort death ratios. For Sweden, for example, population estimates produced by the SR(5,5) method are always a few percent lower than the observed numbers (Fig. 3), while for the DA(3) they are hovering above and below the real values. Consequently, the total relative errors (Table 1) are -3.3% (-4.6%) for SR(5,5) and only 1.4% (1.4%) for the DA(3), for males and females, respectively. In overall, of all 20 populations analyzed, the total relative errors of the DA(3) method are less than 0.5% for 8 populations, between 0.5% and 1% for 6 populations, between 1%–2% for 5 populations, and above 2% for a single population only (Table 1). By taking row averages in Table 1, the DA average error is only 0.4% for males and 0.8 for females, the best value in both cases.
6. Application to the 2000 U.S. Census data
motivated by strong evidence of age overstatement in the oldest segment of the population in the 1980 census. An answer to the question whether the population 90+ can be incorporated into mortality estimates is therefore of crucial importance for investigating recent trends in the oldest-old mortality.
Table 0 includes results of the application of the DA method to the U.S. data. The method relies on the census population adjusted at the beginning of the year 2000 at ages 81–89, and on deaths at ages above 80 in the four preceding years. The deaths stem from an independent source: from the author’s tabulations of individual death certificates data compiled by the National Center of Health Statistics as described in the documentation on the U.S. database at www.mortality.org. The numerical example provided with this article includes original data for the U.S. females and intermediate results. An interested reader might explore it for details of computations.
Population of females on January 1, 2000 as estimated by the DA(3) method is nearly a perfect match both in population enumerated in the census and the census population adjusted at the beginning of the year 2000. The census and adjusted population are lower than the DA(3) population only by 0.04% and 0.17%, respectively. Such a high degree of correspondence between the estimates was completely unexpected.
The SR(5,5) method produced an estimate which is 4.4% higher than that of the DA(3) method. This is also surprising, as we would have expected that the SR estimates be generally lower than the observed numbers in populations with declining mortality. This might be a random variation but a more probable reason is that female death rates at the high ages were on the rise over the late 1990s. If death rates are increasing, the SR method will overestimate population instead of underestimating it, as in the case of declining mortality. Exploring estimates of the β's parameters of the DA(3) method lends more support to the latter point of view. The values β0= -0.0052 and β1= -0.00089 correspond to the case of increasing mortality (β0<0). It might not have been explicitly stated before, but it demonstrates that the DA method is capable of handling such cases as well.
In order to test the method on allegedly faulty data the method has been applied to check the 1980 census population. Recall that Das Gupta’s original research was motivated by some evidence of age overstatement in the 1980 census at ages above 85. For 1980 it was also possible to produce estimates by the extinct generation method, as now deaths are available up to the year 2000. The DA method incorporated extinct generation estimates at ages 81–89 for estimation of the β's parameters.
As it follows from Table 0 agreement between the DA(3) and extinct cohort estimates is good. The latter are only 3.2% lower for males and 0.7% lower for females than the DA(3) estimates. The census population appears to be significantly higher: 9.7% and 7.1%, while the SR(5,5) estimates are much lower: 15.4% and 19.5%, for males and females, respectively. The results confirm that the population in the 1980 census is significantly inflated at advanced ages, and demonstrate usefulness of the developed method.
The close agreement between the DA estimates and extinct cohort estimates might be influenced by the incorporation of the extinct cohort population into the DA method at ages 81–89. In order to gain more confidence in the inference regarding the 2000 census data, two additional checks have been carried out. First, a proportion of population 90+ in the total population has been compared with that observed in other countries at a time close to the year 2000 (Fig. 4). This figure indicates that the U.S. proportion does not appear as an outlier on this graph, suggesting that it is not inflated to some notable amount by age overstatement or some other data distortion mechanism.
Second, the population aged 80+ enumerated in the 1990 census has been adjusted to the time of the 2000 census by subtracting deaths between two census dates. If there are no errors in population counts, migration is negligible and death registration is accurate and complete, then agreement between the adjusted 1990 population and the 2000 census population should be very high. The 1990 census adjusted population appeared, however, to be 14% and 4% higher for males and females, respectively, than the population enumerated in the 2000 census. Obviously this does not provide any evidence that the population in 2000 is inflated. The differences are rather large and it seems they manifest that the population 80+ is overestimated in the 1990 census. By reducing the male population in 1990 by 2.2% and the female population by 0.9%, we can obtain a precise correspondence between the adjusted and observed population in 2000. Due to extremely fast tapering of population with age, these percentages are significantly lower than the percentages of disagreement between these two sets of estimates.
population above 90 is correct. The errors might mount as age increases, and there is some indication the numbers are inflated at the highest ages, typically above 100 or 105.
7. Summary and future enhancements
Estimation of death rates at advanced ages is often hampered by the lack of single age population up to the highest age attained. For many countries, for example, population above age 90 is aggregated in a single lump group: age 90 and over. To address such problems several methods of survivor estimates have been tested by Thatcher et. al. (2002). They arrived at the conclusion that the survivor ratio method aggregated over five cohorts and five years of age constrained to the population aged 90 and over (SR(5,5,90+)) is the most preferable one. Consequently, this method has been adapted for estimating population at advanced ages in two major resources on human mortality: Kannisto-Thatcher Database and Human Mortality Database.
The SR(5,5,90+) method relies on available population 90+, which quality is taken for granted. Evidence available from existing demographic data indicates that size of a population at very old ages is rather vulnerable to age misreporting errors. Commonly, data errors act in such a way that population at the highest ages is inflated. By incorporating an inflated population 90+ into the almost extinct cohort method the resulting population estimates would be too high and the resulting death rates would be too low. To improve quality of mortality estimates a method providing an independent estimate of population 90+ is required.
As shown above the methods currently available for addressing this problem are based on the assumption that the death rates are not changing in the year for which population estimates have to be produced. Applying such methods without proper constraints i.e. without incorporation of population aged 90+, will underestimate the current population which in turn will result in the flattening of trends in death rates at the end of the observation period. Therefore assumptions built into the methods will express themselves in the final mortality statistics and might influence inference regarding recent reductions in mortality at advanced ages.
data. In the applications of this method, for example, only deaths in four subsequent years and population estimates at ages 81–89 had been used.
To produce a population 90+ estimate, the DA method relies on an indirect estimate of death rates and on an indirect estimate of rates of mortality change over time. These estimates can be used on their own if one is more interested in producing mortality estimates entirely from data on deaths rather than in evaluating the quality of a population aged 90 and over. It should be stressed, however, that the method has been developed for very old ages only and assumptions incorporated into it (e.g. no migration and a specific pattern of mortality change) are not applicable for the entire age range. Being built on general relations in closed populations, this method is applicable to any geographical area e.g. states and regions but, as discussed below, its performance might be affected by small population sizes. In addition, migration at advanced ages cannot be completely ruled out on the state or regional level.
Further enhancements of this method will require addressing several issues. The most important are: a) variation in population estimates for countries with small populations, b) sensitivity to annual fluctuations in deaths, c) migration and d) cohort effects in population data.
The main source of variation in population estimates produced by the DA method is likely due to variation in estimates of death ratios. This is clearly more important for countries with small population sizes rather than for large countries. Trying different smoothing procedures (e.g. splines) for estimating nr might help to improve the x
population estimates.
Sensitivity of the DA method to annual fluctuations in deaths arises from applying the estimated death ratios to the deaths in the previous year for producing population estimates. The deaths in the last year might be abnormally high or abnormally low due to temporal mortality conditions (Thatcher, 1993). For example, the number of deaths in 1951 in England and Wales at ages 80 and over is approximately 11% higher than in 1950 and 1952. The original Das Gupta method would return highly inflated population estimates for 1952 if applied to such data because of inflated deaths in 1951. The SR(5,5), DG(3), DG(5) estimates of the population 90+ in 1952 returned values which are higher than extinct cohort estimates by 10%, 40% and 18%, respectively. On the other hand the DA(3) estimates were only 3% lower. Clearly, the DA estimates are closer to extinct cohort estimates, suggesting that the method is more robust to such annual fluctuations in deaths. More work is required, however, to explore the influence of abnormal mortality conditions on the performance of all methods.
be applicable anymore. Also, as life expectancy increases, people might stay healthier and more mobile up to ages higher than 80.
The last problem, cohort effects in population data, originates mostly from the fact that cohorts born during World War I are now entering the high ages, and we would expect large fluctuations in population numbers due to large fluctuations in births of respective cohorts. This problem might affect the performance of all methods and require further attention.
The list of the problems affecting performance of this method is by no means complete. Errors in the data used in computations e.g. misreporting in age at death, death underregistration, and errors in population at lower ages are likely to affect performance of this method in various ways. Additional work is required to address these issues properly.
Application of this method to the data on the United States suggests a high accuracy of size of population aged 90 and over, as enumerated in the 2000 census. An estimate produced by the DA method based on deaths and population at ages 81–89 is highly consistent with the population enumerated in the 2000 U.S. census. This test does not rule out, however, errors in a population in individual age groups above 90. Also, the size of the male population 90+ might be slightly overestimated.
8. Acknowledgments
Notes
1. This quantity differs from the customary life table q in a way that it refers to ages x
References
Bennett, Neil G. and Horiuchi, Shiro Estimating the Completeness of Death Registration in a Closed Population. Population Index. 1981; 47(2):207-21.
Coale, Ansley J. and Kisker, Ellen E. Mortality Crossovers: Reality or Bad Data? Population Studies. 1986; 40:389-401.
Coale, Ansley J. and Kisker, Ellen E. Defects in Data on Old-Age Mortality in the United States. Asian and Pacific Population Forum. 1990 Spring; 4(1):1-31.
Das Gupta, P. Reconstruction of the Age Distribution of the Extreme Aged in the 1980 Census by the Method of Extinct Generations. Washington, D.C. 20233: Population Division U.S. Bureau of the Census, 1990.
Elo, Irma T. and Preston, Samuel H. Estimating African-American Mortality from Inaccurate Data. Demography. 1994 Aug; 31(3):427-458.
Hill, Mark E.; Preston, Samuel H., and Rosenwaike, Ira Age Reporting among White Americans Aged 85+: Results of a Record Linkage Study. Demography. 2000 May; 37(2):175-86. ISSN: 0070-3370.
Human Mortality Database. University of California, Berkeley (USA), and Max Planck Institute for Demographic Research (Germany). Available online at www.mortality.org. Accessed 2004, January.
Kannisto, Väinö Development of Oldest-Old Mortality, 1950-1990: Evidence from 28 Developed Countries. Odense University: Odense University Press, 1994.
Kannisto, Väinö The Advancing Frontier of Survival: Life Tables for Old Age. Denmark: Odense University Press, 1996.
Kannisto-Thatcher Database. Max Planck Institute for Demographic Research (Germany). Online at www.demogr.mpg.de. Accessed 2004, January.
Preston, Samuel H.; Elo, Irma T., and Stewart, Quincy Effects of Age Misreporting on Mortality Estimates at Older Ages. Population Studies. 1999; (53):165-177.
Rosenwaike, Ira A Note on New Estimates of the Mortality of the Extreme Aged. Demography. 1981 May; 18(2):257-266.
Thatcher, Roger A.; Kannisto, Väinö and Andreev, Kirill F. The Survivor Ratio Method for Estimating Numbers at High Ages. Demographic Research. 2002; 6(1).
The MathWorks. MATLAB. The Language of Technical Computing. Online at www.mathworks.com. 2004.
Vincent, Paul. La Mortalité des Vieillards. Population. 1951; 6(2):181-204.
Figure 1: Illustration of the Das Gupta Method
t x
t x
N
+1,1 ,t− x
D
Ag
e
Years
x
r
3
t x
t x
N
+1,1 ,t− x
D
Ag
e
Years
x
r
-0.02 -0.01 0 0.01 0.02
80 85 90 95 100 105
Age
Ra
te
MALES
FEMALES
Figure 2: Age-Specific Schedule of Rate of Mortality Change Over Time,
1980–1995.
1980 1985 1990 1995 -25 -20 -15 -10 -5 0 5 10 15 20 25
Relative error, population 90 and over. Denmark, Males
Year R e la ti v e e rr o r, % DA(3) SR(5,5) DG(3) DG(5)
1980 1985 1990 1995
-25 -20 -15 -10 -5 0 5 10 15 20 25
Relative error, population 90 and over. Denmark, Females
Year Re la ti v e e rro r, % DA(3) SR(5,5) DG(3) DG(5)
1980 1985 1990 1995 -25 -20 -15 -10 -5 0 5 10 15 20 25
Relative error, population 90 and over. England and Wales, Males
Year R e la ti v e e rr o r, % DA(3) SR(5,5) DG(3) DG(5)
1980 1985 1990 1995
-25 -20 -15 -10 -5 0 5 10 15 20 25
Relative error, population 90 and over. England and Wales, Females
Year R e la ti v e e rr o r, % DA(3) SR(5,5) DG(3) DG(5)
1980 1985 1990 1995 -25 -20 -15 -10 -5 0 5 10 15 20 25
Relative error, population 90 and over. Finland, Males
Year R e la ti v e e rr o r, % DA(3) SR(5,5) DG(3) DG(5)
1980 1985 1990 1995
-25 -20 -15 -10 -5 0 5 10 15 20 25
Relative error, population 90 and over. Finland, Females
Year Re la ti v e e rro r, % DA(3) SR(5,5) DG(3) DG(5)
Figure 3: Comparisons of Size of Population 90+ Estimated by Various Methods
1980 1985 1990 1995 -25 -20 -15 -10 -5 0 5 10 15 20 25
Relative error, population 90 and over. France, Males
Year R e la ti v e e rr o r, % DA(3) SR(5,5) DG(3) DG(5)
1980 1985 1990 1995
-25 -20 -15 -10 -5 0 5 10 15 20 25
Relative error, population 90 and over. France, Females
Year R e la ti v e e rr o r, % DA(3) SR(5,5) DG(3) DG(5)
1980 1985 1990 1995
-25 -20 -15 -10 -5 0 5 10 15 20 25
Relative error, population 90 and over. Japan, Males
Year R e la ti v e e rr o r, % DA(3) SR(5,5) DG(3) DG(5)
1980 1985 1990 1995
-25 -20 -15 -10 -5 0 5 10 15 20 25
Relative error, population 90 and over. Japan, Females
Year R e la ti v e e rr o r, % DA(3) SR(5,5) DG(3) DG(5)
1980 1985 1990 1995
-25 -20 -15 -10 -5 0 5 10 15 20 25
Relative error, population 90 and over. Netherlands, Males
Year R e la ti v e e rr o r, % DA(3) SR(5,5) DG(3) DG(5)
1980 1985 1990 1995
-25 -20 -15 -10 -5 0 5 10 15 20 25
Relative error, population 90 and over. Netherlands, Females
Year R e la ti v e e rr o r, % DA(3) SR(5,5) DG(3) DG(5)
1980 1985 1990 1995 -25 -20 -15 -10 -5 0 5 10 15 20 25
Relative error, population 90 and over. Norway, Males
Year R e la ti v e e rr o r, % DA(3) SR(5,5) DG(3) DG(5)
1980 1985 1990 1995
-25 -20 -15 -10 -5 0 5 10 15 20 25
Relative error, population 90 and over. Norway, Females
Year R e la ti v e e rr o r, % DA(3) SR(5,5) DG(3) DG(5)
1980 1985 1990 1995
-25 -20 -15 -10 -5 0 5 10 15 20 25
Relative error, population 90 and over. Sweden, Males
Year R e la ti v e e rr o r, % DA(3) SR(5,5) DG(3) DG(5)
1980 1985 1990 1995
-25 -20 -15 -10 -5 0 5 10 15 20 25
Relative error, population 90 and over. Sweden, Females
Year R e la ti v e e rr o r, % DA(3) SR(5,5) DG(3) DG(5)
1980 1985 1990 1995
-25 -20 -15 -10 -5 0 5 10 15 20 25
Relative error, population 90 and over. Switzerland, Males
Year R e la ti v e e rr o r, % DA(3) SR(5,5) DG(3) DG(5)
1980 1985 1990 1995
-25 -20 -15 -10 -5 0 5 10 15 20 25
Relative error, population 90 and over. Switzerland, Females
Year R e la ti v e e rr o r, % DA(3) SR(5,5) DG(3) DG(5)
1980 1985 1990 1995 -25
-20 -15 -10 -5 0 5 10 15 20 25
Relative error, population 90 and over. United States, Males
Year
R
e
la
ti
v
e
e
rr
o
r,
%
DA(3) SR(5,5) DG(3) DG(5)
1980 1985 1990 1995
-25 -20 -15 -10 -5 0 5 10 15 20 25
Relative error, population 90 and over. United States, Females
Year
R
e
la
ti
v
e
e
rr
o
r,
%
DA(3) SR(5,5) DG(3) DG(5)
0.00 2,000.00 4,000.00 6,000.00 8,000.00 10,000.00 12,000.00
Au stri
a Can
ad a
Den ma
rk
En gla
nd an
d W ale
s Fin
lan d
Fra nce
Ge rm
an y (W
est) Ice
lan d
Ita ly
Ja pan
Nor wa
y Sw
ed en
Sw itze
rlan d
Th e N
eth erla
nds
Uni ted
Sta tes
P
ropo
rt
io
n *
1
,00
0,
0
0
0
Males Females
mean
Figure 4: Proportion of Population Aged 90 and over in the Total Population in
Table 1: Relative Errors of Population 90+ Compared with Estimates by Amost Extinct Cohort Method. Aggregated over the period 1980–1995.
Country
Method DNK ENW FIN FRA JPN NLD NOR SWE CHE USA Aver. Males
DA(3) -0.1 0.9 1.7 0.2 -0.5 -0.5 -0.7 1.4 0.3 1.1 0.4 SR(5,5) -1.4 -8.4 -6.9 -9.6 -11.1 -0.4 -1.5 -3.3 -6.8 -2.9 -5.2 DG(3) 1.9 -4.6 0.0 -5.7 -5.4 1.6 0.3 -0.5 -3.5 0.3 -1.6 DG(5) 0.7 -5.7 -2.9 -6.8 -7.0 1.2 0.0 -1.7 -4.4 -0.6 -2.7 Females
DA(3) 0.9 2.0 0.3 -0.2 0.3 0.8 0.7 1.4 0.2 1.4 0.8 SR(5,5) -4.5 -10.5 -4.8 -12.1 -16.8 -4.1 -4.5 -4.6 -9.6 -5.7 -7.7 DG(3) -0.3 -6.2 1.9 -7.2 -10.1 0.9 0.4 -1.4 -4.6 -1.4 -2.8 DG(5) -1.6 -7.5 -0.7 -8.5 -11.9 -0.4 -1.4 -2.2 -5.7 -2.7 -4.3 DNK – Denmark, ENW – England and Wales, FIN – Finland, FRA – France, JPN – Japan, NLD – the Netherlands, NOR – Norway,
SWE – Sweden, CHE – Switzerland, USA – United States.
Table 2: Comparing Population Estimates Produced by the DA(3) Method with
Population Enumerated in the U.S. 2000 and 1980 censuses.
Census 2000 Census 1980
Source Males %,
to DA Females %, to DA Males %,
to DA Females %, to DA Census 350,497 3.6% 1,099,272 0.0% 204,340 9.7% 515,525 7.1% Census
Adj. 346,913 2.6% 1,097,796 -0.2%
SR(5,5) 329,399 -2.6% 1,148,078 4.4% 157,605 -15.4% 387,196 -19.5%
Extinct 180,399 -3.2% 477,883 -0.7%
DA(3) 338,212 1,099,689 186,320 481,156
Numerical Example and Programs
This page contains embedded files with numerical example, programs and the data set:
Numerical Example (MS Excel 2002)
example.xls
Programs (Matlab V6.1 programming language) One archive file SESTDA.ZIP including: sestda.m
sestdaest.m sestdamin.m sestdamort.m sestdasurv.m
Data set (comma separated values) data.csv
If you have the PDF version of this paper (in an electronic form) you can extract a file by clicking on the corresponding paper clip with the right mouse and then selecting “Save Embedded File to Disk” from the popup menu: