Vulnerability assessment of surface water quality with an
innovative integrated multi-parameter water quality index
(IMWQI)
Sikder, M.T.1, 2, *, Tanaka, S.1, Saito, T.3, Hosokawa, T.4, Gumiri, S.5, Ardianor6, Uddin, M.K.7, Tareq, S.M.7, Shammi, M.7, Kamal, A.K.I.7, and Kurasaki, M.1
1
Graduate School of Environmental Science, Hokkaido University, Sapporo, Japan
2
Department of Public Health and Informatics, Jahangirnagar University, Dhaka, Bangladesh
3
Faculty of Health Sciences, Hokkaido University, Sapporo, Japan
4
Research Division for Higher Education, Hokkaido University, Sapporo, Japan
5
Agricultural Faculty of the University of Palangka Raya, Palangka Raya, Indonesia
6
University of PalangkaRaya, Palangka Raya, Indonesia
7
Department of Environmental Sciences, Jahangirnagar University, Dhaka, Bangladesh
Received: 1 Mar. 2015 Accepted: 15 May 2015
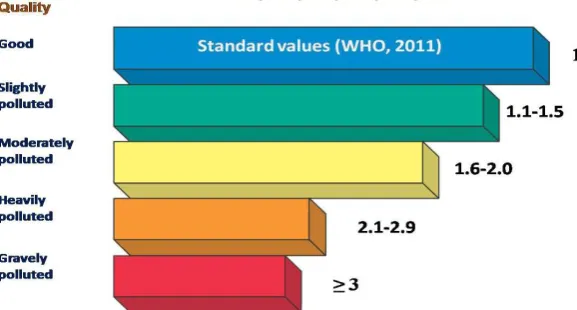
ABSTRACT: The development of a surface water evaluation index is a critical factor in the assessment, restoration and protection of stream water quality. Quantifying water pollution in specific grade using dominant parameters is important, as this can explain the current state of water pollution with accuracy. As a result, an integrated multi-parameter water quality index has been developed. It is based on the 10 most prevailing parameters (pH, conductivity, nitrate ions, phosphate ions, Escherichia coli number, cadmium, chromium, lead, copper and manganese) with a scale of 1 to 4, wherein the grades are classified into 1: good; 1.1-1.5: slightly polluted; 1.6-2.0: moderately polluted; 2.1-2.9: heavily polluted and 3.0-4.0: gravely polluted. The measuring stick used was according to the 2011 background values of the World Health Organization (WHO) in which a value of 0.1 was attributed for each, so that the final grade can be calculated. Water quality data were successfully fitted in an integrated multi-parameter water quality index to measure the river water level of pollution, and effectively represented every water bodies. This innovative index is able to quantify pollution with respect to seasons, geography and geomorphology of the respective rivers. Although operative, this index still lacks scientific integrity and as such, more synoptic experiments in the rivers of developing countries are recommended to attain a pragmatic feature.
Keywords: parameters, water pollution, water quality, water quality index.
INTRODUCTION
Water is an issue which "pervades society". It is critical for long-term economic development, social welfare, and environmental sustainability. In recent years, there has been an increase in
*
Corresponding authorE-mail: [email protected], [email protected]
awareness and concern about water pollution across the globe. Thus, new approaches towards achieving sustainable water resources management have been developed internationally.
complex set of pollution variables in the rivers, streams and lakes of both developed and developing countries. As such, an integrated multi-parameter water quality index (IMWQI) has been proposed in this study to quantify the pollution grade for river water.
Generally, WQI is a dimensionless number that combines multiple water quality factors into a single number by normalizing values to subjective rating curves and enabling easy interpretation of monitoring data (Miller et al., 1986). Conventionally, normalization of variables such as dissolved oxygen (DO), pH,
biological oxygen demand (BOD),
chemical oxygen demand (COD),
Escherichia coli (E. coli), temperature,
nutrients (nitrogen and phosphorus), etc., has been used for evaluating the quality of water separately, depending upon the designated water uses of the water body and local preferences (Chaturvedi and Bassin, 2010). In addition, the use of traditional approaches in the evaluation ofriver water quality are usually based on the comparison of the parameter values monitored with the local normative (Cude, 2001). The analysis, including one or few parameters grouped according to a common feature, may give partial information on the overall quality of water. The incorporation of many parameters into a single number is difficult via traditional approaches for grading the water quality of a watershed (Debels et al., 2005). Although mathematical-computational modeling of river water quality is useful for the assessment of the overall quality, the applications of the models were often restricted by the prerequisite knowledge of hydrodynamics and extensive validation (Rauch et al., 1998).
A variety of water quality indices have been designed to judge out the overall water quality within a particular area promptly and efficiently. Some examples of these are the US National Sanitation
Foundation Water Quality Index
(NSFWQI), Canadian Council of Ministers of the Environment Water Quality Index (CCMEWQI), British Columbia Water Quality Index (BCWQI) and Oregon Water Quality Index (OWQI) (Kannel et al., 2007; Lumb 2006; Khan et al., 2003). These techniques which were developed on various international regulatory standards, eventually give a single value to quantify
the overall water quality. The
aforementioned indices were full of controversies and lack certain integrity with respect to every purpose of their utilization. Public health concern along with the environmental impacts of pollution was not addressed in all cases. In addition, water quality assessment of a large number of samples, each containing concentrations for many parameters, is difficult in explaining polluted situations (Ongley, 1998; Debels et al., 2005; Rauch et al., 2005; Shanahan et al., 1998; Sanchez et al., 2005). However, only an integrated water quality index based on dominant parameters can provide a simple indication of water quality for every river with similar climatic and geographical background.
A protocol was developed to formulate the IMWQI and thus "a single number/parameter cannot tell the whole story of water quality. Nevertheless an index based on the dominant parameters is less controversial and widely acceptable". In an intensive literature review of surface water quality, it was found that a few parameters typically control the surface water quality by exerting potential harms to human health and environment. It was also found that the maximum ten parameters can superbly indicate the overall water quality. In this study, several
parameters were considered: pH,
conductivity, NO3-, PO43-, E. coli, Cd2+,
aquatic ecology. These parameters usually control the overall water quality of the rivers in Dhaka, Bangladesh and thus, the rivers of other developing countries. The WHO, 2011 background values were considered as the measuring stick and valued to 0.1 for each to calculate the final grade. This hypothetical index was structured with the seasonal data from the polluted Rivers of Dhaka, Bangladesh and Kalimantan, Indonesia. It deliberately excluded the frequently used water quality variable ‘dissolve oxygen’ to overcome the scientific arguments. In light of this, a new approach was proposed in this study in order to assess the level of water pollution in the major rivers of Dhaka, Bangladesh.
MATERIALS AND METHODS
In this study, sampling was conducted at the Buriganga River, Shitalakshyaa River, Turag River and the Bongshi River in Dhaka, Bangladesh on January (Sikder et al., 2013), August (Sikder et al., 2012) and November, 2011. These three seasons are characterized by dry, monsoon and post monsoon, respectively (Fig. 1). Dhaka is the capital of Bangladesh and its major rivers are influenced by agricultural activities and intensive urban sprawl such as residential, commercial and industrial establishments. Since not all industries employ wastewater treatment facilities, many of them discharge untreated wastewater into the river. The Buriganga River, one of the most polluted
rivers in Bangladesh, originates from the Dhaleshwari River with 27 km, 400 m and 10 m in length, width and depth, respectively. The Turag River joins the Buriganga River at Kamrangirchar in Dhaka. The Shitalakshyaa River links with the Buriganga on the northwestern side of the capital and is considered the second most polluted river in Bangladesh. Two sampling stations in each river with approximate distance of 2.5 km from each other were selected. The sampling stations are surrounded by identical residential areas preceded with industrial plantations and is rated to be highly polluted. The river water quality data from our previous study in Hokkaido and Osaka, Japan; Erdenet, Mongolia and West Java, Indonesia were reassessed and fitted into the IMWQI as control, in order to prove the index suitability.
During sampling, 500 ml sterilized containers with caps were used to collect water samples using the method of the
APHA-AWWA, 1998. Briefly, each
container was washed carefully with river water to remove any contaminants in the bottle before collecting water. Samples were then filtered using Millipore membrane filters (OmniporeTM, Ireland) with 0.45 µm pores. The filtrate was then stored in polystyrene bottles by acidification with concentrated nitric acid (AR grade; 60-61% with a density of 1.38 kg/L) to pH< 2 for metal analysis. Sampling bottles were kept at 4oC.
The physiochemical parameters (pH, conductivity, COD, NO2-, NO3- and PO43-) of
the samples were measured immediately at each sampling point with a U-51 multi-parameter water quality meter (HORIBA, Kyoto, Japan) and ion selective pack test (Kyoritsu Chemical-check Lab, Corp, Tokyo, Japan) according to the instruction manual. E. coli were measured with simple detection paper (Shibata, Japan) according to the instruction manual. Dissolved organic carbon (DOC) was measured with a TOC analyzer (TOC-5000A, Shimadzu, Kyoto, Japan). Thus, measurement of the physicochemical parameters and dissolved metals of the samples in each region were strictly controlled by a set of internal quality. Analytical quality control was assured by replicate analysis of samples. Generally, the three replicates of each sample were analyzed to ensure reliability of readings.
For the dissolved metal analysis, river water samples were filtered using Millipore membrane filters (OmniporeTM, Ireland) with 0.45 µm pores to remove the insoluble materials. Acid digestion with grade conc. HNO3 for 1.5 h was then followed. The
digested samples were transferred into a volumetric flask to analyse the metal ions with inductively coupled plasma–mass spectrometry (ICP-MS, Seiko SPQ-6500, Tokyo, Japan), using the specific measurement conditions for metals as described by Hanada et al. (1998). The concentrations of dissolved metals were detected at ng/ml (ppb) level (Sikder et al., 2013). Most metals were ionized at 80 to 95% efficiency and 1 ppb scandium (Sc), and indium (In) were used as internal standards. The concentration of the target
element can be determined from
comparison with the target's ion count and Sc or in ion count. The detection limits of ICP-MS were Al (0.005 ng/ml), Mn (0.03 ng/ml), Fe (0.005 ng/ml), Cr (0.03 ng/ml), Zn (0.05 ng/ml), Cu (0.005 ng/ml), Cd (0.03 ng/ml), and Pb (0.005 ng/ml). Standard solutions were prepared by
dilution of 1,000 mg/l stock solutions of different metals of interest (Wako Pure Chemicals Industries Ltd., Kyoto, Japan) with ultrapure water. The glassware was washed with nitric acid followed by distilled water. All the experiments were carried out in triplicate. The results were reproducible within an error limit of ±5%.
The Minitab Statistical software was used to process all data. The Multivariate analysis of variance (MANOVA) was used to determine if there were statistically
significant differences on the
physiochemical parameters and heavy metal loads of the water across the different sampling stations in the rivers of Dhaka. The significance level in this study was P<0.05.
RESULTS AND DISCUSSION
The results of the physicochemical analyses are presented in Tables 1 and 2. The pH values in the rivers of Bangladesh range from 7.13- 8.03 and were slightly affected by seasonal variation, whereas the water bodies in Kalimantan are extremely acidic in nature. High conductivity values ranging from 296-488 µS/cm were recorded in the rivers of Dhaka indicating high ionic pollution as compared with the water bodies of Kalimantan and the WHO guideline. In Dhaka, the Shitalakkha River had a conductivity value of 488 indicating that it is the most polluted river in Dhaka. The NO2- concentrations in all sampling stations
were below the WHO guideline whereas the NO3- values exceeded the WHO guideline
The results attained from the microbial study indicated that the microbial water quality in the rivers was not so good compared with the WHO guidelines. The effects of seasonal variation to every
parameter are shown in Table 2. It was evident that during winter, maximum pollution was observed in both the rivers of Dhaka, Bangladesh and Kalimantan, Indonesia.
Table 1. Physiochemical parameters in the major rivers of Dhaka, Bangladesh and Kalimantan, Indonesia
River/Canal pH Conductivity (µS/cm) (mg/l) COD NO2
-(mg/l) NO3
-(mg/l) PO4
3-(mg/l) (CFUE-colia/ml) (mg/l) DOC Bangladesh
Buriganga 7.13±0.20 344.27±241.04 26.92±11.53 0.10±0.04 0.78±0.20 1.03±0.85 227.67±55.10 6.87±1.82 Shitalakkha 7.54±0.46 488.58±519.32 56.42±55.33 0.04±0.02 2.30±2.12 0.74±0.51 171.67±33.29 21.14±18.82
Turagh 7.73±0.37 296.91±251.83 82.83±56.38 0.42±0.29 7.87±7.41 1.45±1.03 190.33±80.06 16.62±8.34 Bongshi 8.03±0.38 329.69±261.33 69.75±27.50 0.20±0.15 3.37±3.67 4.31±4.13 131.33±60.19 19.19±15.00
Indonesia
Sebangau 3.49±0.11 124.31 ± 98.72 83.75±20.32 0.44±0.35 3.73±1.34 2.48±0.16 186.19±37.03 30.46±8.28 Artificial
Canal 3.58±0.35 64.88±18.56 65.63± 3.26 0.08±0.01 1.39±1.12 1.93±1.26 200±21.21 51.30±6.16
WHOb 6.5-8.5 250 255 0.5 0.45 0.01 0 -
Notes: Values are Mean ± Standard Deviation a Colony Forming Unit
b World Health Organization (2011)
-= Not known.
Table 2. Seasonal variation of parameters (mean value) in the rivers of both Dhaka, Bangladesh and Kalimantan, Indonesia
pH Conductivity (µS/cm) (mg/L) COD (mg/L) NO2- (mg/L) NO3- (mg/L) PO43- (CFUE-colia/mL) (mg/L) DOC
Buriganga River
Dry 7.28 619.5 40 0.11 0.6 1.75 288 8.5 Monsoon 6.9 170.8 18.25 0.05 1 0.1 180 4.9 Post monsoon 7.2 242.5 22.5 0.12 0.75 1.25 215 7.2
Shitalakkha River
Dry 8.07 1087.5 120 0.06 1 1.07 180 42 Monsoon 7.25 163.25 19.25 0.04 1.15 0.15 135 5.43 Post monsoon 7.3 215 30 0.03 4.75 1 200 16
Turag River
Dry 7.44 579.5 35 0.1 1.5 1.75 280 7 Monsoon 8.15 96.23 68.5 0.66 6.1 2.3 126 21.93 Post monsoon 7.6 215 145 0.5 16 0.3 165 20.92
Bongshi River
Dry 7.72 618.5 42.5 0.02 1 1.22 198 6 Monsoon 8.45 109.56 69.25 0.28 7.6 2.7 81 16.05 Post monsoon 7.9 261 97.5 0.3 1.5 9 115 35.5
Sebangau River
Dry 3.40 194.12 69.37 0.70 4.68 2.36 212.37 24.60 Rainy 3.56 54.5 98.12 0.19 2.78 2.59 160 36.31
Artificial Canal
Dry 3.82 78 56.25 0.08 2.18 2.82 215 55.65 Rainy 3.33 51.75 75 0.07 0.6 1.03 185 46.94
The mean total concentrations of Mn, Fe, Cu, Zn, Cd, Cr and Pb were 46.85, 80.58, 16.58, 10.09, 4.74, 43.62 and 4.14 ng/ml, respectively in Shitalakkha River. However, compared with the rivers of Buriganga, Turaga and Bongshi (Table 3), Shitalakkha River was found to be the most polluted river in Bangladesh. In case of Mn and Cd, all rivers in Bangladesh showed elevated concentrations as a result of the industrial sources in the city of Dhaka. The toxic heavy metal Cr exceeded the recommended level in both Buriganga and Turag River, as these two rivers received tremendous amounts of untreated tannery effluents containing elevated levels of Cr every day.. In case of Sebangu River, Indonesia, Mn, Cd, Cr and Pb encompass
the major toxic heavy metals present beyond the recommended level of WHO. Thus, it is considered as one of the most polluted river in Kalimantan, Indonesia. The enrichment factor (EF%) of different metals was calculated from the mean value of each region to estimate both natural and anthropogenic metal sources in relation to the tendency to accumulate in river sediments (Sikder et al., 2012). Surprisingly, the EF% of Mn, Fe, Cu, Zn, Cd, Cr and Pb in the rivers of Dhaka, Bangladesh were 36.33, 17.96, 20.73,
12.41, 20.91, 28.92 and 34.09,
respectively. On the other hand, the water bodies of Kalimantan, Indonesia were given comparatively higher percentage EF% for heavy metals.
Table 3. Metal concentration in the major rivers of Dhaka, Bangladesh and Kalimantan, Indonesia
River/
Canal Mn (ng/ml) Fe (ng/ml) Cu (ng/ml) Zn (ng/ml) (ng/ml) Cd Cr (ng/ml) Pb (ng/ml) Bangladesh
Buriganga 19.69±11.72 20.70±11.41 4.24±1.92 13.45±18.36 4.25±1.36 53.38±22.93 3.82±0.82 Shitalakkha 46.85±42.10 80.58±63.58 16.58±14.35 10.09±13.31 4.74±1.28 43.62±9.04 4.14±0.82 Turagh 31.67±32.57 22.45±17.93 11.94±7.61 31.53±49.77 4.25±1.34 55.14±36.53 4.52±0.34 Bongshi 46.52±47.07 68.37±58.91 13.64±10.44 27.72±23.25 4.59±1.80 37.04±16.17 5.46±1.91
Indonesia
Sebangau 32.97±2.82 - 43.42±2.94 - 3.64±0.95 86.42±14.36 16.59±5.02 Artificial
Canal 8.69±1.41 - 16.2±12.02 - 3.45±0.38 41.74±4.93 9.29±2.06
WHOa 10 50 2000 3000 3 50 10
Notes: Values are Mean ± Standard Deviation. a World Health Organization (2011).
-= Not measured.
The metal concentrations in the rainy season are generally lower than that of the dry season (Fig. 2 (a-f)). This can be attributed to the dilution of metal ions present in the rivers during the wet season. Generally, the Mn concentrations in water samples from all rivers were significantly higher than any values for other metals for all seasons. This may be attributed to the
Fig. 2. Seasonal variation of toxic heavy metals in the water bodies of both Dhaka, Bangladesh and Kalimantan, Indonesia, (a) Buriganga River; (b) Shitalakshyaa River; (c) Turag River; (d) Bongshi River; (e) Sebangau River
and (f) Artificial Canal
Fundamentally, WQI has been
recommended as a simple method to overcome many limitations mentioned in the global water quality. The index is a mathematical number, which is calculated from the transformation of a large quantity of water characterization data into water quality levels (Somlyody et al., 1998). A WQI value does not only provide a simple and reasonable profile of water quality for the public and decision makers to understand easily, but also provides a spatial and temporal trend of water quality (Cude, 2001). In this study, a new IMWQI is proposed to convert complex water quality data into information that is understandable and useable, especially in
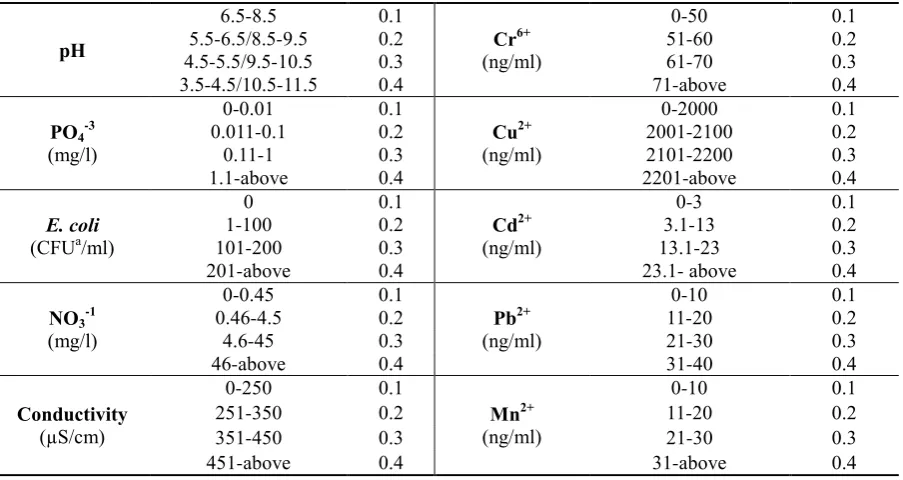
Table 4. Distribution of values to the dominant parameters at their different range of affecting aquatic environment and human health
pH
6.5-8.5 0.1
Cr6+
(ng/ml)
0-50 0.1
5.5-6.5/8.5-9.5 0.2 51-60 0.2
4.5-5.5/9.5-10.5 0.3 61-70 0.3
3.5-4.5/10.5-11.5 0.4 71-above 0.4
PO4-3
(mg/l)
0-0.01 0.1
Cu2+
(ng/ml)
0-2000 0.1
0.011-0.1 0.2 2001-2100 0.2
0.11-1 0.3 2101-2200 0.3
1.1-above 0.4 2201-above 0.4
E. coli
(CFUa/ml)
0 0.1
Cd2+
(ng/ml)
0-3 0.1
1-100 0.2 3.1-13 0.2
101-200 0.3 13.1-23 0.3
201-above 0.4 23.1- above 0.4
NO3-1
(mg/l)
0-0.45 0.1
Pb2+
(ng/ml)
0-10 0.1
0.46-4.5 0.2 11-20 0.2
4.6-45 0.3 21-30 0.3
46-above 0.4 31-40 0.4
Conductivity
(µS/cm)
0-250 0.1
Mn2+
(ng/ml)
0-10 0.1
251-350 0.2 11-20 0.2
351-450 0.3 21-30 0.3
451-above 0.4 31-above 0.4
The distribution of these values was fixed by identifying the sequential impacts of pH (Alan et al., 1976; Susan and
Russell, 2000; Handschuh, 2007;
Schwalfenberg, 2012; Anton et al., 2013), conductivity (Burgard, 2014; Calderon and Hunter, 2009; WSU and WDOE, 1995; Combs and Nielsen, 2009; WHO, 2009), NO2- (WHO, 2011; Sigler and Bauder,
2007; Fan and Steinberg, 1996;
Manassaram et al., 2006; Ward et al., 2006), PO43- (Miettinen et al., 1997;
Montgomery and Elimelech, 2007; Sims et al., 1998; Tchobanoglous et al., 1991; Carpenter et al., 1998), E. coli (Pruss, 1998; Fong and Lipp, 2005; Hundesa et al., 2006; Hammerum and Heuer, 2009; Edberg, 2000), Cd2+(Jarup et al., 1998; Wigle, 2003; Jarup, 2003; Kavcar et al., 2009; Pan et al., 2010),Cr6+(Ma et al., 2007; Paustenbach et al., 1991; Smith and Steinmaus, 2009; Zhitkovich, 2011; Costa and Klein, 2006), Pb2+(Emmanuel et al., 2007; Yang et al., 2004; WHO, 2006; Hsu and Guo, 2002; Papanikolaou et al., 2005), Cu2+ (Zietz et al., 2003; Pizarro et al., 1999; Gaetkeand Chow, 2003; Tapiero et
al., 2003; Ozcelik and Uzun, 2009) and Mn2+ (Kondakis et al., 1999; Woolf et al., 2002; Crossgrove and Zheng, 2004; Mergler et al., 1998; Mergler et al., 2004) on human health and environment (Table 4). Every parameter was divided into four sets according to the impacts they induced on health and environment and every set holds 10 times impact from the immediate next set. The basis for the classification of every parameter was its ability to evaluate water pollution with precision. In addition, every set has a value of 0.1. For example, in the case of PO43-, the recommended
value (0- 0.01 mg/l) is 0.1; for the next set (0.011- 0.1 mg/l), the IMWQI has additional 0.1 and thus the total value is 0.2; for 0.11- 1 mg/l, the total value is 0.3; and for 1.1 mg/l and above concentration of PO43-, the total value is 0.4. Other than
PO43-, the rest of the 9 parameters were
ng/ml form an impact class have 0.1 index value and a total value of 0.2. Subsequently, 10 ng/ml (13.1-23.0 ng/ml) forms the third impact class having total value of 0.3 and, 23.1 ng/ml and above forms the last impact category having a total value of 0.4. The same method was applied for Cr6+, Pb2+ and Mn2+. However, for Cu2+, the range in every class was considered 100 ng/ml after 2000 ng/ml. The reason for such classifications for each parameter is attributed to the grade of representative impacts. The changes of
range in each parameter of the index were also investigated by the same river water quality data where the exact pollution scenario was not found (data not shown). Furthermore, the index number must be laid within 1-4. The index was designed on a scale of 1 to 4 where the grades are classified into 1: good; 1.1-15: slightly polluted; 1.6-2.0: moderately polluted; 2.1-2.9: heavily polluted and 3.0-4.0: gravely polluted (Fig. 3). A typical example is given to fit the water quality parameters into this index (Table 5).
Table 5. Example of fitting water quality data into the IMQWI
Parameters pH NO3
-(mg/L) PO4
3-(mg/L) Cond. (µS/cm)
E-coli (CFU/mL)
Cd (µg/L)
Cr (µg/L)
Pb (µg/L)
Cu (µg/L)
Mn
(µg/L) Grade Index
WHO-2011 6.5-8.5 0.45 0.01 250 0 3 50 10 2000 10
Good
Designated value 0.1 0.1 0.1 0.1 0.1 0.1 0.1 0.1 0.1 0.1 1
Sebangau River 3.49 3.73 2.48 124.41 186 3.64 86.42 16.59 43.42 32.97 Heavily
polluted
Owned value 0.4 0.2 0.4 0.1 0.3 0.2 0.4 0.2 0.1 0.4 2.7
*Ishikari River 7.6 1 0.05 80 11 2 15 2.23 9.79 13.09 Slightly
Polluted
Owned value 0.1 0.2 0.2 0.1 0.2 0.1 0.1 0.1 0.1 0.2 1.4
* (Sikder et al. 2013)
The mathematical expression of this proposed index can be formulated as follows-
IMWQI=∑_(h=1)^10▒i_h or
IMWQI= i_1+i_2+⋯+i_10
where i_h is the designated value for the hth parameter (h=1,2,…,10), which lies between 0.1 to 0.4. Therefore, the summation of 10 parameter’s designated pollution value is the overall pollution of any specific water body.
To determine the pollution grade, the quality of river water was analyzed. The water quality data of Buriganga River, Shitalakshyaa River, Turag River and the Bongshi River in Dhaka, Bangladesh and the Sebangau River and Artificial Canal in Kalimantan, Indonesia were fitted into this index. All rivers in both Dhaka, Bangladesh and Kalimantan, Indonesia were within the range of 2.1- 2.7, indicating heavy pollution. While Turag River was found to be the most polluted river in Bangladesh, the Sebangau River was revealed to be the most polluted among all sampled rivers. The Buriganga, Bongshi and Shitalakshyaa River were
found to be close to heavily polluted (2.1, 2.1 and 2.2, respectively) by fitting the data into this index (Fig. 4a). The artificial canal in Kalimantan, Indonesia got a low index of 2, indicating a moderately polluted water body. The recent shift of industrial belt from the bank of Buriganga to Shitalakshyaa and Turag River resulted to these two rivers having the highest level of pollution. Furthermore, two export processing zones (EPZs) were recently established beside these rivers, severely threatening the water quality. The results from the general water quality along the heavy metals also support these findings.
Fig. 4. Measurement of pollution level with the IMWQI, (a) comparison of pollution level among the water bodies and (b) seasonal variation of pollution level among the water bodies
The river water quality data were also fitted into the index in terms of seasons. The highest level of pollution was seen in the rivers of both Bangladesh and Indonesia in the dry season. Moreover, during the dry season, Sebangau River had an index value of 2.9, which is extremely close to the highest level of the gravely polluted index. In Bangladesh, the Buriganga and Turag Rivers are the most polluted rivers during the dry season, whereas all rivers except the Sebangau River got moderate pollution during monsoon (1.5- 2.0). The pollution level showed an increasing trend during the post monsoon season in all studied water bodies. In the rainy season, the pollution grade of Buriganga River lowered to a
River, Japan was also in line with this index, where the index value represented the exact water quality of this river (Table 5) (Sikder et al., 2013). Therefore, it can be stated that this new index can be used to quantify the general water pollution on regional basis.
CONCLUSION
IMWQI is a useful method for the classification of water quality based on scientific criteria. The IMWQI is effectively applicable for the assessment of spatial and temporal variations of global water quality. The results obtained were easy to understand for the non-scientific public and decision-makers. Moreover, the evaluation of IMWQI is suitable for the water quality assessments and in the development of pollution control strategies in developing countries. In addition, this innovative index can be used to quantify general water pollution on regional basis. Although operative, this index still lacks scientific integrity, and as such, more synoptic experiments in the rivers of developing countries are recommended in order to attain a pragmatic feature.
ACKNOWLEDGEMENTS
The research was supported by JST-JICA Project: Wild Fire and Carbon Management in Peat-land Forest, Indonesia and the JSPS-UGC Joint Research Project for FY between Bangladesh and Japan for Tanaka.
CONFLICT OF INTEREST
The authors have no conflict of interest.
REFERENCES
Alan, A.S., Clois, J.S., Dennis, R.S., Gordon, G.R. (1976). Chlorination of Organics in Drinking Water. American Water Works Assoc., 68, 615-620. Anton, S.D., Lu, X., Bank, G., Heekin, K., Saha, D., Pamela, J.D., Hausenblas, H.A. (2013). Effect of a novel dietary supplement on pH levels of healthy volunteers: a pilot study. J Integr Med., 11, 384– 388.
APHA-AWWA (American Public Health Association–American Water Works Association).
(1998). Standard Methods for the Examination of Water and Wastewater, 20th ed. section 3120. Burgard, D.J. (2014). White Paper on Total Dissolved Solids in Food Processing Wastewater Beneficial Agricultural Reuse. Cascade Earth Sciences, Spokane, Washington, USA.
Calderon, P., Hunter, P. (2009). Epidemiological studies and the association of cardiovascular disease risks with water hardness, Ch 10. In: WHO, 2009. Calcium and magnesium in drinking water: Public health significance. World Health Organization, Geneva, Switzerland, 194.
Carpenter, S.R., Caraco, N.F.,Correll, D.L., Howarth, R.W., Sharpley, A.N., Smith, V.H. (1998). Nonpoint pollution of surface waters with phosphorus and nitrogen. EcolAppl., 8, 559-568. Chaturvedi, M.K., Bassin, J.K. (2010). Assessing the water quality index of water treatment plant and bore wells, in Delhi, India. Environ Monit Assess., 163, 449-453.
Combs, G.F., Nielsen, F.H. (2009). Health significance of calcium and magnesium: Examples from human studies, Ch 8. In: WHO, 2009. Calcium and magnesium in drinking water: Public health significance. World Health Organization, Geneva, Switzerland, 194.
Costa, M., Klein, C.B. (2006).Toxicity and carcinogenicity of chromium compounds in humans.CRC Crit Rev Toxicol., 36, 155-163. Crossgrove, J., Zheng, W. (2004). Manganese toxicity upon overexposure.NMR Biomed., 17, 544-553.
Cude, C.G. (2001). Oregon water quality index: A tool for evaluating water quality management effectiveness. J Am Water Resour Assoc., 37, 125-137. Debels, P., Figueroa, R., Urrutia, R., Barra, R., Niell, X. (2005). Evaluation of water quality in the Chillan River (Central Chile) using physicochemical parameters and a modified Water Quality Index. Environ Monit. Assess., 110, 301-322.
Edberg, S., Rice, E.W., Karlin, R.J., Allen, M.J. (2000). Escherichia coli: the best biological drinking water indicator for public health protection. J Appl Microbiol., 88, 106-116.
Emmanuel, E., Angerville, R., Joseph, O., Perrodin, Y. (2007). Human health risk assessment of lead in drinking water: a case study from Port-au-Prince, Haiti. Int J Environ Pollut., 31, 280-291.
reproductive and developmental toxicity. Regul Toxicol Pharmacol., 23, 35-43.
Fong, T.T., Lipp, E.K. (2005). Enteric viruses of humans and animals in aquatic environments: health risks, detection, and potential water quality assessment tools. Microbiol Mol Biol Rev., 69, 357-371.
Gaetke, L.M., Chow, C.K. (2003). Copper toxicity, oxidative stress, and antioxidant nutrients.Toxicology, 189, 147-163.
Hammerum, A.M., Heuer, O.E. (2009). Human health hazards from antimicrobial-resistant Escherichia coli of animal origin. Clinl Infect Dis., 48, 916-921.
Hanada, T., Isobe, H., Saito, T., Ogura, S., Takekawa, H., Yamazaki, K., Tokuchi, Y., Kawakami, Y. (1998). Intracellular accumulation of thallium as a marker of cisplatin cytotoxicity in nonsmall cell lung carcinoma. Cancer, 83, 930-935. Handschuh, H. (2007). Acid-Base Balance: Indispensable for Our Metabolism. Cell Chem., 133, 1-7.
Hsu, P.C., Guo, Y.L. (2002). Antioxidant nutrients and lead toxicity.Toxicology, 180, 33-44.
Hundesa, A., Carlos, M.M., Silvia, B., Nestor, A.G., Rosina, G. (2006). Identification of Human and Animal Adenoviruses and Polyomaviruses for Determination of Sources of Fecal Contamination in the Environment.Appl Environ Microbiol., 72, 7886-7893.
Järup, L. (2003). Hazards of heavy metal contamination.Br Med Bull., 68, 167-182.
Järup, L., Berglund, M., Elinder, C.G., Nordberg, G., Vanter, M. (1998). Health effects of cadmium exposure–a review of the literature and a risk estimate. Scand JWorkEnvHealth, 1, 1-51.
Kannel, P.R., Lee, S., Lee, Y.S., Kanel, S.R., Khan, S.P. (2007). Application of water quality indices and dissolved oxygen as indicators for river water classification and urban impact assessment. Environ Monit Assess., 132, 93–110.
Kavcar, P., Sofuoglu, A., Sofuoglu, S.C. (2009). A health risk assessment for exposure to trace metals via drinking water ingestion pathway.Int J HygEnv Health, 212, 216-227.
Khan, F., Husain, T., Lumb, A. (2003). Water quality evaluation and trend analysis in selected watersheds of the Atlantic region of Canada.Environ Monit Assess.,88,221–242.
Kondakis, X.G., Makris, N., Leotsinidis, M., Prinou, M., Papapetropoulos, T. (1989). Possible
health effects of high manganese concentration in drinking water. Arch Environ Health, 44, 175-178. Lumb, A., Halliwell, D., Sharma, T. (2002, Oct. 21– 23). Canadian water quality index to monitor the changes in water quality in the Mackenzie River– Great Bear.(In: Proceedings of the 29th Annual Aquatic Toxicity Workshop, Whistler, B.C., Canada).
Ma, H.W., Hung, M.L., Chen, P.C. (2007). A systemic health risk assessment for the chromium cycle in Taiwan.Environ Int., 33, 206-218.
Manassaram, D.M., Backer, L.C., Moll, D.M. (2006). A review of nitrates in drinking water: maternal exposure and adverse reproductive and developmental outcomes. Environ Health Perspect., 114, 320-327.
Mergler, D., Baldwin, M., Belanger, S., Larribe, F., Beuter, A., Bowler, R., Hudnell, K. (1998). Manganese neurotoxicity, a continuum of dysfunction: results from a community based study. Neurotoxicology, 20, 327-342.
Mergler, D., Huel, G., Bowler, R., Iregren, A., Belanger, S., Baldwin, M., Martin, L. (1994). Nervous system dysfunction among workers with long-term exposure to manganese.Environ Res., 64, 151-180.
Miettinen, I.T., Vartiainen, T., Martikainen, P.J. (1997). Phosphorus and bacterial growth in drinking water.Appl Environ Microbiol., 63, 3242-3245. Miller, W., Joung, H.M., Mahannah, C.N., Garrett, J.R. (1986). Identification of water quality differences Nevada through index application. J. Environmental Quality, 15, 265-272.
Montgomery, M.A., Elimelech, M. (2007). Water and sanitation in developing Countries: including Health in the equation. EnvSc Technol., 41, 17-24. Ongley, E. (1998). Modernization of water quality programs in developing countries: issues of relevancy and cost efficiency. Water Quality International, Sept/Oct-1998, 37-42.
Ozcelik, D., Uzun, H. (2009). Copper intoxication; antioxidant defenses and oxidative damage in rat brain. BiolTrace Elem Res., 127, 45-52.
Pan, J., Plant, J.A., Voulvoulis, N., Oates, C.J., Ihlenfeld, C. (2010). Cadmium levels in Europe: implications for human health. Environ Geochem Health, 32, 1-12.
Paustenbach, D.J., Meyer, D.M., Sheehan, P.J., Lau, V. (1991). An assessment and quantitative uncertainty analysis of the health risks to workers exposed to chromium contaminated soils. ToxicolIndHealth, 7, 159-196.
Pizarro, F., Olivares, M., Uauy, R., Contreras, P., Rebelo, A., Gidi, V. (1999).Acute gastrointestinal effects of graded levels of copper in drinking water.Environ Health Perspect.,107, 117-121. Prüss, A. (1998). Review of epidemiological studies on health effects from exposure to recreational water. Int JEpidemiol., 27, 1-9.
Rauch, W., Henze, M., Koncsos, L., Reichert, P., Shanahan, P., Somlyody, L., Vanrolleghem, L. (1998). River water quality modelling: I. State of the art. Water Sci Technol., 38, 237-244.
Sanchez, E., Colmenarejo, M.F., Vicente, J., Rubio, A., Garcia, M.G.., Travieso, L., Borja, R. (2007). Use of the water quality index and dissolved oxygen deficit as simple indicators of watersheds pollution.Ecol Indices., 7, 315-328.
Schwalfenberg, G.K. (2012).The alkaline diet: is there evidence that an alkaline pH diet benefits health. J Environ Public Health, 2012, 1-7. doi: 10.1155/2012/727630.
Shanahan, P., Henze, M., Koncsos, L., Rauch, W., Reichert, P., Somlyody, L., Vanrolleghem, P. (1998). River water quality modeling: II. Problems of the art. Water Sci Technol., 38, 245-252.
Sigler, W.A., Bauder, J. (2007). Nitrate/Nitrite Fact SheetExtension Water Quality Program, Department of Land Resources and Environmental Sciences, Montana State University.
Sikder, M.T., Kihara, Y., Yasuda, M., Yustiawati, Mihara, Y., Tanaka, S., Odgerel, D., Mijiddorj, B., Syawal, S.M., Hosokawa, T., Saito, T., Kurasaki, M. (2013). River Water Pollution in Developed and Developing Countries: Judge and Assessment of Physicochemical Characteristics and Selected Dissolved Metal Concentration. Clean: Soil Air Water, 41, 60-68.
Sikder, M.T., Yasuda, M., Yustiawati, Syawal, S.M., Saito, T., Tanaka, S., Kurasaki, M.(2012).Comparative Assessment of Water Quality in the Major Rivers of Dhaka and West Java.Int J Environ Prot., 2, 8-13.
Sims, J.T., Simard, R.R., Joern, B.C. (1998). Phosphorus Loss in Agricultural Drainage: Historical Perspective and Current Research. J Environ Qual., 27, 277–293.
Smith, A.H., Steinmaus, C.M. (2009). Health effects of arsenic and chromium in drinking water:
recent human findings. AnnuRev Public Health,30, 107.
Somlyody, L., Henze, M., Koncsos, L., Rauch, W., Reichert, P., Shanahan, P., Vanrolleghem, P. (1998). River water quality modelling: III. Future of the art. Water Sci Technol., 38, 253-260.
Susan, E.B., Russell, J. (2000).Acid-Alkaline Balance and Its Effect on Bone Health. International Journal of Integr Med., 2, 1-12.
Tapiero, H., Townsend, D.M., Tew, K.D. (2003). Trace elements in human physiology and pathology; Copper.Biomed Pharmacother., 57, 386-398.
Tchobanoglous, G., Burton, F.L., Stensel, H.D. (1991).Wastewater Engineering Treatment and Reuse.Metcalf & Eddy, Inc. 4th edn. Management, 7, 1-4.
Ward, M.H., Cerhan, J.R., Colt, J.S., Hartge, P. (2006). Risk of non-Hodgkin lymphoma and nitrate and nitrite from drinking water and diet. Epidemiology, 17, 375-382.
WHO (World Health Organization) (2006). Guidelines for drinking-water quality: First addendum to volume 1,World Health Organization, Geneva.
WHO (World Health Organization) (2009).Calcium and magnesium in drinking-water: public health significance. Cotruvo J, Bartram J, edn. World Health Organization, Geneva.
WHO (World Health Organization) (2011). Nitrate and nitrite in drinking-water; Background document for development of WHO Guidelines for Drinking-water Quality, World Health Organization, Geneva. WHO (World Health Organization) (2011). Guidelines for drinking water quality-1, recommendations, 4th ed.: World Health Organization, Geneva.
Wigle, D.T. (2003).Child health and the environment.(Oxford University Press).
Woolf, A., Wright, R., Amarasiriwardena, C., Bellinger, D. (2002). A child with chronic manganese exposure from drinking water.Environ Health Perspect.,110, 613.
WSU and WDOE (1995). Irrigation Management Practices to Protect Groundwater and Surface Water Quality. Washington Department of Ecology and Washington State University.Olympia, WA and Pullman, Washington.
Lead/Zinc Mine, Guangdong, China. Environ Int., 30, 883-889.
Zhitkovich, A. (2011). Chromium in drinking water: sources, metabolism, and cancer risks. ChemRes Toxicol.,24, 1617-1629.