85
Bedload transport predictions based on field measurement data
by combination of artificial neural network and genetic
programming
Sirdari, Z.Z.1*, Ab Ghani, A.1, and Sirdari, N.Z.2
1
REDAC, Universit of Sains Malaysia, Engineering Campus, 14300, NibongTebal, Penang, Malaysia
2
Garmsar Branch, Islamic Azad University, Semnan, Iran
Received: 27 Jul. 2014 Accepted: 4 Sep. 2014
ABSTRACT: Bedload transport is an essential component of river dynamics and estimation of its rate is important to many aspects of river management. In this study, measured bedload by Helley- Smith sampler was used to estimate the bedload transport of Kurau River in Malaysia. An artificial neural network, genetic programming and a combination of genetic programming and a neural network were used to estimate the bedload carried in Kurau River, based on bedload transport measurement data and hydraulic variables. A statistical analysis was carried out to validate methods by computing RMSE, MARE and inequality ratio (U). In general, the ability of the artificial neural network combined with genetic programming with R2 equal to 0.95, RMSE equal to 0.1 as a precipitation predictive tool for predicting the bedload transport rate was observed as being acceptable.
Keywords: Artificial neural network, Bedload transport, Genetic programming, Kurau River
INTRODUCTION
Bedload transport equations are usually developed based on hydraulic principles and attempts are made to relate the level of bedload transport to some correlate of flow, such as water discharge, shear stress or stream power (Martin, 2003). The difficulties associated with bedload field measurement have created a long history of interest in developing equations for the prediction of bedload transport (Gao, 2012; Yadav and Samtani, 2008). Due to the relationship between the reliability and representativeness of the data utilized in defining reference values, constants and other relevant coefficients, and the performance of a particular equation, most sediment transport equations do not represent a fundamental or
* Corresponding author E-mail :[email protected]
complete correlation. Therefore it is difficult, if not possible, to recommend a single formula for engineers and geologists to use in the field under all conditions (Camenen and Larson, 2005; Khorram and Ergil, 2010). River flow condition and river environment have the largest impact on bedload transport rate in different rivers and the computed results from various equations often differ from one another, as well as from the measured data set. Consequently, recently proposed equations need to be adopted for the new condition (Khorram and Ergil, 2010). Nowadays, the new statistical and intelligent methods that have been developed can be used to evaluate or develop the appropriate bedload transport predict equation.
Sirdari, Z.Z. et al.
86
Malaysia, due to the difficulty of sampling and the possibility for wading in the water in these areas. New mathematical modelling methods were used to improve the sensitivity and performance of prediction equations in overcoming the difficulties of developing such equations, and were based on a balance between simplicity and accuracy. Genetic programming (GP) and an artificial neural network (ANN) are powerful tools for pattern recognition and data interpretation.
Multigene GP is in fact a linear combination of nonlinear terms, a characteristic that may precisely identify the pattern of engineering problems (Hinchliffe et al., 1996).
GPTIPS was utilized in this study to perform a multigene GP for the precise estimation of bedload transport. It is a new “genetic programming and symbolic regression” code based on multigene GP for use with MATLAB (Searson, 2009b).
Reported GP applications include sediment transport modelling (Babovic and Abbott, 1997), the effect of flexible vegetation on flow in wetlands (Harris et al., 2003), sedimentary particle settling velocity equations (Babovic and Bojkov, 2001), emulating the rainfall runoff process (Liong et al., 2007; Whigham and Crapper, 2001), an evolutionary computation approach to sediment transport modelling (Kizhisseri et al., 2005), modelling the stage discharge relationship for rivers (Azamathulla et al., 2011) and suspended sediment modelling (Kisiet al., 2012).
Widespread reviews of the ANN application in the area of river engineering show that the model is capable of describing the flow and sediment transport processes in a river system of interconnected channels. In addition, the ANN can be successfully applied for sediment transport when other approaches cannot succeed due to the uncertainty and the stochastic nature of the sediment movement (Chang et al., 2012; Kumar, 2012; Nagy et al., 2002; Singh et al., 2007; Yang et al., 2009).
Among the numerous ANN structures, the multilayer, feed-forward network is the most widely used in the area of sediment transport (Rumelhart et al., 1985). The Levenberg-Marquardt (LM) algorithm, a standard second-order nonlinear least-squares technique based on the backpropagation process, was used in this study to train the ANN models. The performances of the GP and ANN models, as well as a combination of the ANN and GP were evaluated and the best model was selected for estimating the bedload transport of Kurau River.
MATERAIS & METHODS
Site description and data collection
The Kurau River sub-basin (Fig. 1) is between latitude 530 000 (N) and 570 000 (N), longitude 683342 (E) and 723342 (E) in Zone 47 in the UTM coordinate system. The catchment area consists of two main river tributaries, namely Kurau River and Ara River. The mid-valleys of the river are characterized by low to undulating terrain, which gives way to broad and flat floodplains. Ground elevations at the river's headwaters are moderately high at 1200 m and 900 m. The slopes in the upper 6.5 km of the river averages 12.5%, whilst those lower down the valleys are much lower, around the order of 0.25% to 5%.
Data of the six channel criteria were taken along the Kurau River and included a variety sand bed channels. A range of flow discharge measurements covering low and high regimes were carried out using current meter. Measurements taken included flow depth (yo), velocity (v), river width (B) and
water surface slope (S0) for a detailed
analysis of the river.
87
Fig. 1. Kurau River sub-basin
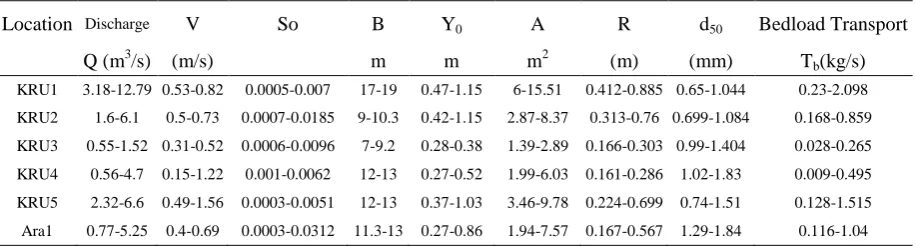
Table 1. Range of field data
Location Discharge V So B Y0 A R d50 Bedload Transport
Q (m3/s) (m/s) m m m2 (m) (mm) Tb(kg/s)
KRU1 3.18-12.79 0.53-0.82 0.0005-0.007 17-19 0.47-1.15 6-15.51 0.412-0.885 0.65-1.044 0.23-2.098 KRU2 1.6-6.1 0.5-0.73 0.0007-0.0185 9-10.3 0.42-1.15 2.87-8.37 0.313-0.76 0.699-1.084 0.168-0.859 KRU3 0.55-1.52 0.31-0.52 0.0006-0.0096 7-9.2 0.28-0.38 1.39-2.89 0.166-0.303 0.99-1.404 0.028-0.265 KRU4 0.56-4.7 0.15-1.22 0.001-0.0062 12-13 0.27-0.52 1.99-6.03 0.161-0.286 1.02-1.83 0.009-0.495 KRU5 2.32-6.6 0.49-1.56 0.0003-0.0051 12-13 0.37-1.03 3.46-9.78 0.224-0.699 0.74-1.51 0.128-1.515 Ara1 0.77-5.25 0.4-0.69 0.0003-0.0312 11.3-13 0.27-0.86 1.94-7.57 0.167-0.567 1.29-1.84 0.116-1.04
Artificial neural networks (ANN)
A neural network toolbox contained within the MATLAB package was used in this study. Bedload transport equations were integrated into a multilayer feed-forward network with an error backpropagation algorithm. Field data were provided and an appropriate neural network structure was selected for training purposes. Training was performed using Levenberg-Marquardt backpropagation, where input and output were presented to the neural network as a series of learning. The network was set up with four parameters: the input pattern of discharge (Q), water surface slope (S), mean grain size (d50) and Shields
parameter for the initiation of motion (θ), as these are the most influential parameters widely used in bedload transport equations; bedload transport rate Tb was applied as the
output pattern. In other words, the input
layer contained four neurons while the output layer contained one. Between the two layers, there was another hidden layer that contained a suitable number of neurons under investigation.
Genetic programming method (GP)
A GPTIPS run was performed with the following settings: population size = 500; number of generations= 25; tournament size= 7 (with lexicographic selection pressure); Dmax= 3; Gmax= 4; elitism 0.0%
Sirdari, Z.Z. et al.
88
The selection of appropriate model input variables in GP, as with any data-driven prediction model, is extremely important. The choice of input variables is generally based on previous knowledge concerning the most influential variables, as well as insight into the problem (Khorram and Ergil, 2010). Four input parameters, including discharge(Q), water surface slope (S), mean grain size (d50) and Shields
parameter for the initiation of motion (θ) as the most influential parameters have been widely used in bedload transport equations as variable data, with Tb (bedload transport
rate) as invariable data being used in the current study, where :
Tb= f (Q, S, d50, θ) (1)
RESULTS & DISCUSSION
Prediction of bedload transport in Kurau River by genetic programming
Multiple sets of training, testing and validation data were randomly selected and numerous runs were performed with various model settings, such as the number of generation and genes, and the depth of trees by the trial and error. From 69 available data, 50% were used for training (present study), 25% were used for testing and 25% (DID, 2009) for validation. Consequently, the models were selected according to statistical criteria such as R2 and RMSE.
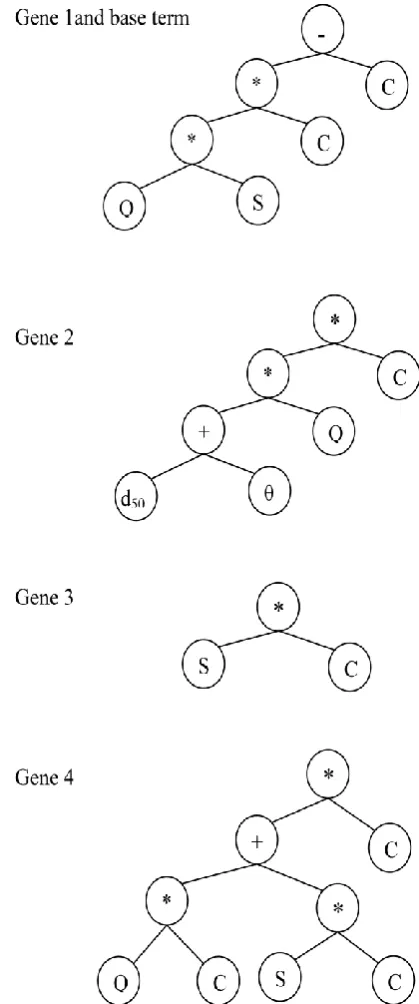
The best relationship for each training purpose, test and validation was selected from the optimum R2 and RMSE so as to prevent from over-fitting the model by selecting a high R2 for training. The following relationship was selected to model the bedload transport:
Tb= 0.09427 Q + 35.81 S + 0.06682 Q
(d50 + θ) - 38.02 Q S - 0.06172
(2)
where Tb is bedload transport rate (kg/s),
d50 is median grain size (mm), S water
surface slope (m/m) and θ is Shield's parameter. Figure 2 shows the expression of genes for GP formulation.
The accuracy of the developed equation was examined by plotting the measured versus predicted values of bedload rate for training, testing and all other data. The values of R2 and RMSE were equal to 0.96 and 0.083, respectively, for training sets, and 0.78 and 0.159, respectively, for testing sets.
89
The predictive abilities of the GP (Eq. 2) were assessed through the validation of the model by the set of data gathered about the Kurau River of the present study, as well as data from a previous study (DID, 2009). The values of R2 and RMSE for this data set were obtained as being equal to 0.89, 0.110, respectively. In fact, the evolved model achieved good accuracy for both testing and validation sets, thereby confirming that enough generalization had been obtained.
Combination of ANN and GP
The combination of GP and ANN was suggested for achieving the best result for predicting sediment transport (Singh et al., 2007). The combination of GP and ANN was performed for the modelling of bedload transport rate in Kurau River.
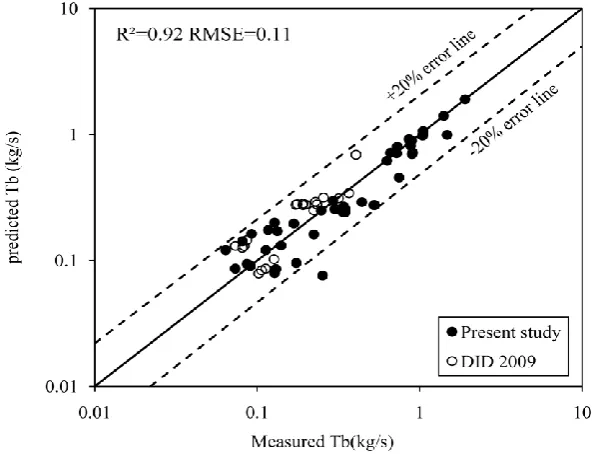
First, the bedload transport rate was calculated using the GP Equation (2) and then the outcome was given as an input to the ANN, which consisted of one input node, one output node and 10 hidden layers. Figure 3 shows the test result in the
form of a scatter plot of predicted against measured bedload transport. The underlying error measures were R2= 0.92 and RMSE= 0.11 kg/s. The results showed that the combination of GP-ANN can be applied to provide predictions of bedload transport rate and, not surprisingly, performed better than GP application. Alternatively, a neural network consisting of the input of four variables (Q, S, d50, θ)
and one output Tb was trained and
validated. For this purpose, the data were shuffled and divided into two parts; one part was randomly applied in the learning process, while the other part was used for verification. This can often be done in more than one way by changing the percentage of data for the training process and verification. Finally, from 69 available data aspects, 50% were used for training and 25 % were used for testing and validation. The number of neurons in the hidden layer was determined by calibration using several computer-applied tests on random data sets.
Fig. 3. Measured versus predicted values of Tb by GP-ANN
The correlation of determination, root mean square error and mean absolute error of training, testing and the validation of
Sirdari, Z.Z. et al.
90
Table 2. Summary of ANN results
Data Percentage of total data R2 RMSE MAE
Training 50% 0.9 0.16 0.088
Testing 25% 0.81 0.16 0.013
Validation 25% 0.9 0.10 0.085
Total 100% 0.86 0.15 0.1
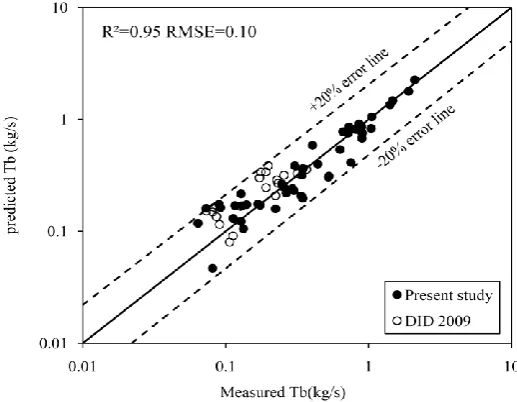
The outcome of the ANN was calibrated with GP and the result showed an expected success and an improved R2, as well as the indicating errors (R2= 0.94, RMSE= 0.1
and MARE= 0.32). The plot scatter of the measured against predicted bedload transport rate is shown in Figure 4.
Fig. 4. Measured versus predicted values of Tb by ANN-GP
The combined ANN-GP model results therefore appear to be more acceptable than those of the single ANN and GP models. The combination showed that, firstly, the ANN carried out a good function approximation; thereby, GP made the search for an optimum solution easier and improved the accuracy of the single
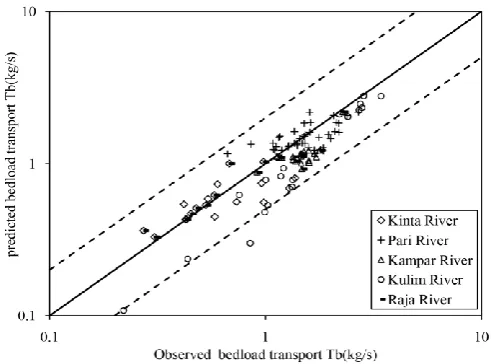
ANN and GP results. This method was validated by some river data from a previous study in Malaysia (Table 3). Figure 5 shows the high accuracy of the ANN-GP method, with R2= 0.80 and RMSE= 0.14 for estimation of bedload transport rate in some rivers in Malaysia.
Table 3. Range of field data for validating the GP equation (Yahaya, 1999; Ab. Ghani et al., 2003; Chang et al., 2008)
River No of data Discharge Slope Width Water Depth Hydraulic radius Median size Bedload transport Q (m3/s) So(m/m) B (m) Y0 (m) Rh (m) d50 (mm) Tb(kg/s)
Kampar
River 20 7.98-17.94 0.001 20.2-21.21 0.55-1.28 0.52-1.14 0.85-1.10 0.40-1.25
Raia River 40 3.6-17.44 0.0017-0.0036 17.3-25.6 0.24-1.76 0.23-1.51 0.50-1.60 0.20-1.82
Kinta
River 20 3.79-9.65 0.0011 24.6-28.0 0.32-0.57 0.35-0.57 0.40-1.00 0.02-1.21
Pari River 40 9.65-17.4 0.0012-0.0013 19.3-19.5 0.68-0.89 0.54-1.30 0.85-3.10 0.35-0.79
Kulim
91
Fig. 5. Validation of ANN-GP method by river data sets in Malaysia
Comparison of bedload transport estimation for Kurau River
Three conventional evaluation criteria, RMSE (root mean square error), mean absolute relative error (MARE) and U (inequality coefficient) were used in the present study to measure the performances of models based on training data and testing data.
RMSE provides a quantitative indication of the model absolute error in terms of the units of the variable, with the characteristic that larger errors receive greater attention than smaller ones. This characteristic can help eliminate approaches with significant errors (Wu et al., 2008). For MARE, answers were provided as the percentage error in predictions. The inequality coefficient (U) was used to determine how accurate a bedload equation predicted the actual value of bedload discharge in the Kurau River in similar bedload-transport conditions. The inequality coefficient (U) is defined as:
2 12
2 121 1
1 n 1 n
bo i bp
i i i
rmse U
T T
n n
(3)
where RMSE is the root-mean-square error, defined as
12 2
1
RSME n bo bp i
i
T T
n
(4)
1 1
MARE n boi bpi
i
boi
T T
n T
(5)where Tbi is the measured bedload rate, Tbo
is the predicted bedload rate, i denotes a given flow and n is the number of flows. The scaling of the denominator is such that
U always fall between 0 and 1. If U = 0, then Tbi=Tbo and there is a perfect fit. If U =
1, then Tbo Tbpand the equation lacks a
predictive value. For the purpose of this study, the GP and NLR methods represented the measured data when U was very small and close to 0 (Table 4).
Table 4. Bedload estimations assessment
Models Coefficient of determination (R2)
Root mean square error (RMSE)
Mean absolute error (MAE)
Inequality coefficient (U)
GP 0.90 0.0829 0.0807 0.068
ANN 0.86 0.15 0.100 0.083
ANN-GP 0.95 0.10 0.075 0.09
Sirdari, Z.Z. et al.
92
The results were also tested against the unreliability of the methods applied. Cronbach's alpha (Cronbach, 1951) is a coefficient of internal consistency that is used as an estimate of the reliability of the results of applied methods. The observed transport data were a best fit with a combination of ANN- and GP-based results with reliability of 0.98 of Cronbach's α.
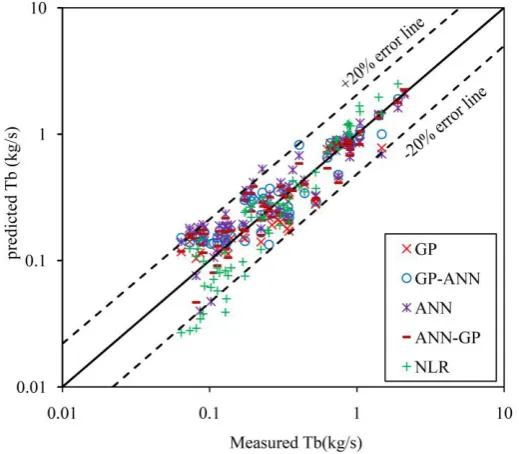
Figure 6 demonstrates the observed versus predicted transport rates of the Kurau River study sites and indicates that predicted values by GP, GP-ANN, ANN and ANN-GP methods were typically within an order of magnitude for the observed values. However, the ANN-GP model showed better performance with 0.95 as the correlation coefficient.
Fig. 6. Comparisons of predicted and measured bedload rates for Kurau River
CONCLUSION
Hydraulic variables and sediment data from Kurau River in Malaysia were used to predict bedload transport. The artificial neural network and genetic programming methods were used and the RSME and inequality ratio (U< 0.1) suggested good agreement between the computed and predicted bedload transport rate for Kurau River. The developed model by combination of ANN-GP, compared to GP and ANN, showed reasonable performance under field conditions according to the verifications demonstrated in Figure 6. From the results of bedload prediction with R2= 0.95, root mean square error (RMSE= 0.1) and mean absolute error (MARE=0.32), respectively, it can be concluded that the combination ANN-GP
model provides a good fit for the measured data. The combined ANN-GP model results therefore appear to be more acceptable than the results of a single ANN or GP model in the context of this study and in comparison with other methods such as adaptive neuro-fuzzy inference system (ANFIS) (R2= 0.648, RMSE= 6.654) for the prediction of total bed material load for three Malaysian rivers (Chang et al., 2012). The combination model showed that the ANN first carries out a good function approximation, thereby enabling GP to make the search for an optimum solution easier and improving the accuracy of single ANN and GP results.
ACKNOWLEDGEMENT
93
research grant No. 1001/PREDAC/8044049. The author would like to acknowledge the River Engineering and Urban Drainage Research Centre (REDAC) for their effort and collaboration throughout the study's duration.
REFERENCES
Ab. Ghani, A., Zakaria, N. A., Abdullah, R., Chang, C. K., Sinnakaudan, S. K. and Mohdsidek, L. (2003). River sediment data collection and analysis study, .Contract Research No.JPS (PP)/SG/2/2000, Department of Irrigation and Drainage, Malaysia, Kuala Lumpur.
Azamathulla, H., Ghani, A., Leow, C., Chang, C.
and Zakaria, N. (2011). Gene-Expression
Programming for the Development of a Stage-Discharge Curve of the Pahang River. Water Resour. Manag., 1-16. doi: 10.1007/s11269-011-9845-7
Babovic, V. and Bojkov, V. H. (2001). Automatic discovery of settling velocity equations. DHI. Technical Report D2k TR 0401-1.
Babovic, V. and Abbott, M. B. (1997). The evolution of equations from hydraulic data, Part II: Applications. J. Hydraul. Res., 35(3), 411–430.
Camenen, B. and Larson, M. (2005). A general formula for non-cohesive bed load sediment transport. Estuar. Coast. Shelf Sci., 63(1-2), 249-260.
Chang, C. K., Ab. Ghani, A., Abdullah, R. and Zakaria, N. A. (2008). Sediment transport modeling for Kulim River a case study. J. Hydroenv. Res., 2( 1), 47-59.
Chang, C. K., Azamathulla, H., Zakaria, N. and Ghani, A. (2012). Appraisal of soft computing techniques in prediction of total bed material load in tropical rivers. J. Earth Syst. Sci., 121(1), 125-133. doi: 10.1007/s12040-012-0138-1
Cronbach, L.J. (1951). Coefficient alpha and the internal structure of tests. Psychometrika, 16(3), 297-334.
DID. (2009). Department of irrigation and drainage Malaysia.Study on river sand mining capacity in Malaysia.
Gao, P. (2012). Validation and implications of an
energy-based bedload transport equation.
Sedimentology, 59(6), 1926-1935. doi:
10.1111/j.1365-3091.2012.01340.x
Harris, E. L., Babovic, V. and Falconer, R. A. (2003). Velocity predictions in compound channels
with vegetated floodplains using genetic
programming. Int. J. River Basin Manage., 1(2), 117-123.
Hinchliffe, M. P., Willis, M. J., Hiden, H., Tham, M. T., McKay, B. and Barton, G. W. (1996). Modelling chemical process systems using a
multi-gene genetic programming algorithm. Late
Breaking Papers at the Genetic Programming 1996 Conference, 56-65.
Khorram, S. and Ergil, M. (2010). Most Influential Parameters for the Bed-Load Sediment Flux Equations Used in Alluvial Rivers1. J. Am. Water
Resour. Assoc., 46(6), 1065-1090. doi:
10.1111/j.1752-1688.2010.00468.x.
Kisi, O., Dailr, A. H., Cimen, M. and Shiri, J. (2012). Suspended sediment modeling using genetic programming and soft computing techniques. J.
Hydrol., 450–451(0), 48-58. doi:
10.1016/j.jhydrol.2012.05.031.
Kizhisseri, A. S., Simmonds, D., Rafiq, Y. and
Borthwick, M. (2005). An evolutionary
computation approach to sediment transport modeling. Paper presented at the 5th Int. Conf. on Coastal Dynamics.
Kumar, B. (2012). Neural network prediction of bed material load transport. Hydrolog. Sci. J., 57(5), 956-966. doi: 10.1080/02626667.2012.687108.
Liong, S.-Y., Gautam, T. R., Khu, S. T., Babovic, V., Keijzer, M. and Muttil, N. (2007). Genetic programming: a nemw paradigm in rainfall runoff modeling. J. Am. Water Resour. Assoc., 38(3), 706-718.
Martin, Y. (2003). Evaluation of bed load transport formulae using field evidence from the Vedder River, British Columbia. Geomorphology, 53(1-2), 75-95.
Nagy, H. M., Watanabe, K. and Hirano, M. (2002). Prediction of Sediment Load Concentration in Rivers using Artificial Neural Network Model. J. Hydraul. Eng., 128(6), 588-595.
Searson, D. P. (2009a). GPTIPS: Genetic
Programming and Symbolic Regression for
MATLAB, UserGuide. Retrieved 10 February, 2010, from http://gptips.sourceforge.nets.
Searson, D. P. (2009b). GPTIPS: Genetic
Programming and Symbolic Regression for
MATLAB. Retrieved 10 February, 2010, from
http://gptips.sourceforge.nets.
Sirdari, Z.Z. et al.
94
Rumelhart, D.E., Hinton, G.E. and Williams, R.J. (1985). Learning Internal Representations by Error Propagation. univ san diego la jolla inst for cognitive science, california.
Whigham, P. A. and Crapper, P. F. (2001).
Modeling rainfall-runoff using genetic
programming. Math. Comput. Model., 33, 707-721.
Wu, C. L., Chau, K. W. and Li, Y. S. (2008). River stage prediction based on a distributed support vector regression. J. Hydrol., 358, 96-110.
Yadav, S. M. and Samtani, B. K. (2008). Bed load equation evaluation based on alluvial river data,
India. J. Civ. Eng., 12(6), 427-433. doi: 10.1007/s12205-008-0427-z.
Yahaya, N. K. (1999). Development of sediment rating curves for rivers in Malaysia: Case studies of Pari, Kerayong and Kulim rivers. Dissertation, Universiti Sains Malaysia.