Attitude of engineering students towards engineering
drawing: A case study
Azodo, Adinife Patrick
Federal University of Agriculture, Abeokuta, Nigeria ([email protected])
Received: 21 December 2015 Revised: 26 February 2016 Accepted: 9 March 2016
Available Online: 26 March 2016 DOI: 10.5861/ijrse.2016.1401
ISSN: 2243-7703 Online ISSN: 2243-7711
OPEN ACCESS
Abstract
The effects of attitude as it relates to engineering students’ learning in engineering drawing
was looked into in this study. All the engineering students from the four engineering
departments of Federal University of Agriculture Abeokuta, Nigeria were considered as the
study population. However the participants were a total of 152 engineering students. The
research instrument was a pre-tested self-administered questionnaire. The questionnaire was
structured using close-ended Likert 5-point attitude scale format for it’s relatively easy to
design, high degree of reliability and validity in using Likert technique. The data obtained was
analysed using frequency, percentage, mean score and standard deviation techniques on
Standard Package for Social Scientists (SPSS) 16.0, software. The analysed data showed that
the students have positive attitude to engineering drawing as a subject and teaching
methodology. They were unsure about classroom environment and background information
but obviously negative about the instructional and educational items.
Azodo, A. P.
Attitude of engineering students towards engineering drawing: A case study
1. Introduction
Engineering drawing is one of the fundamental skills needed by all engineers to be creative and productive in engineering profession. It offers a wide range of advantages such as effective and efficient communication among all professionals involved in design and production process, reduces lot of time, resources, labour and manufacturing errors, simplify design and production process of complex structures and help to check design defects (Kosse, 2005; Rio et al., 2006; Narayana et al., 2006; Kabouridis, 2010; Igbinomwanhia & Aliu, 2013). Errors made in an attempt to interpret engineering documentation could pose some exigent catastrophe to the whole essence of design and production processes (Kosse, 2005). Kosse and Senadeera (2011) reported a case where misinterpreted information due to lack of engineering drawing knowledge hampered a fault resolving process. Salau (1996) maintained that to avoid misinterpretation of working drawing, all the design and production/construction specifications should be properly detailed, in terms of quality and quantity, as inexplicit working drawings can lead to collapse or failure. The basics of engineering drawing are taught using a variety of approaches; computer assisted teaching methods as well as traditional manual drawings (Radcliffe, 1998; Reffold, 1998; Kosse & Senadeera 2011; Rio et al., 2006; McLaren, 2007). Nonetheless the focus of this study is on the traditional manual drawing approach which is usually the first and basic step into design and drafting learning process as it were in relation to this study population.
All students in engineering discipline are taught engineering drawing. This helps develop their spatial ability, design competence and expertise needed for problem solving prevalent in engineering profession (Caldwell et al., 2012; Alias et al., 2002; Alias et al., 2003; Roorda, 1994; Olkun, 2003; Akasah & Alias, 2010; Nagy-Kondor & Sörös, 2012; Field, 2004; Osborn & Agogino, 1992). Igbinomwanhia and Aliu (2013) showed that there is drastic decline in performance level of Nigerian engineering students in engineering drawing. Predominant challenges engineering students encounter in engineering drawing are difficulties to see an image in 3-dimension, understanding of projection view methodology, producing drawings of professional quality, and reading and interpreting engineering drawings (Kosse, 2005; Akasah & Alias, 2010; Rio et al., 2006; Jayasree, 2003). Varied factors that lead to the challenges students encounter in engineering drawing found in literatures includes teaching approach, instructional and educational items, acquisition of the fundamental knowledge of the subject in secondary education, the learning atmosphere and time allocated for the subject (Olkun, 2003; Alias et al., 2002; Igbinomwanhia & Aliu, 2013; Diraso 2013).
1.1 Attitude factors in learning
make or mar the outcome of students learning process (Azodo, 2014).
According to Goodykoontz (2008) student attitudes are mostly affected by four external factors: the teacher, teaching style, classroom environment, assessments and achievement, and one internal factor, individual perceptions and characteristics. Other factors that affect outcome of students learning process and attitudes include student's ability and previous knowledge, workload (time spent), teaching content, teaching strategy, etc (Poon, 2007). Increase of the time spent or allotted on a particular study does not imply apparent heavy workload. Poon (2007) observed that the approach a learner imbibes in addition to sufficient working time is an effective advance for effective learning (Poon, 2007). Actual workload though difficult to measure with any precision, it usually defines the sum of class contact hours and the time used to understand the course content and to complete assignments (Kember & Leung, 1998). Poon (2007) observed that there is correlation between the time spent and the learning attitudes in students. Another external factor, environment was found to have positive correlation with attitude in learning process (Maat & Zakaria, 2010). Maat and Zakaria (2010) found that learning environment and teacher's factor are two factors that need the institutions' consideration in producing positive attitude in students.
Positive attitude held towards learning activities facilitate the achievement of the desired learning outcomes (Popham, 2005; Royster et al., 1999; Hannula, 2002; Tapia & Marsh, 2001; Young, 1998; Lopez et al., 1997; Midgley et al., 1989; Simpson, 1978). Attitude of an individual is either explicit or implicit. Most attitude measurements either rely on direct attitudinal inquiries or infer from clues that are existing to determine tacit attitudes (Al- Sa´d, 2007; Bohner & Wänke, 2002; Alias et al., 2002; Ajzen, 2002; Mohamed & Waheed, 2011). Direct methods are usually employed in both applied and academic research (Bohner & Wänke, 2002). Attitude influences ones knowledge, view and development (Goodykoontz, 2008). Students expressing a more positive attitude towards a subject area would endeavor to behave consistently with their attitudes, by spending more time and putting more effort in that area or by seeking additional learning opportunities (Lindquist, 1980). People’s attitude can be affected by unintentional misinformation provided from negative sources of influence by voluntary submission (Rohn, 2000). Some studies observed that information such as significance and applicability, or lack thereof, of a subject in the lives and future careers of the students affect their attitudes (Malmivuori, 2006; Elliott et al., 2001; Alias et al., 2002). The susceptible of an individual to character, development, or behaviour influence periodically changes. However, each person determines his/her degree of influence. Factors which influences our attitude positively and strongly includes word expression, affirmation, self-image, personality, environment, association and physical appearance (Eromon, 2010).
Student attitudes seem to be primarily context-dependent (Donohue and Richard, 2009). The main factors that affect how a particular instruction on a study is received are the scope and grade-importance of the assignment; team size with respect to the amount of effort required; and team composition (Donohue & Richard, 2009). Berg (2005) observed that students’ perceived level of teacher’s empathy for their efforts at learning affects students’ attitude either positively or negatively. This shows that teacher’s factor has change possibility in educational setting which is beneficial to all students. There are a variety of teaching styles adopted in teaching or passing on instruction to the students. De Souza Barros and Elia (1997) stated that there is a strong tie which exists between teaching attitudes of teachers and their competencies in what they teach (De Souza Barros & Elia, 1997). Emphasis on some negative aspects, will point out the teachers factors which could influence students attitude towards a subject learnt. Mere repetition of study material content or textbook reflects on how innovative the teachers are in their teaching innovation and methodology. This stresses the need for evaluation and re-evaluation of how to teach what to teach.
Azodo, A. P.
intends to adopt self-reports of beliefs, feelings, behavior, and many others, and individual’s reactions to, or interpretations of, partially structured material pertinent to the subject matter to find out the effects of attitude as it relates to engineering students’ learning in engineering drawing.
1.2 Significance of the study
Many technical oriented professions such as engineering, architecture, computer modeling, and many others interconnect and interrelate in the discharge of their duty. The instrumentality of the proficiency and competence knowledge of engineering drawing plays an integral role in the communication process among these professions. Engineers prepare models, drawings, diagrams and blueprints of various products or structures to guide product makers, construction officers, development personnels, architects in the manufacture, fabrication, construction, implementation and building processes who may or may not be in the same vicinity. This they do by providing the vital link between design and practical application through translating critical design concepts into workable plans for tangible, buildable, constructible and architectural products. Putting up a good design adds value to both the public and the private sectors. However, bad, wrong or poor design often characterized by illegibility, non-uniformity, lack of continuity, inexplicit working drawings, and many others and preceded by construction or execution which follows the same trend when completed, the cost of correction is very expensive as such structures or construct has to be brought down and re-constructed from the scratch in most cases (Simmons, 2006).
1.3 Rationale of the study
The decline in the performance of Nigerian engineering students in engineering drawing is far-reaching (Igbinomwanhia & Aliu, 2013). Varied factors that lead to the challenges students encounter in engineering drawing which manifest itself in the students inability to see an image in 3-dimension, understanding of projection view methodology, producing drawings of professional quality, and reading and interpreting engineering drawings (Kosse, 2005; Akasah & Alias, 2010; Rio et al., 2006; Jayasree, 2003) needed to be addressed. It has been found that in understanding and improving the educational processes in the learning environment, attitude is one of the basic and most important elements that must be considered.
Learning attitude is an essential factor in determining effectiveness of learning process (Poon, 2007). If learners’ attitude can be identified and addressed, knowledge and understanding for application which is whole essence of teaching-learning of engineering drawing will be achieved. For an engineering graduate or engineer to feature in all stages of design process and function optimally from conception to presentation of finished plans or product require good and proficient knowledge of engineering drawing. It is therefore necessary that the training process should be tenaciously upheld with optimum importance so as to acquit oneself with such knowledge.
1.4 Implication and application of engineering drawing for teaching and learning process in engineering
professions
Word language cannot explicitly and concisely describe the size, shape and features of drawings as engineering drawings are not mere illustration but drawings conveying specification or critical information on object geometry, dimensions, allowable variations in dimension of a part or an assembly and specifics for item surface quality (Beňa, 2008). In addition, these features are presented with accuracy and clarity. The technical nature of engineering drawing enables full and clear definition of requirements for engineered product usually created in accordance with standardized conventions for its nomenclature, layout, size, appearance, interpretation, etc. In application, this conveys specifically all the information required by a manufacturer to produce an item or component as supposed (Beňa, 2008).
commencement intended to be achieved at the completion of the design process. The application of engineering drawing knowledge at the design process stage enables engineers to take their chosen concept and conform it to reality. The same is communicated to other concerned designers and manufacturing personnel. Drawing proficiency and competence is a necessity during all the developmental stages of design process (Ullman et al., 1990). The implementation of designs usually occurs after a model or prototype of a design is created from engineering drawings. It is at this stage that errors are noted and corrected for suitable procedure thereby saving the danger of inconveniences and cost (Khandani, 2005).
Image representation and projections in engineering graphics are basically on 2D and 3D views. 2D and 3D imaging are used as a preliminary tool for inspection, geometrical evaluation of structural elements, mapping of typical defects and inclusions frequently found in structures. These enhance appropriate restoration and retrofitting of the projects and maintenance programmes on structures involved (Topczewski et al., 2007). A circuit diagram which shows the components of the circuit as simplified standard symbols, the power and signal connections between the devices are done by proficient knowledge application of engineering drawing (Beňa, 2008). Typical example of the application of engineering drawing is the printed circuit board (PCB) which is usually drafted before the PCB development process for arrangement and fixing of various components (Beňa, 2008).
Bad drawing or drafting presents unjustifiable risk and danger if adopted in design and development process of products and structures. Such dangers include inconveniences to users, cost and financial risks. Examples cited in Simmons (2006) showed that badly designed housing estate at Holly street in Dalston East London in 1970s was demolished and rebuilt from scratch after one-third duration of its intended design life costing £92 million for the correction. Another case was the George’s park in Lozells, Birmingham also in the 1970s which cost £1.2 million for its redevelopment. Every construction or development process can actually be ideal or near perfect if proper drafting and design process is put in place (Simmons, 2006).
2. Materials and method
2.1 Participants
All the engineering students from the four engineering departments of Federal University of Agriculture Abeokuta, Nigeria were considered as the study population. However the participants were a total of 152 engineering students.
2.2 Research process
The survey was carried out in the College of Engineering, Federal University of Agriculture, Abeokuta. The data collection took place in June 2012 during the academic session in the aforementioned school. The questionnaire used in this study was pre-tested. The questionnaire was administered to the students of the various department and collected the same day. This was to ensure personal response to the survey questions. However the participants were given enough time for accurate response to the questionnaire. A total of 152 questionnaires duly completed were considered 100% sample for the study. Participation in this research was voluntary and no incentive was offered. Informed consent was obtained from participants after being informed about anonymous nature and objective of the study.
2.3 Research instrument
Azodo, A. P.
the light of these literatures was structured to collect demographic information such as gender, year(s) of study, department as well as other attitude measurement factors. Attitude factors were categorised into five subscales as students views towards teachers and teaching approach in engineering drawing, instructional and educational items, background information of the subject, the classroom atmosphere and attitude of students’ as regards engineering drawing as a subject. The research instrument was a combination of items from attitude assessment studies in different areas of research with some particulate input developed by the researcher to conform to this study. These were determined using close-ended questions on Likert 5-point scale. The relative easy in designing as well as significant high degree of reliability and validity in using Likert technique in attitude measurement method prompted the selection Likert five-point scale attitude measurement (Thomas, 1978). The five-point scale enable a participant to express his/her level of agreement or disagreement to the questions assessing attitude towards engineering drawing.
2.4 Data analysis
In general people’s attitudes are either positive or negative. But then there are cases where people’s view towards an object can conflict or ambivalent. This is often termed neutral or unsure. In this view appropriate attitude scaling point was assigned to each of the items on the attitude scale responded to on a five point scale. The positively arranged questions where scored thus strongly agree = 5, agree = 4, undecided = 3, disagree = 2 and strongly disagree = 1. The negatively structured questions were scored thus strongly agree = 1, agree = 2, undecided = 3, disagree = 4, and strongly disagree = 5. Data obtained were analysed using descriptive statistics of frequency counts, percentage, mean score and standard deviation techniques by employing Standard Package for Social Scientists (SPSS) 16.0. The mean score value of each item obtained from the result are interpreted as; 2.5 and below = negative, 2.6-3.4 =Neutral, 3.5 and above = positive. The level of significance was set at p<0.05.
2.5 Reliability and validity
With the help of professionals and research experts in engineering education the content was evaluated and analysed for suitability. The research instrument developed was tested using a handful of selected sample in the study population. This was helped to ascertain ease of interpretation of the research instrument. The subjects were timed while left to fill the questionnaire at their own pace. They were expected to report or ask questions on any unclear item on the questionnaire for clarity. Modifications were made so as to achieve clarity and simplicity of the final copy of the questionnaire appropriate for the study.
3. Results and discussion
3.1 Demographic characteristics of participants
The demographic characteristics of the students who participated in the survey showed that, 25 students were in Civil, 42 in Mechanical, 47 in Electrical and 38 in Agricultural engineering departments. Of the students, 46 (30.3%) were 2nd-year students, 56 (36.8%) 3rd-year students, 22 (14.5%) 4th-year students and 28 (18.5%) 5th-year students. The gender distribution showed that about nine-tenth (n = 135) of the respondents were males while the remaining one-tenth (n=17) were females.
3.2 Students’ views of their teachers and teaching approach in engineering drawing
the teachers have not taught. Teaching is not all about what has been covered but what the learner is able to demonstrate with little or no assistance (Junaid, 2008). The willingness of a teacher to be concerned in a student’s need and strength so as to support and encourage them enhances the learner’s zeal. Yara (2009) revealed that attitude of students can be influenced by the teacher’s attitude and his/her method of teaching. This in turn affects the quality of education (Afolabi, 2009).
From the analysis of data result, the students are found to be negative about their teacher’s relationship in the class. They see them as not being friendly, hence negative attitude (Table 1). In creating an effective learning environment, the tutor should have thorough knowledge of their subjects. They should be interested in the subjects that they teach, be able to show the need for the subjects, and consider the success of their students important (Kenpro, 2010). Clay and Breslow (2006) observed that lectures’ quality and clarity is one of the important factors in deciding whether the students will attend lectures. If the students do not expect to learn from lectures they are less likely to attend (Clay & Breslow 2006). It was found from the result analysis that the students are positive about their teachers having adequate teaching skills, not being innovative and demonstrative in their teaching method. They are also positive to attending classes, prefer to learn from their teachers and feel imparted at the end of the day’s study. This implies that the students are having clarity and quality lecture hence positive attitude (Table 1). However, it was observed that they were neutral about having sufficient/enough (qualitative and quantitative) practices of the drawing during the class periods and seeing the teaching of engineering drawing as something abstract.
According to Shiyan (2009), for a strategy or plan approach adopted by a teacher in knowledge dissemination to be effective, it must be ensured that the process is flexible so as to develop and broaden the horizon of the students and capable of enhancing critical thinking among the learners. It should also accommodate individual differences in the students. Moreover, the way teachers organize and use techniques of subject matter, teaching tools and materials are all included in achieving the desirable objective. Barros and Marcos (1998) stated that assuming identical trait for all students in a class and teaching them the same way affects learning process negatively. The dexterity of a teacher to select proper teaching method for a particular classroom situation will enable accomplishment of specific goals in the subject areas (Kennedy, 2011). Teaching of engineering drawing is more of practical and demonstrative than theoretical.
Teaching engineering drawing without demonstration and students’ participation may affect the learning process and as such breed negative attitude in them. The entire process and teaching procedures adopted by an instructor to guide and prepare the students via an organized and planned learning activities is important in attaining and accomplishing educational goals (Kennedy, 2011).
Table 1
Students’ views of their teachers and teaching approach in engineering drawing (N=152)
Variables Mean SD Remark
The teacher has adequate teaching skills 2.7960 0.8929 Positive
Students view of their teachers preparedness for lessons 2.5987 0.8357 Negative
The teachers are friendly in the class 2.3685 0.6762 Negative
Students opinion on quantitative drawing practices with the teacher in class
2.8290 0.6715 Neutral
Students opinion on qualitative drawing practices with the teacher in class
3.7062 0.5777 Positive
Students judgment of teachers innovation in teaching methodology 3.5855 0.7165 Positive
Engineering drawing seem abstract to me 2.8508 0.6158 Neutral
Good illustrative teaching pattern (draw as I draw) 2.4452 0.5971 Negative
Preference to learn from teacher 4.0460 0.5708 Positive
Attendance to all engineering drawing lectures 4.7258 0.3719 Positive Feeling like someone imparted at the of each engineering drawing
class
3.8377 0.5524 Positive
Azodo, A. P.
3.3 Impact of instructional and educational items teaching and learning facilities on students’ attitude
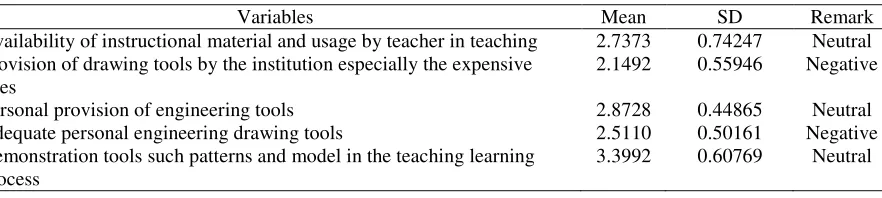
Demonstration models used in engineering drawing gives the learner the real-world picture of the task (Eley & Norton 2004) so as to foster the students’ self-confidence and concentration on the specific details instead of general concepts. Demonstration does not only improve learning concept but also improves the teachers teaching strategy and saves time. In addition an engineering drawing teacher needs to be highly innovative in the methodology so as to maintain the students zest and interest in the subject. Preparation of detailed engineering drawings according to the required standards and specifications can only be made possible with the aid of specific instruments and/or equipment. The first teaching methodology implemented and widely used in teaching engineering drawing all over the nation (Nigeria) is traditional teaching method. Nwoke (1993) observed the outcome of this effort as being insignificant as there is a wide gap between drawing and the design of the product itself encountered in instructional approach used in presenting the information involved in traditional teaching methods. He added that this has resulted in students’ spatial visualization challenges. From the analysis of data, it was not clear to the students whether the instruction materials are available for teaching engineering drawing as such they were further neutral to engagement of pattern/instructional model by their teacher (Table 2). However they are certainly negative to having the entire instrument needed for engineering drawing and school assistance in making some of the instruments available (Table 2). In general, the desired result of any learning process is facilitated by positive attitudes held towards a lay down learning activities and materials (Simpson, 1978; Young, 1998).
Table 2
Impact of instructional and educational items on students’ attitude (N=152)
Variables Mean SD Remark
Availability of instructional material and usage by teacher in teaching 2.7373 0.74247 Neutral Provision of drawing tools by the institution especially the expensive
ones
2.1492 0.55946 Negative
Personal provision of engineering tools 2.8728 0.44865 Neutral
Adequate personal engineering drawing tools 2.5110 0.50161 Negative Demonstration tools such patterns and model in the teaching learning
process
3.3992 0.60769 Neutral
3.4 Students’ attitude towards information of the subject
learners’ interest in a subject and background information of the subject as inadequate background knowledge and lack of interest discourage students’ deep approach towards learning (Felder & Brent 2005).
Table 3
Students’ attitude towards information of the subject (N=152)
Variables Mean SD Remark
Pre-knowledge of what the engineering drawing entails from colleagues and friends
3.7280 0.76977 Positive
The pre-knowledge was that the engineering drawing is difficult 2.9277 0.92784 Neutral Experience encountered is different from pre-knowledge 2.9715 0.62949 Neutral Student presence at the introductory lecture of engineering drawing 3.8268 0.76200 Positive Knowledge of technical drawing in secondary education 2.5987 0.49812 Negative Knowledge of the relevance of engineering drawing in engineering
profession
1.7873 0.34721 Negative
3.5 Students’ attitude towards the classroom atmosphere
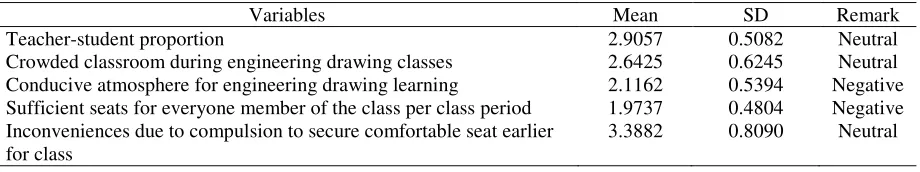
The accomplishment of a teaching-learning process is greatly affected by the environment where the students study. The number of students in a given class plays a vital role in determining the amount of attention given to each student by the teacher (Sabellah, 2010). Increased average size of a class reportedly deteriorates learning outcomes. From the analysed result, it was found that the students are neutral concerning engineering drawing auditorium crowdedness during each class periods and teacher-student proportion (number of students in a class being too much for one teacher to manage) (Table 4). There were also negative outcome due to the lack of conducive auditorium for engineering drawing classes and having enough seats for everyone member of the class per class period, though they are neutral to going to class earlier to secure seat (Table 4). The learning environment is enhanced by creating a safe and orderly environment in the classroom (Shaeffer, 2006). Feeling of crowdedness of a student concerning his/her class comes as a result of non-interaction or participation of the student in the class. Well managed and organized classroom environment creates a very good and conducive atmosphere effectual for learning and behavioural development of all students. In classrooms where the physical space is not managed well, may greatly affects what can be accomplished during a lesson. Ellett et al. (1997) observed that student’s personal perceptions of his/her learning environment significantly relates to their learning. Institutions are clearly aware that teaching is very much influenced by the availability of equipment and the convenience of premises.
Table 4
Students’ attitude towards the classroom atmosphere (N=152)
Variables Mean SD Remark
Teacher-student proportion 2.9057 0.5082 Neutral
Crowded classroom during engineering drawing classes 2.6425 0.6245 Neutral Conducive atmosphere for engineering drawing learning 2.1162 0.5394 Negative Sufficient seats for everyone member of the class per class period 1.9737 0.4804 Negative Inconveniences due to compulsion to secure comfortable seat earlier
for class
3.3882 0.8090 Neutral
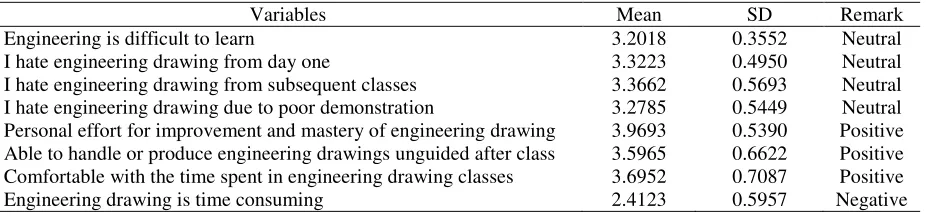
3.6 Attitude of Students’ as regards engineering drawing
Azodo, A. P.
of learning toward a particular subject, thus, makes him enthusiastic to learn than those whose attitude are not favourable towards the subject (Lupdag, 1989). Students’ positive attitude to learning is characterised by their display of curiosity, adhesive to know more and positive emotional responses to learning (Sabellah, 2010). This is often displayed in the activities both inside and outside the classroom that lead to success in their learning (Sabellah, 2010). According Connell and Wellborn (1991), persistence, effort, attention, enthusiasm, positive learning values, interest etc. are trait students exhibit when they have positive attitude towards a subject area. The students gave positive response to practicing on their own to master the drawings. They were negative to dislike of drawing because it takes time and the evaluation work being too much for just one topic, these shows positive attitude. From the data analysis it was evident that the students are able to handle engineering drawings challenges unguided after being taught the basics. As well as the fact that they are positive with the time spent during drawing classes (Table 5). This implies that they are enthusiastic to learn and hence they display positive attitude.
Table 5
Attitude of Students’ as regards engineering drawing (N=152)
Variables Mean SD Remark
Engineering is difficult to learn 3.2018 0.3552 Neutral
I hate engineering drawing from day one 3.3223 0.4950 Neutral
I hate engineering drawing from subsequent classes 3.3662 0.5693 Neutral I hate engineering drawing due to poor demonstration 3.2785 0.5449 Neutral Personal effort for improvement and mastery of engineering drawing 3.9693 0.5390 Positive Able to handle or produce engineering drawings unguided after class 3.5965 0.6622 Positive Comfortable with the time spent in engineering drawing classes 3.6952 0.7087 Positive
Engineering drawing is time consuming 2.4123 0.5957 Negative
4. Conclusions
The role engineering drawing knowledge plays in developing the thinking and problem solving skills among engineering students cannot be overstated. Engineers solve engineering design problems using spatially related problem-solving abilities developed in engineering drawing and related courses (Kabouridis, 2010). The study reported effects of attitude as it relates to engineering students’ learning course in engineering drawing. Students viewed their engineering drawing teachers as not friendly thereby creating a gap in relationship needed for support and encouragement that will enhances the learner’s zeal. They also reported their teachers as having adequate teaching skills and demonstrative in their teaching method. This was found to make them positive about attending classes. It also promotes the preference to learn from their teachers and feel imparted at the end of the day’s study. However, there were drawbacks in the students’ response to instructional and educational items teaching and learning facilities. Unavailability of the needed instructional materials hampers and affects the students’ attitude towards engineering drawing. The lack of knowledge of the importance of engineering drawing is found lacking thereby presenting some shortcomings to the whole essence of studying Engineering drawing. This challenge needs emphasis and the re-emphasizing of its importance in the engineering profession, so as to stimulate students’ to interest towards the subject. Adopting draw as I draw teaching pattern and moving around to clarify any challenges will not only increase their sense of belonging and affection for the class but maintain orderliness, manage and organize the classroom. Attitude of engineering students towards the subject itself is positive. Therefore for optimum result to be achieved in the learning process of engineering drawing all the negative aspect factors need to be addressed and improved on.
5. References
Afolabi, F. (2009). Teachers’ attitude and gender factor as determinant of pupils’ performance in primary science. An International Multi-disciplinary Journal, 3(1), 326-332. http://dx.doi.org/10.4314/afrrev.v3i1.43578 Ajzen, I. (2002). Attitudes. In R.F. Ballesteros (Ed.), Encyclopedia of psychological assessment (pp. 110-115).
Akasah, Z. A., & Alias, M. (2010). Bridging the spatial visualization skills gap through engineering drawing using the whole-to-parts approach. Australasian Journal of Engineering Education, 16(1), 81. Alias, M. (2003). Spatial visualization ability and civil engineering problem solving. Unpublished Doctoral
thesis, University of Surrey. Guilford, United Kingdom.
Alias, M., Black, T. R., & Gray, D. E. (2002). Effect of instruction on spatial visualization ability in civil engineering students. International Education Journal, 3(1), 1-12.
Alias, M., Gray, D. E., & Black, T. R. (2002). Attitudes towards sketching and drawing and the relationship with spatial visualization ability in engineering students. International Education Journal, 3(3), 165-175. Al-Sa'd, A. (2007). Evaluation of students' attitudes towards vocational education in Jordan. Doctoral
Dissertation in Education (Malmö Studies in Educational Sciences, 32). Malmö: Malmö högskola, Lärarutbildningen.
Altınok, H. (2004). Teacher candidates’ evaluations of their teaching competencies. Hacettepe University Journal of Education, 26, 1–8.
Azodo, A. P. (2014). Attitude influence on performance in technical skill acquisition among formal technical trainees. International Journal of Research Studies in Education, 3(5), 103-112.
http://dx.doi.org/10.5861/ijrse.2014.838
Baird, J. R., Fensham, P. J., Gunstone, R. F., & White, R. T. (1991). The importance of reflection in improving science teaching and learning. Journal of Research in Science Teaching, 28(2), 163-182.
http://dx.doi.org/10.1002/tea.3660280207
Barros, S., & Marcos, F. E. (1998). Physics teachers’ attitude how do they affect the reality of the classroom and models for change? In A. Tiberghien, L. E. Josem, & J. Barojas (Eds.), Connecting research in physics education with teacher education. The International Commission on Physics Education.
Beňa, Ľ. (2008) Fundamentals of electrical engineering Part II. Technical documentation in electrical engineering. Technical University of Košice
Berg, C. A. R. (2005). Factors related to observed attitude change toward learning chemistry among university students. Chemistry Education Research and Practice, 6(1), 1-18.
http://dx.doi.org/10.1039/B4RP90001D
Bohner, G., & Wänke, M. (2002). Attitudes and attitude change. Hove, England: Psychology Press.
Caldwell, G. A., & Woodward, S. (2012). First year design "Visualization II": The hybridization of analogue and digital tools. Procedia - Social and Behavioural Sciences, 51, 989-994.
http://dx.doi.org/10.1016/j.sbspro.2012.08.275
Clay, T., & Breslow, L. (2006). Why students don’t attend class. MIT Faculty Newsletter, 18(4). Retrieved from http://web.mit.edu/fnl/volume/184/breslow.html#top
De Souza Barros, S., & Elia, M. F. (1997). Physics teacher's attitudes: How do they affect the reality of the classroom and models for change? Connecting research in physics education with teacher education. Retrieved from http://www.univie.ac.at/pluslucis/Archiv/ICPE/D2.html
Depaolo, C., & Mclaren, C. H. (2006). The relationship between attitudes and performance in business calculus. INFORMS Transactions on Education, 6(2), 8-22. http://dx.doi.org/10.1287/ited.6.2.8
Diraso, D. K., Manabete, S. S., Amalo, K., Mbudai, Y. D., Arabi, A. S., & Jaoji, A. A. (2013). Evaluation of students’ performance in technical and engineering drawing towards an effective career choice in engineering and technical and vocational education. International Journal of Educational Research and Development, 2(4), 89- 97.
Donohue, S. K., & Richard, L. G. (2009, October). Factors affecting student attitudes toward active learning activities in a graduate engineering statistics course. In Frontiers in Education Conference, 2009. FIE'09. 39th IEEE (pp. 1-6). IEEE. http://dx.doi.org/10.1109/fie.2009.5350587
Eley, M., & Norton, P. (2004). The structuring of initial description or demonstration in the teaching of procedures. International Journal of Math Education, Science and technology, 36(6), 843-866. http://dx.doi.org/10.1080/00207390412331271276
Azodo, A. P.
evaluation in higher education. Journal of Personnel Evaluation in Education, 11(2), 167-192. http://dx.doi.org/10.1023/A:1007989320210
Elliott, B., Oty, K., McArthur, J., & Clark, B. (2001). The effect of an interdisciplinary algebra/science course on students' problem solving skills, critical thinking skills and attitudes toward mathematics. International Journal of Mathematical Education in Science and Technology, 32(6), 811-816.
http://dx.doi.org/10.1080/00207390110053784
Eromon, E. (2010). Repositioning your attitude for a new altitude source. Retrieved from http://EzineArticles.com/?expert=Ehijie_Eromon
Felder, R. M., & Brent, R. (2005). Understanding student differences. Journal of Engineering Education, 94(1), 57-72. http://dx.doi.org/10.1002/j.2168-9830.2005.tb00829.x
Field, D. (2004). Education and training for CAD in the auto-industry. Computer-aided Design, 36, 1431-1437. http://dx.doi.org/10.1016/j.cad.2003.10.007
Goodykoontz, E. N. (2008). Factors that affect college students’ attitude toward mathematics. Unpublished Doctoral Thesis, West Virginia University Morgantown, West Virginia.
Hannula, M. (2002). Attitude toward mathematics: emotions, expectations, and values. Educational Studies in Mathematics, 49, 25-46. http://dx.doi.org/10.1023/A:1016048823497
Igbinomwanhia, D. I., & Aliu, S. A. (2013). Investigation of the continuing poor performance in engineering drawing in Nigerian universities – a case study of the University of Benin. Research Journal in Engineering and Applied Sciences, 2(5), 346- 350.
Jayasree, J. (2003). Keberkesanan grafik komputer dan latihan kemahiran spatial keatas pelajar lukisan kejuruteraan-satu kajian kes [Effectiveness of computer graphics and spatial skills training students on engineering drawing: A case study.]. Unpublished Masteral thesis, Universiti Teknologi Malaysia. Junaid, M. I. (2008). General introduction an address delivered on national commission for colleges of
education capacity building/ training of 800 teacher educators on the teaching of the core. Basic education subjects in south east zone of Awka.
Kabouridis, G. (2010). An innovative approach toward first-year mechanical engineering students’ conceptual difficulties in engineering design. World Transactions on Engineering and Technology Education WIETE, 8(3), 386-389.
Kember, D., & Leung, D. Y. (1998). Influences upon students’ perceptions of workload. Educational Psychology, 18(3), 293-307. http://dx.doi.org/10.1080/0144341980180303
Kennedy, O. O. (2011). Reappraising the work skill requirements for building technology education in senior secondary school for optimum performance in Nigeria. European Journal of Applied Sciences, 3(2), 46-52.
Kenpro. (2010). Effects of heredity and environment on Learning. Kenpro Online Papers Portal. Retrieved from http://www.kenpro.org/papers
Khandani, S. (2005). Engineering design process. Education transfer plan. Industry Initiatives for Science and Maths. Santa Clara, CA.
Kosse, V. (2005). Engineering drawing as a global language for engineers. In 4th ASEE/AAEE Global
Colloquium on Engineering Education (p. 1232). Australasian Association of Engineering Education. Kosse, V., & Senadeera, W. (2011). Innovative approaches to teaching engineering drawing at tertiary
institutions. International Journal of Mechanical Engineering Education, 39(4), 323-333. http://dx.doi.org/10.7227/IJMEE.39.4.5
Lindquist, M. M. (1980). Selected issues in mathematics education. Berkeley: McCutchan Publishing Corporation.
Lopez, F., Lent, R., Brown, S., & Gore, P. (1997). Role of socio-cognitive expectations in high school students’ mathematics-related interest and performance. Journal of Counseling Psychology, 441, 44-52. http://dx.doi.org/10.1037/0022-0167.44.1.44
Lupdag, R. A. (1977). Technique for measurement of attitudes. Englewood Cliffs, NJ: Prentice-Hall.
Malmivouri, M. (2006). Affect and self-regulation. Educational Studies in Mathematics, 63, 149-164. http://dx.doi.org/10.1007/s10649-006-9022-8
Marzano, R. J. (1992). A different kind of classroom: Teaching with dimensions of learning. Association for Supervision and Curriculum Development.
Mbugua, Z. K., Kibet, K., Muthaa, G. M., & Nkonke G. R. (2012). Factors contributing to students’ poor performance in mathematics at Kenya certificate of secondary education in Kenya: A case of Baringo country, Kenya. American International Journal of Contemporary Research, 2(6), 87-91.
Mbugua, Z. K., Kibet, K., Muthaa, G. M., & Nkonke, G. R. (2012). Factors contributing to students’ poor performance in mathematics at Kenya certificate of secondary education in Kenya: A case of Baringo country, Kenya. American International Journal of Contemporary Research, 2(6), 87-91.
McLaren, S. V. (2008). Exploring perceptions and attitudes towards teaching and learning manual technical drawing in a digital age. International Journal of Technology and Design Education, 18(2), 167-188. http://dx.doi.org/10.1007/s10798-006-9020-2
Midgley, C., Feldlauder, H., & Eccles, J. (1989). Student/teacher relations and attitudes toward mathematics before and after the transition to junior high school. Child Development, 60, 981-992.
http://dx.doi.org/10.2307/1131038
Millar, M. G., & Millar. K. U. (1996). The effects of direct experience on affective and cognitive responses and the attitude-behaviour relation. Journal of Experimental Social Psychology, 32(6), 561-579.
http://dx.doi.org/10.1006/jesp.1996.0025
Mohamed, L., & Waheed, H. (2011). Secondary students’ attitude towards mathematics in a selected school of Maldives. International Journal of Humanities and Social Science, 1(15), 277-281.
Mordi, C. (1991). Factors associated with pupils’ attitude towards science in Nigeria primary schools. Research in Science and Technology Education, 9(1), 39-49. http://dx.doi.org/10.1080/0263514910090104
Nagy-Kondora, R., & Sörösb, C. (2012). Engineering students' spatial abilities in Budapest and Debrecen. Annales Mathematicaeet Informaticae, 40, 187-201.
Narayana, K. L, Kannaiah, P., & Reddy, K. V. (2006). Machine drawing (3rd ed.). New Delhi: New Age International publishers.
Nwoke, G. I. (1993). Integrating computer technology into freshman technology, engineering, and architectural design and drafting courses. Collegiate Microcomputer, 11(2), 110-115.
Olkun, S. (2003). Making connections: Improving spatial abilities with engineering drawing activities. International Journal of Mathematics Teaching and Learning, 3(1), 1-10.
http://dx.doi.org/10.1501/0003624
Osborn, J. R., & Agogino, A. M. (1992). An interface for interactive spatial reasoning and visualization. In the Proceedings of the SIGCHI conference on human factors in computing systems (pp. 75-82). Monterey, California, United States. http://dx.doi.org/10.1145/142750.142762
Poon, W. C. A. (2007). Factors affecting learning attitudes and learning outcomes of secondary students. Unpublished Masteral thesis, University of Hong Kong.
Popham, W. (2005). Students’ attitudes count. Educational Leadership, 62(5), 84-85.
Potter, C. H., & Van der Merwe, E. (2003). Perception, imaginary, visualization and graphics. European Journal of Engineering Education, 28(1), 117-133. http://dx.doi.org/10.1080/0304379031000065216
Potter, C. H., Van Der Merwe, E., Kaufman, W., & Delacour J. (2006). A longitudinal evaluative study of student’s difficulties with engineering graphics. European Journal of Engineering Education, 31(2), 201-214. http://dx.doi.org/10.1080/03043790600567894
Radcliffe, D. F. (1998). Design engineering scholarship. In Waves of change: Proceedings of the 10th
Australasian conference on engineering education, 5th Australasian women in engineering forum, 5th National conference on teaching engineering designers (pp. 561-565). Central Queensland.
Reffold, C. N. (1998). Teaching and learning computer-aided engineering drawing. International Journal of Engineering Education, 14(4), 276-281.
Azodo, A. P.
Innovation.
Robert, J. F. (1993). Engineering drawing and graphic technology (14th ed.). McGraw- Hill Inc. Rohn, J. (2000). Attitude is everything. Retrieved from http://www.appleseeds.org/rohn-attitude.htm Roorda, J. (1994). Visual perception, spatial visualization and engineering drawing. Engineering Design
Graphics Journal, 58(2), 12-21.
Royster, D., Harris, M., & Schoeps, N. (1999). Dispositions of college mathematics students. International Journal of Mathematical Education in Science and Technology, 303, 317-333.
http://dx.doi.org/10.1080/002073999287851
Sabellah, M. (2010). The relationship between attitude and academic performance in chemistry among secondary school students. A case of Central Kisii district, Kenya. Unpublished Masteral thesis, Moi University Eldoret, Kenya.
Salau, M. A. (1996). Structural failures in collapse buildings. Paper presented at the Seminar on Building Failures in Nigeria organized the Nigerian society of Engineers, Lagos, Nigeria.
Shaeffer, S. (2006). Positive discipline in the inclusive, learning-friendly classroom: a guide for teachers and teacher educators. Bangkok: UNESCO.
Shiyan, Y. (2009). University student information accomplishment education connotation evolution and way exploration. Journal of Library and Information Sciences in Agriculture, 6, 169-171.
Simmons, R., Desyllas, J., & Nicholson, R. (2006). The cost of bad design. London: Ernest Bond.
Simpson, R. D. (1978). Assessing students behaviour in the cognitive domain. American Society of Engineering Education, 397-400.
Summers, G. F. (1977). Introduction. In G. F. Summers (Ed.), Attitude measurement (pp. 1-17). London: Kershaw Publishing Company,
Tapia, M., & Marsh, G. E. (2001). Effect of gender, achievement in mathematics, and grade level on attitudes toward mathematics. Paper presented at the Annual Meeting of the Mid-South Educational Research Association. Science, Mathematics, and Environmental Education.
Thomas, K. G. (1978). REDIGUIDE 7: Guides in educational research. University of Nottingham School of Education.
Topczewski, L., Fernandes, F. M., Cruz, P. J., & Lourenço, P. B. (2007). Practical implications of GPR
investigation using 3D data reconstruction and transmission tomography. Journal of Building Appraisal, 3(1), 59-76. http://dx.doi.org/10.1057/palgrave.jba.2950060
Ullman, D. G., Wood, S., & Craig, D. (1990). The importance of drawing in the mechanical design process. Computers & graphics, 14(2), 263-274. http://dx.doi.org/10.1016/0097-8493(90)90037-X
Valeriu, D. (2015). Factors generating of positive attitudes towards learning of the pupils. Procedia-Social and Behavioral Sciences, 180(1), 554-558. http://dx.doi.org/10.1016/j.sbspro.2015.02.159
Yara, P. O. (2009). Students attitude towards mathematics and academic achievement in some selected secondary schools in Southwestern Nigeria. European Journal of Scientific Research, 36(3), 336-341.
Yara, P. O. (2009). Students’ attitude towards mathematics and academic achievement in some selected
secondary schools in south-western Nigeria. European Journal of scientific research, 36(3), 336-341. Young, T. (1998). Student’s teachers’ attitudes towards science (STATS). Evaluation and Research in Education,