Effect of Melt Spinning Variables on the Structural Changes of
Recycled and Bottle Grade Filament Yarn PET
Marjan Abbasi
*, Mohammad Reza Mohaddes Mojtahedi, and Richard Kotek
Abstract- In the present work, recycled polyethylene
terephthalate (R-PET), virgin fiber grade PET (FG-PET)
and bottle grade PET (BG-PET) chips were spun on a high
spinning speed machine into filament yarns and the influence
of high-speed spinning process at the speeds of 3000 and 3500 m/min and the spinning temperatures of 280, 285 and 290 °C
on the fiber properties was studied. The increase in the take-up
speed increased the density, optical birefringence, crystal size, amorphous and crystal orientation, tenacity and initial
modulus of recycled-PET and bottle grade filament. The
study on the intrinsic viscosity (IV) showed that the recycling process resulted in decreasing the molecular weight of
polymers and narrowing the molecular weight distributions.
At higher spinning temperatures, the crystallinity, crystal size, tensile and intrinsic viscosity values decreased but the
shrinkage increased. In this part of the study, it was found
that the R-PET can be a good candidate for using in
high-speed melt spinning processes, and the filaments with proper confidants were received from the recycled-PET.
Keywords: filament, temperature, PET, recycling, melt
spinning
I. INTRODUCTION
P
ET fiber is the most ordinary building pieces for sustainable fabrics and high performance for low-weight, flexible, reduced-wind, and drag-resistant clothing and etc [1]. Many countries in the world are already trying to apply the best technologies from all perspectives, from virgin material to waste to producing new products [2]. According to new market predicts, global consumption ofM. Abbasi
Textile Engineering, Technical Department, University of Guilan, Rasht, Iran.
M.R. Mohaddes Mojtahedi
Textile Engineering Department, Amirkabir University of Technology, Tehran, Iran.
R. Kotek
College of Textile, North Carolina State University, Raleigh, NCSU, USA.
Correspondence should be addressed to M. Abbasi e-mail: [email protected]
PET bottle will grow to almost 19.1 million tons by 2017 [3]. Besides, the PET does not degrade for a long time in nature. However, unlike other plastic wastes, PET can be recycled into superior and useful end products [4]. One of the recycling methods of PET waste is re-melting. The most important problem in recycling of polyester fiber wastes is fiber degradation in different manners. Types of degradation occurring in re-extrusion of PET wastes can be noted as: thermal degradation, thermo-oxidative degradation, hydrolysis and mechanical degradation [5].
Post-consumer PET is obtained from PET bottles after process [6]. They are sorted by type (PET, HDPE, LDPE, etc.) and color. The PET bottles are then removed of their labels and caps and washed multiple times to take any adhesives and other possible contaminants. Next, the bottles are crushed and chopped into flakes. The small flakes are fed into an extruder [1]. The recycled PET and composite fibers of mixed waste streams, particularly those containing PET, are appropriate for applications in insulation, composite reinforcement, and textiles [7]. Furthermore, there is a poverty of research on the recycled-PET and bottle grade-recycled-PET spinning properties and filament yarn production [8].
Recycled-PET fibers have lower price by 20% compared to other fibers for the same physical characters. It is clear that cost advantage and being ecologically friendly of the fiber are main reasons for increasing recycled-PET fiber usage [9-10].
bottles was examined and the production was successfully performed [12]. Increasing of spinning speed to 3500 m/min and study of the behavior of the fibers at different spinning temperatures are the purposes of this research.
II. EXPERIMENTAL
A. Materials and Sample Production
Virgin PET chips with the IV of 0.6 and density of 1.38 g/cm3, recycled-PET material from irregular garbage bottle having the IV of 0.75 and density of 1.383 g/cm3 and bottle grade-PET chips having the IV of 0.82 and density of 1.40 g/cm3 were used as the starting materials in the first part of study. Recycled-PET was provided by Phoenix Technologies International, LLC Corp., USA and bottle grade-PET chips were obtained from Wellman Corp., USA. As-spun fiber grade-PET (FG-PET), recycled-PET (R-PET) and bottle grade-PET (BG-PET) filament yarns processed by a high-speed spinning machine at 3000 and 3500 m/min and spinning temperature of 285 °C in a Fourne Extruder (Germany) through a 12-hole spinneret and 3 denier/filament (dpf).
In order to study the effect of spinning temperature on recycled filament (R-PET) and FG-PET filament (as control), several samples of fibers were obtained in melt spinning machine at a winding speed of 1600 m/min and spinning temperatures of 280, 285 and 290 °C. A draw ratio of 3.2 was employed using a drawing machine. The optical birefringence was determined by an interference microscope (manufactured by Aus Jena in Germany).
The density values of samples are measured by Density Gradient Column at 23 °C. Density was obtained on little loops of the fiber. The column was filled with a mixture of n-heptane (r=1.28 g/cm3) and carbon tetrachloride (r=1.48 g/cm3), according to the ASTM D-1505. Crystallinity (Xd) was achieved from the following formula:
(1)
r is the measured fiber density from gradient column. ρc and ρam are the density of a completely amorphous and crystalline sample, respectively, for PET, ρc = 1.455 g/cm3 and ρam = 1.335 g/cm3 [13].
Intrinsic viscosity (IV) of PET was achieved using 40/60 mixture of 1,1,2,2-tetra chloroethan and phenol according to ASTM D4603. Molecular weight of samples was calculated from the two following equations. η is the intrinsic viscosity [14].
(2) (3)
The thermal analyses were carried out on a Pyris Series-Diamond differential scanning calorimeter. Between 3-5 mg of fiber sample or chip was used in each run. DSC curves were obtained in the first heating, in the temperature range of 25-270 °C and at a heating rate of 20 K/min. Crystallinity of samples was calculated from the following equation:
(4)
ΔHm notes to the measured melting enthalpy, ΔHc is the crystallization enthalpy induced during DSC test and ΔHref
refers to 100% crystalline polymer which in the case of PET equals to 140 ± 20 J/g [15].
Boil-off shrinkage of filament samples was obtained by measuring the length before (l0) and after (l) heating in boiling water according to ASTM method D-2259. The percent shrinkage was obtained using Eq. (3) [16]:
(5)
The wide-angle X-ray scattering (WAXS) analysis of the PET fiber samples was performed on a Siemens type F X-ray diffractometer equipped with a goniometer and a proportional count; a Nickel-filtered Cu kα radiation source with wavelength of 1.542 Å was used. The major peaks in the equatorial direction are: (010) at 2θ = 18°; (110) at 2θ = 23° and (100) at 2θ = 26°.
The crystallite orientation of PET can be defined by the three equatorial reflections (010), (110) and (100). By the Wilchinsky’s formula, the angle σ that these planes make with the c axis was calculated. The crystallite orientation in terms of Herman’s orientation function (fc) can be formalized in Eq. (6) [17]:
(6)
fc is 1 when the chains are perfectly oriented along the fiber axis, and fc is 0 when they are randomly oriented. The reflections (010), (110) and (100) are azimuthally scanned and the Herman orientation function is computed with the intensity index. Crystal sizes were specified from the Scherrer equation:
(7)
where Lhkl is the average inter planar distance (hkl), l is the
X-ray wavelength, q is the Bragg angle, and b is the width at half-maximum intensity of the pure reflection index in
the radians.
fa is the Herman orientation function for the amorphous regions, which can be determined from the birefringence am c
d
c am X = r − r ×r
r − r r
m c
DSC
ref
H H
X 100
H
D − D
= ×
D
(
2)
c 1
f 3 cos 1
2
= < σ > −
hkl L
.cos
l =
b q
4 0.73 n
3.72 10 (M )−
η = ×
4 0.68 w
4.68 10 (M )−
η = ×
0
0 I 1
Shrinkage (%) 100
I
−
measurements, applying the superposition principle proposed by Stein and Norrise [18]:
(8)
Where xn was calculated from the Eq. (9):
(9)
Dnc and Dna are the intrinsic birefringence of the crystalline and amorphous phases, respectively. Dna is 0.275 and Dnc is 0.22 [18].
The ultimate strength and elongation to rupture of individual filament sample were gained in a MTS Q-Test according to ASTM method D2256 [18]. The gauge length was 10 in (254 mm) and the crosshead speed was 300 mm/ min. The tenacity, initial modulus and elongation to rupture are an average of 10 individual measurements.
In order to evaluate the statistical comparisons between the various groups, SPSS software was used. Differences were considered statistically significant at P-value below 5% (p <0.05). Data from each test was reported as mean values ± standard deviations (SD).
III. RESULTS AND DISCUSSIONS
The SEM images of as-spun BG and R-PET filament yarn are shown in Fig.1.
The overall density of fiber samples was measured by gradient column technique. The density and crystallinity of the samples were calculated from the above mentioned formulas and they are shown as a function of the winding speed and spinning temperatures in Table I.
As can be found in the density loss data, the higher degradation of R-PET and BG-PET during the melt spinning process, may provide a suitable condition for
improved order of molecular structure that caused bigger crystallinity (P < 0.05).
The intrinsic viscosities of raw material and filament yarn samples were measured. The molecular weight of BG-PET and R-PET flacks is greatly higher than that of FG-PET chips as shown by their high intrinsic viscosity presented in Table III (P < 0.05).
c c a
a
n x n f f
n (1 x )n n D − D =
D −
a c a
xn
r − r =
r − r
Samples Spinning speed (m/min) temperature (°C)Spinning Density(g/cm3)
Density loss (%)
(compared to the starting material) Crystallinity, X (%) d
FG1 3000 285 1.35 2.17 13.47
FG2 3500 285 1.35 2.17 13.47
R1 3000 285 1.34 2.96 6.32
R2 3500 285 1.35 2.53 11.70
BG1 3000 285 1.36 2.86 22.29
BG2 3500 285 1.37 2.36 28.40
FG⃰ 1600 285 1.36 1.23 24.91
R1⃰ 1600 280 1.36 1.52 24.04
R2 ⃰ 1600 285 1.36 1.74 21.41
R3 ⃰ 1600 290 1.36 2.03 17.90
TABLE I
DENSITY AND CRYSTALLINITY OF FG, R, AND BG-PET YARN SAMPLE FILAMENT, MEASURED AT VARIOUS WINDING SPEEDS AND SPINNING TEMPERATURES
* Fiber was drawn at a draw ratio of 3.2
(b)
Fig. 1. SEM image of as spun filament yarn: (a) BG-PET and (b) R-PET.
In the study of molecular weight degradation of FG-, BG- and R-PET, there are four significant variables [20] including melt temperature, environment of the melt, time in the melted-state, and drying conditions. All the conditions were the same for all spun yarns, so we measured one sample for each yarn. The IV study showed that the molecular weight reduced with the recovery process, and
as the Mw/Mn values demonstrated the molecular weight distribution (MWD) became narrower. The degradation of R-PET molecular structure because of thermal, hydrolytic and chemical agents was confirmed by the IV analysis. Besides, the re-processed R-PET filament yarns had lower molecular weight [27], higher amorphous content and shorter molecular chains that resulted in a low orientation in their molecular structure [21].
A summary of the intrinsic viscosity, molecular weight and distribution data of recycled yarns at different spinning temperatures are displayed in Table III. A sign of changes in the molecular weight and possible degradation during melt spinning process is observed, when the temperature increases, and the molecular weight and IV of polymers decrease (P < 0.05). The results show low thermal stability of sample during process. According by the Hergenrother’s report [22], this can be attributed to the copolymer modification effect in making of original bottles. Also melt temperature is one of the important variables affecting the molecular weight degradation of PET [20]. Table III indicates the changes in the intrinsic viscosity of R-PET with melt spinning temperature.
The optical birefringence values (Δn) of the filament yarns are presented as a function of wind-up speed in Table IV. The results show the increase in the birefringence with increase in the take-up speed (P < 0.05), which is due to increasing amorphous and crystal orientation (Table V). The orientation of molecules obtained from the optical birefringence measurements does not indicate the change in molecular orientation with temperature. The increase in the amorphous orientation factor and the decrease in the crystal orientation factor with increasing spinning temperature (Table V) may cause no overall orientation changing in birefringence.
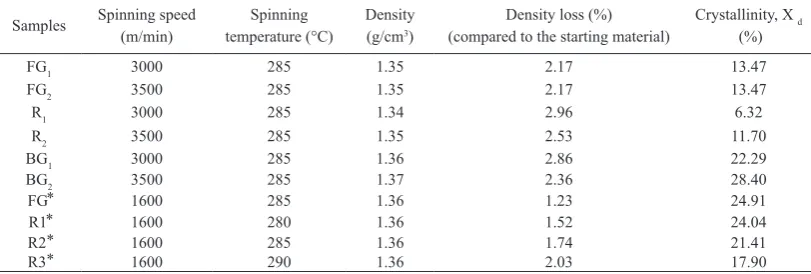
The equatorial X-ray diffraction traces are given for FG-, R- and BG-PET in Fig. 2 with increasing take-up speed. The traces in FG-and R-PET do not display any advantage of the take-up speed on the crystalline structure. They only
R-PET spun fiber R-PET chips FG-PET spun fiber FG-PET chips BG-PET spun
fiber BG- PET
chips Properties 0.61 0.75 0.55 0.6 0.68 0.82 IV (dL/g) 25336 33631 21983 24773 29407 38004 Mn 38177 72375 32860 37192 62663 82523 Mw 1.51 2.15 1.49 1.50 2.10 2.17 MWD IV loss (%) MWD
Mw*
(g/mol) Mn*
(g/mol) IV (dL/g) Spinning temperature (°C) Sample 6.67 1.49 33604 22539 0.56 285 FG ⃰ 7.14 1.51 41838 27644 0.65 280
R1 ⃰
18.57 1.49 34490 23092 0.57 285
R2 ⃰
28.57 1.47 28445 19298 0.50 290
R3⃰
TABLE II
INTRINSIC VISCOSITY AND MOLECULAR WEIGHT ANALYSES OF STARTING MATERIALS AND FIBERS SPUN AT WINDING SPEED OF 3000 m/min
TABLE III
INTRINSIC VISCOSITY AND MOLECULAR WEIGHT ANALYSES OF R-PET SPUN FILAMENT WITH SPINNING TEMPERATURES IN WINDING SPEED OF 1600 m/min AND DRAWN AT THE DRAW RATIO OF 3.2
* Fiber was drawn at a draw ratio of 3.2
Mn: number average molecular weight, Mw: weight average molecular weight, MWD: molecular weight distribution
Samples Spinning speed(m/min) Optical birefringence(×102 )
FG1 3000 5.6
FG2 3500 6.0
R1 3000 6.0
R2 3500 6.4
BG1 3000 8.0
BG2 3500 8.4
TABLE IV
OPTICAL BIREFRINGENCE OF FILAMENT YARN SAMPLES AT HIGH SPINNING SPEEDS AND AT THE SPINNING
give rise to wide unresolved traces for BG-PET wound at 3000 and 3500 m/min, well resolved patterns are found. As, according to Scherrer’s formula, narrow peaks are related to crystals which are large in direction perpendicular to the crystal plane involved, it can be deduced that the crystals lateral size in the samples take up at high spinning speed are relatively truly developed.
The apparent crystal size perpendicular to that particular crystal plane from the half-width of the X-ray reflection can be computed. Table V shows the crystal size perpendicular to the plane (010) after two take-up speeds for all samples and at different spinning temperatures for R-PET. It is observed that the crystal size increases as the take-up speed increases (P < 0.05). This is due to the perfection of crystals during spinning speed. These tables also show that amorphous and crystal orientation increase with an increase with take-up speed which points that crystalline phase improvement overcome in the development of orientation by birefringence (Table IV).
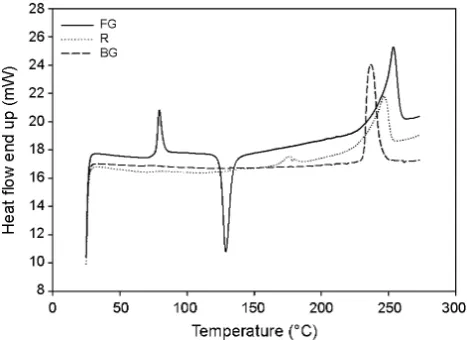
In the case of different spinning temperatures for R-PET, it was found that the crystal size and crystal orientation factor decrease and amorphous orientation factor increase with an increase in the spinning temperature. Also, the results show that the average of crystal size and crystal orientation of R-PET at 280 and 285 °C are nearly the same as those of FG-PET at the standard spinning temperature of 285 °C (as control). For R-PET, it seems that increasing the spinning temperature leads to degrade the polymer crystalline region and disrupt the crystal orientation. Crystal orientation was measured by the three equatorial reflections (010), (110) and (100). From this information, the crystalline orientation factor was calculated by means of the Hermans method, and the orientation of crystalline regions could be easily measured by the X-ray diffraction technique, while the measurements of non-crystalline orientation was not easily performed [23]. The DSC thermograms of raw materials are indicated in Fig. 3. Thermal properties and degree of crystallinity gained from the DSC thermograms are resumed in Table VI.
Since the molecular weight of BG- and R-PET was higher than that of FG-PET chips, the melting point of these two polymers may have been expected to be higher than that of FG-PET chips. However, the melting temperature of BG- and R-PET is slightly lower than that of FG-PET. This may be attributed to the existence of co-monomer (isophthalic acid) in BG- and R-PET [3]. The presence of isophthalic acid in the polymer (co-polyester) caused to the formation of an amorphous structure which led to the reduction of melting temperature and polymer crystallinity [24].
The DSC results for FG-, R- and BG-PET melt spun (a)
(b)
(c)
yarns as a function of take-up speed are shown in Table VII. Increasing the take-up speed led to a higher crystallinity for all samples (P < 0.05). The DSC thermograms of FG-, R- and BG-PET filament yarns as a function of spinning speed are shown in Fig. 3. The crystallization peaks of FG- and R-PET have shifted to lower temperatures. With increasing the take-up speed the melting temperature is increased and the area under the melting curve is expanded. BG- and
R-PET have a wide range of melting temperature but the FG-PET sample does not have. This may be reflection of wider crystal size distributions of these polymers. As the results in Table VII show, the crystallinty of samples decreases with increasing the spinning temperature. This could be attributed to the decrease of tension in the spinning line and the reduction of molecular orientation.
Indeed, the density and DSC measurement methods gave different crystallinity values due to the fact that each method has its own set of limitations and assumptions. Although, the crystallinity obtained by DSC is higher than that obtained by the density technique but the tendency obtained from them is the same.
The tensile properties and shrinkage of samples are presented as a function of winding speed and spinning temperature in Table VIII. There is an advanced increase in the tenacity and initial modulus of filament yarns with an increase in winding speed (P < 0.05). Furthermore, lower tenacity of FG-PET may be related to higher molecular weight of R- and BG-PET, which may assist better orientation during spinning. Initial modulus is usually highly relevant to crystallinity percentage, crystal size, crystallite and amorphous orientation, and can be predicted by Samuels’ two-phase model [25]. For all samples Samples Spinning speed
(m/min)
Spinning temperature (°C)
Apparent crystal size A*010 (Å)
Orientation factors
fc fa
FG1 3000 285 15.93 0.19 0.21
FG2 3500 285 18.98 0.15 0.23
R1 3000 285 39.28 0.32 0.30
R2 3500 285 19.16 0.22 0.23
BG1 3000 285 19.8 0.24 0.24
BG2 3500 285 78.55 0.37 0.31
FG ⃰ 1600 285 31.98 0.59 0.40
R1 ⃰ 1600 280 31.87 0.64 0.41
R2 ⃰ 1600 285 27.41 0.56 0.43
R3 ⃰ 1600 290 15.92 0.53 0.44
TABLE V
RESULTS FROM QUANTITATIVE ELABORATION OF WAXD EXPERIMENTS FOR YARN SAMPLES PRODUCED AT VARIOUS SPINNING SPEEDS AND SPINNING TEMPERATURES
* Fiber was drawn at a draw ratio of 3.2
Crystallinity, XDSC
(%) Melting
enthalpy (J/g) Crystallization
enthalpy (J/g) Melting
temperature (°C) Crystallization
temperature (°C) Glass transition
temperature (°C) Starting
material
7.58 37.69
27.08 254
129 79
FG- PET
24.60 34.37
----246
----76
R- PET
39.80 55.72
----239
----75
BG- PET
TABLE VI
produced at higher take-up speed, increasing the crystallinity resulted in the yarns with higher initial modulus. Although, higher values of initial modulus of R-PET sample are not in accordance to their lower crystallinity values, but the
crystal sizes of R- and BG-PET yarns are slightly bigger than those of FG-PET samples (Table V).
In Table VIII, the boiling water shrinkage of this study decreases with increasing take-up velocity. It seems that Samples Spinning speed (m/min) temperature (°C)Spinning temperature (°C)Melting Crystallization enthalpy (J/g) enthalpy (J/g)Melting Crystallinity, XDSC
(%)
FG1 3000 285 249 13.2 40.8 19.7
FG2 3500 285 251 11.9 42.9 22.1
R1 3000 285 242 9.1 34.7 18.2
R2 3500 285 243 8.7 37.3 20.4
BG1 3000 285 245 5.7 37.5 22.7
BG2 3500 285 251 3.5 38.8 25.2
FG ⃰ 1600 285 250 5.2 46.9 29.8
R1 ⃰ 1600 280 243 1.1 44.5 31.0
R2 ⃰ 1600 285 242 1.2 44.4 30.8
R3 ⃰ 1600 290 243 4.7 38.2 24.0
Samples Spinning speed(m/min) temperature (°C)Spinning Tenacity(gf/den) Strain(%) Modulus(gf/den) Shrinkage(%)
FG1 3000 285
2.13
±0.13 102.89±3.28 29.52±1.61 66.10±0.33
FG2 3500 285
2.82 ±0.18
96.41 ±4.2
31.36 ±1.10
60.65 ±0.24
R1 3000 285
2.59
±0.14 109.56±5.41 29.80±0.62 61.75±0.34
R2 3500 285
2.80 ±0.11
91.47 ±3.28
37.75 ±1.11
56.10 ±0.93
BG1 3000 285
2.69
±0.12 59.00±6.25 67.22±2.67 ±0.3568.7
BG2 3500 285
3.16 ±0.7
76.16 ±2.91
56.36 ±1.46
60.32 ±0.55
FG ⃰ 1600 285 ±0.332.83 67.66±6.40 56.59±5.54 27.20±0.42
R1 ⃰ 1600 280
2.83
±0.33 52.51±6.58 70.80±2.73 14.75±1.41
R2 ⃰ 1600 285
3.18 ±0.21
55.30 ±5.55
66.50 ±3.19
16.00 ±0.28
R3 ⃰ 1600 290
3.12 ±0.18
62.38 ±3.30
61.84 ±2.05
18.29 ±4.5 TABLE VII
THERMAL PROPERTIES OF FILAMENT YARN SAMPLES PRODUCED AT HIGH SPINNING SPEEDS AND VARIOUS SPINNING TEMPERATURES
* Fiber was drawn at a draw ratio of 3.2
± is the standard deviation
* Fiber was drawn at a draw ratio of 3.2
TABLE VIII
the shrinkage variation as a function of take-up speed is related to the crystallinity change as seen in Table VII. In fact, higher molecular orientation creates a higher entropic force and ordered molecules can shrink without any preventive like crystals and shrinkage increases with increasing up speed. Above the critical take-up velocity, gained crystals repellent the shrinkage of molecules in the amorphous region, and thus shrinkage reduces with increasing crystallinity [21,26]. In the FG- and R-PET fibers, polymer orientation has more effect than crystallinity, whereas in the case of BG fibers, the effect of crystal size on the reduction of shrinkage with increasing take up speed is probably more than that of orientation.
Table VIII also shows tensile stress and boil of shrinkage properties of R-PET fiber with increasing spinning temperature. There is a decrease in the tenacity and initial modulus of samples with an increase in temperature spinning. Tenacity, breaking elongation and modulus are firmly related to the polymer molecular weight (Table III). The decrease in R-PET crystal size also confirms the lower initial modulus of the R-PET, which was produced at the higher temperature. Increasing the spinning temperature improved the amorphous orientation and decreased the crystal orientation factor as shown Table V. Therefore, it can be concluded that the shrinkage changes as a function of temperature can be directly predicted by the predicted by the varations of orientation factor. The higher molecular orientation results in a higher entropic counteraction force and the oriented molecules can actually shrink without any limitation. Besides, at the spinning speeds more than 1000 m/min, the shrinkage of high molecular weight PET is lower than that of low molecular weight PET [22]. Control sample (FG-PET in standard spinning temperature in 285 °C) simply shows the effect of molecular weight. Table III also illustrates the effect of temperature on the molecular weight.
IV. CONCLUSIONS
The spinning behaviour of R-PET and BG-PET was studied at the high-speed spinnings of 3000 and 3500 m/min and the melt spinning of R-PET was also investigated at different spinning temperatures of 280, 285 and 290 °C. The density, birefringence, crystal size, and crystal and amorphous orientation factors were increased by increasing spinning speed. The higher tenacity of the R- and BG-PET filament yarns produced at the higher take-up speed was consistent with their orientation, but the initial modulus and shrinkage results were not perfectly consistent with the crystallinity results.
The increase in spinning temperature improved the
amorphous orientation and decreased the crystal size and crystal orientation factor. It was also found that the shrinkage increased as the amorphous orientation factor increased. The results showed that the average of crystal size and crystal orientation of R-PET at 280 and 285 °C are nearly the same as those of FG-PET at the standard spinning temperature of 285 °C (as control). It seemed that the increase in the spinning temperature of R-PET caused to degrade the crystalline region and decrease the crystal orientation factor. The lower tenacity of the R-PET produced at the higher temperature was due to molecular degradation. The lower initial modulus of the yarns produced at the higher spinning temperature was confirmed by their crystallinity and crystal size values.
ACKNOWLEDGMENT
We wish to express our appreciation and thanks to Phoenix Technologies International, LLC Corp., USA, for their sincere assistance to provide the recycled PET materials used in this study.
REFERENCES
[1] R. Shah, “Advanced filtration technology enables the production of high-quality recycled PET fibers for the texile industry”, Inter. Fiber J., [online], 2013. Available:
http://www.fiberjournal.com
[2] A. Ashjaran and R. Azarmi, “Survey on common bio fibers and polymers in recyclable textiles”, JOCPR.,
vol. 7, no. 3, pp. 202-208, 2015.
[3] Smithers Pira Market Intelligence The Future of Global PET Packaging to 2017. Available:
https://www.smitherspira.com/future-of-global-pet-packaging-to-2017.aspx 2012.
[4] K. Gurodatt, P. De, A.K. Rakshit, and M.K. Bardhan, “Spinning fibers from poly(ethylene terephthalate) bottle-grade waste”, J. Appl. Polym. Sci., vol. 90, pp. 3536-3545, 2003.
[5] S. Altun and Y. Ulcay, “Improvement of waste recycling in PET fiber production”, J. Polym. Env.,
vol. 12, pp. 231-237, 2004.
[6] A. Telli and N. Ozdil, “Lint generation of the yarns produced recycled PET fibers”, In: International Congress Innovative Textiles, Corlu, Turkey; pp. 32-35, 2011.
[7] A. Telli and N. Özdil, “Properties of the yarns produced from r-PET fibers and their blends”, Tekstil ve Konfeksiyon, vol. 23, pp. 3-10, 2013.
spinning”, Materials (Basel)., vol. 10, no. 9, pp. 1-13,
2017.
[9] A. Telli and N. Özdil, “Effect of recycled PET fibers on the performance properties of knitted fabrics”, J. Eng. Fiber Fabr., vol. 10, pp. 47-60, 2015.
[10] E. Sarioglu, “Ecological approaches in textile sector: the effect of r-PET blend ratio on ring spun yarn tenacity”, PEN, vol. 5, no. 2, pp. 176-180, 2017.
[11] M. Abbasi, M.R.M. Mojtahedi, and A. Khosroshahi,
“Effect of spinning speed on the structure and physical properties of filament yarns produced from used PET bottles”, J. Appl. Polym. Sci., vol. 103, pp. 3972-3977,
2006.
[12] M. Abbasi, M.R.M. Mojtahedi, and R. Kotek, ISPST
2012, Amirkabir University of Technology, Tehran,
Iran, 2012.
[13] ASTM D-1505, Standard Test Method for Density of Plastics by the Density- Gradient Technique.
[14] ASTM D-4603, Standard Test Method for Determining Inherent Viscosity of Poly(ethylene terephthalate) (PET) by Glass Capillary Viscometer.
[15] H.G. Elias, Macromolecules, 1 sted., vol. 1, USA: Springer, 1977.
[16] ASTM D-2259, Standard Test Method for Shrinkage of Yarns.
[17] Z.W. Wilchinsky, “Measurement of orientation in polypropylene film”, J. Appl. Polym. Sci., vol. 31, pp. 1969-1972, 1960.
[18] R.S. Stein and F.H. Norris, “The x-ray diffraction, birefringence, and infrared dichroism of stretched polyethylene”, J. Polym. Sci., vol. 21, pp. 381-396, 1956.
[19] ASTM D-2256, Standard Test Method for Tensile Properties of Yarns by the Single- Strand Method.
[20] S.A. Jabarin and E.A. Lofgren, “Thermal stability of poly(ethylene terephthalate)”, Polym. Eng. Sci, vol. 24, pp. 1056-1063, 1984.
[21] N.K. Barman, S.S. Bhattacharya, and A.A. Mandot, “Mechanical properties of melt-spun monofilaments produced from virgin and recycled poly(ethylene terephthalate) blends”, IJRSR, vol. 6, pp. 4517-4525, 2015.
[22] W.L. Hergenrother, “Influence of copolymeric poly(diethylene glycol) terephthalate on the thermal stability of poly(ethylene terephthalate)”, J. Polym. Sci. Pol. Chem., vol. 12, pp. 875-883, 1974.
[23] S.K. Pal and R.S. Gandhi, “Influence of texturing parameters on structural properties of micro fiber polyester yarn”, Chem. Fibers Int., vol. 45, pp. 418-420, 1995.
[24] J. Ubach, A.M. de Ilarduya, R. Quintana, A. Alla, E. Rudé, and S. Muñoz-Guerra, “Poly(ethylene terephthalate-co-isophthalate) copolyesters obtained from ethylene terephthalate and isophthalate oligomers”, J. Appl. Polym. Sci., vol. 115, no. 3, pp.
1823–1830, 2010.
[25] V.B. Gupta and S. Kumar, “The effect of heat setting on the structure and mechanical properties of poly(ethylene terephthalate)”, J. Appl. Polym. Sci.,
vol. 26, pp. 1877-1884 , 1981.
[26] J.Y. Lim and S.Y. Kim, “Properties of high-speed spun high molecular weight poly(ethylene terephthalate) filaments”, J. Appl. Polym. Sci., vol. 71, pp. 1283-1291, 1999.