doi: 10.5455/2319-2003.ijbcp20141221
IJBCP International Journal of Basic & Clinical Pharmacology
Research Article
A study of drug prescribing pattern using WHO prescribing indicators
in the state of Goa, India
Ulhas K. Chandelkar
1*, Padmanabh V. Rataboli
2INTRODUCTION
The quality of life in developing countries can be improved by enhancing the standards of medical treatment at all levels of the health care delivery system.1 To promote rational drug use in developing countries, it is important to assess drug use pattern using the World Health Organization (WHO) drug use
indicators. Rational drug prescribing is defined as “the use of
the least number of drugs to obtain the best possible effect in the shortest period and at a reasonable cost.”2 Measurement of drug use in health facilities not only describes drug use patterns and the behavior of prescribers but also helps in the
identification of polypharmacy and the problems associated
with it.3 Such information can prove useful to medical profession, public health administrators as well as to the society at large. A constant self-assessment of prescriptions can be made and improvement thereof can be tried by an individual.
“Essential medicines” - A concept adopted by WHO in 1977 were defined as “those that satisfy the priority healthcare
needs of the population.” They are selected with due
regard to public heath relevance, evidence on efficacy and
safety, and comparative cost effectiveness.” India produced
its National Essential Drugs list (EDL) in 1996 and has revised it in 2011 with the title “National List of Essential Medicines” (NLEM). This include 348 medicines which are
considered to be adequate to meet the priority healthcare needs of the general population of the country.4
An inappropriate prescribing pattern by doctors often encourages inappropriate self-medication by patients because of the asymmetry of medical information.1 The attitude today is the root on which the future grows. Hence, it is generally agreed that the teaching hospitals have a special responsibility to society to promote rational prescribing
ABSTRACT
Background: The quality of life in developing countries can be improved by enhancing the standards of medical treatment at all levels of the health care delivery system. Teaching hospitals have a special responsibility toward society to promote rational prescribing by their staff and, through them, the future generations of doctors. Methods: A sample of 1000 patient prescriptions was assessed retrospectively to assess the drug prescription patterns in the state of Goa.
Results: Of 1842 drug products prescribed, the average number of drugs per prescription was 1.842. The total number of drugs prescribed by generic name was 1 (0.05%). An antibiotic was prescribed in 318 patient encounters (31.8%). Almost all drugs prescribed (n=1842, 99.67%) were on the essential drug list of India. During the study period, antibiotics were prescribed the most (n=318, 17.26%), followed by drug for cardiovascular system (n=265, 14.39%) and gastrointestinal tract (n=238, 12.92%).
Conclusions: Baseline data gathered by this study can be used by researchers and policymakers. Further the problem-based basic training in pharmacotherapy; targeted continuing education can prove useful to medical profession to improve prescribing practice and public health administrators for promoting effective rational drug use.
Keywords: Prescribing pattern, Prescribing indicators, National list of essential medicines, Polypharmacy
1Assistant Professor,
Department of Pharmacology, Goa Medical College, Bambolim, Goa, India, 2Director, Professor,
Department of Pharmacology, Goa Medical College, Bambolim, Goa, India
Received: 01 October 2014 Accepted: 15 October 2014
*Correspondence to: Dr. Ulhas K. Chandelkar,
Email: [email protected]
Copyright: © the author(s), publisher and licensee Medip Academy. This is an open-access article distributed under the terms of the Creative Commons Attribution
Non-Commercial License, which
by their staff and, through them, the future generations of doctors.5
Further, to increase prescription quality and improve the rationality of drug use, we need to investigate the subjective and objective factors that affect doctors’ prescription patterns.6
Aim
The aim of this study was to assess the drug prescription patterns in the state of Goa (India).
METHODS
A quantitative and cross sectional study was conducted in the month of April 2014 to determine the current prescribing practices in the state of Goa (India). According to the WHO
document “How to investigate drug use in health facilities,”
at least 600 encounters should be included in a cross-sectional survey to describe the current prescribing practices, with a greater number, if possible.6 For this particular study a total of 1000 prescriptions were collected retrospectively from more than 3000 prescriptions written in the month
of April 2014. Commonly used drugs were classified and
divided into 23 groups depending upon their primary effect
and use. All data were first analyzed manually and then using Microsoft Excel 2007. In the statistical analysis, frequencies,
averages/means and percentages were obtained.
Prescribing indicators
The WHO prescribing indicators with slight modifications
were used in this study.7
The prescribing indicators that were measured included:
1. The average number of drugs prescribed per encounter was calculated to measure the degree of polypharmacy. It was calculated by dividing the total number of different drug products prescribed by the number of encounters surveyed. Combinations of drugs prescribed for one health problem were counted as one
2. Percentage of drugs prescribed by generic name is calculated to measure the tendency of prescribing by generic name. It was calculated by dividing the number of drugs prescribed by generic name by total number of drugs prescribed, multiplied by 100
3. Percentage of encounters in which an antibiotic was prescribed was calculated to measure the overall use of commonly overused and costly forms of drug therapy. It was calculated by dividing the number of patient encounters in which an antibiotic was prescribed by the total number of encounters surveyed, multiplied by 100 4. Percentage of encounters with an injection prescribed
was calculated to measure the overall level use of commonly overused and costly forms of drug therapy. It was calculated by dividing the number of patient
encounters in which an injection was prescribed by the total number of encounters surveyed, multiplied by 100
5. Percentage of drugs prescribed from an NLEM was
calculated to measure the degree to which practices conform to a national drug policy as indicated in the national drug list of India. Percentage is calculated by dividing number of products prescribed, which are
in NLEM by the total number of drugs prescribed,
multiplied by 100.
Operational definitions
a. Generic drugs: NLEM was used as a basis to determine and confirm the generic name of a drug
b. Antibiotics: Drugs such as antibacterial,
anti-infective dermatological drugs, and anti-anti-infective ophthalmological agents, anti-diarrheal drugs with streptomycin, neomycin, and metronidazole are
considered antibiotics when used in the context of
antibiotics
c. Combination of drugs: Two or more drugs that are
prescribed for a given health condition is counted as one
d. Miscellaneous drugs: Oral rehydration salts, diagnostic
kits were included as miscellaneous drugs.
Ethical consideration
Approval was obtained from the Institutional Ethics
Committee, Goa Medical College, Bambolim, Goa (India).
RESULTS
A sample of 1000 patient encounters/prescriptions was assessed retrospectively written in the month of April 2014 in the state of Goa (India).
A total of 1842 drug products were prescribed. Thus, the average number of drugs per prescription or mean was 1.842
with a range between 1 and 6. The total number of drugs prescribed by generic name was 1 (0.05%). An antibiotic
was prescribed in 318 patient encounters (31.8%). Almost all drugs prescribed (n=1842, 99.67%) were included in the NLEM of India (Table 1).
Out of the total drugs prescribed (n=1842) during our study,
the percentages of drugs prescribed by oral, parenteral and
topical route were 84.58%, 9.77% and 5.65% respectively
(Table 2 and Figure 1).
Most of the prescriptions had either 1 (51.9%) or 2 (27.1%) drugs prescribed in them. Maximum drugs prescribed in a prescriptions were 6 (1.3%), followed by 5 (2.8%), 4 (5.6%)
and 3 (11.3%) (Figure 2).
During the study period, antibiotics were the most drugs
DISCUSSION
In this study, average number of drugs prescribed per
encounter was 1.8 with a maximum of 6 drugs, which is within the range as compared with the standard (1.6-1.8)
derived as ideal8 and is acceptable compared with the WHO’s
recommended value of 1.3-2.0.6
In this study, average number of drugs prescribed is
much lower than the relevant domestic research findings of Upadhyay et al. (3.76) and Raj et al. (4.98) as well as findings in other countries by Shankar et al. (3.39), Wang
et al. (3.52), Xinyi et al. Baotou, Inner Mongolia (2.7),
Lianzhen et al. Beijing (2.63), Hua et al. Guangdong (2.36), Daohai et al. Guangxi (1.95) provinces and Bimo Nigeria (3.8).1,6,9-15
Further in comparison with a similar study of drug use pattern in 12 developing countries, the average number of drugs per encounter in our study is higher as compared to Sudan (1.4) and Zimbabwe (1.3).16,17
The percentage of drugs prescribed by generic name in our study is 0.05%, which is too low compared with the standard derived to serve as an ideal (100%).8
[image:3.595.51.289.108.218.2]Compared with other studies; the indicator was significantly low than in other studies in India (15.1%), Nigeria (49.3%),
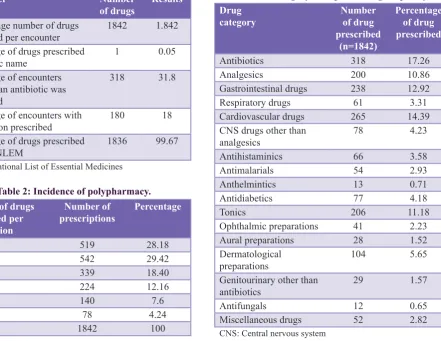
Table 2: Incidence of polypharmacy.
Number of drugs prescribed per prescription
Number of
prescriptions Percentage
1 519 28.18
2 542 29.42
3 339 18.40
4 224 12.16
5 140 7.6
6 78 4.24
[image:3.595.51.287.247.378.2]Total 1842 100
Table 3: Category‑wise prescribing frequency.
Drug
category Number of drug
prescribed (n=1842)
Percentage of drug prescribed
Antibiotics 318 17.26
Analgesics 200 10.86
Gastrointestinal drugs 238 12.92
Respiratory drugs 61 3.31
Cardiovascular drugs 265 14.39
CNS drugs other than
analgesics 78 4.23
Antihistaminics 66 3.58
Antimalarials 54 2.93
Anthelmintics 13 0.71
Antidiabetics 77 4.18
Tonics 206 11.18
Ophthalmic preparations 41 2.23
Aural preparations 28 1.52
Dermatological
preparations 104 5.65
Genitourinary other than
antibiotics 29 1.57
Antifungals 12 0.65
Miscellaneous drugs 52 2.82
[image:3.595.53.287.423.591.2]CNS: Central nervous system
Table 1: Prescribing indicators.
Parameter Number
of drugs Results
The average number of drugs
prescribed per encounter 1842 1.842 Percentage of drugs prescribed
by generic name 1 0.05
Percentage of encounters in which an antibiotic was prescribed
318 31.8
Percentage of encounters with
an injection prescribed 180 18
Percentage of drugs prescribed
from an NLEM 1836 99.67
NLEM: National List of Essential Medicines
Figure 1: Percentage of drugs prescribed by specific route.
Figure 2: Percentage of drugs prescribed per prescription.
[image:3.595.95.537.430.771.2] [image:3.595.53.288.628.768.2]Sri Lanka (78%), Loas (78%), Ethiopia (87%), and South Ethiopia (98.7).5,18-21
Wang et al. found that with the increase in doctor’s
education and training experience on rational drug use,
and improvement of their pharmaceutical knowledge, the proportion of drugs prescribed with generic names by doctors showed a slight decrease.6 Possible reason for low presentation by generic names could be due to impressive and continuous communication with the doctor by pharmaceutical companies which made the doctors more likely to use non-generic (brand) names than generic names.
Percentage of antibiotics prescribed was 31.8% that is close to the standard (20-26.8) derived to be ideal.8 Though
it is higher than Yemen (24.6%), Saudi Arabia (20%) and
China (29.9%)6,22,23 it was lower than Laos (47%), Sri Lanka
(47%), Zimbabwe (58%), South Ethiopia (58%) and Nigeria (72.8%).5,19,20,24,25
This is an unprecedented trend of prescribing antibiotics for
all infections including viral conditions like cold and flu. This reflects the misuse of antibiotics in our study where the maximum number of prescriptions belonged to the
antibiotic category.
The percentage of encounter in which injections were
prescribed was 18% (n=180) which is within the range of
the standard (13.4-24.1) derived to serve as ideal8 and is
almost equivalent to Indonesia (17%) and Ecuador (17%).26,27
It significantly lower compared with Sudan (36%), South Ethiopia (38.1%) and Uganda (48%).5,15,16 In our study, injection prescribed were higher than in similar study by Raj et al (14.15%)10 and by Shankar et al. (7.98%).1
The percentage of drugs prescribed from the NLEM during our study period in the state of Goa (India) was 99.67%,
which is almost similar to cross sectional study in south
Ethiopia (99.6) and is identical with the standard (100%)
derived to serve as ideal,8 as well as a National baseline
study on drug use indicator in Ethiopia (99.%).21 In our study,
drugs prescribed from the NLEM is high when compared to
prescription pattern in a similar study in India by Raj et al.
(31.36%), Nepal (88%), Tanzania (96%), and South Ethiopia (96.6%).5,10,26,28
CONCLUSION
Based on the finding of this study, the prescribing practices
for antibiotic and drugs by generic names show deviation from the standard recommended by WHO. As antibiotics are prescribed the most in our study, one needs to keep watch on usage of antibiotics in order to avoid resistance. On the other hand, prescribing injections and prescribing
from NLEM were not found to be a problem in this
study. Baseline data gathered by this study can be used by researchers and policymakers to improve prescribing practice. Several activities have proved useful and effective
in promoting rational drug use and should be recommended for general use. These are Standard Treatment Guidelines,
EDL, Establishing Drug and Therapeutic Committee,
problem-based basic training in pharmacotherapy, drug use evaluations, targeted continuing education and availability, accessibility, and affordability of drugs of a good standard. Drug information centers and drug bulletins can be started for reference from time to time. Care is, of course, necessary to implement and ensure success.
Funding: No funding was taken for this study Conflict of interest: No conflict of interest
Ethical approval: Approval was obtained from the Institutional Ethics Committee, Goa Medical College, Bambolim-Goa (India)
REFERENCES
1. Shankar R, Partha P, Shenoy N. Prescribing patterns of drugs among patients admitted with cardiovascular disorders in the
internal medicine ward: prescribing patterns in inpatients.
Internet J Pharmacol. 2001;1(2).
2. Gross F. Drug utilization - theory and practice. The present
situation in the Federal Republic of Germany. Eur J Clin Pharmacol. 1981;19(6):387-94.
3. WHO. Action Programme for Essential Drugs. How to Investigate Drug use in Health Facilities. Geneva: WHO; 1993.
4. Tripathy KD. Essentials of Medical Pharmacology.
7th Edition. New Delhi: Jaypee Brothers Medical Publishers (P) Ltd.; 2013:4.
5. Desalegn AA. Assessment of drug use pattern using WHO prescribing indicators at Hawassa University teaching and
referral hospital, south Ethiopia: a cross-sectional study: BMC Health Services Res. 2013;13:170. Available at http://
www.biomedcentral.com/1472-6963/13/170. Accessed
10 Aug 2014.
6. Wang H, Li N, Zhu H, Xu S, Lu H, Feng Z. Prescription pattern and its influencing factors in Chinese county hospitals: A retrospective cross-sectional study. PLoS One. 2013;8(5):e63225.
7. WHO. How to Investigate Drug Use in Health Facilities: selected Drug use Indicators. WHO/DAP/93.1. Geneva: WHO; 1993.
8. Isah AO, Ross-Degnan D, Quick J, Laing R, Mabadeje AFB.
The development of standard values for the WHO drug
use prescribing indicators. ICUM/EDM/WHO. Available at http://www.archives.who.int/prduc2004/rducd/ICIUM_ Posters/1a2_txt.htm. Accessed 10 Aug 2014.
9. Upadhyay DK, Palaian S, Ravi Shankar P, Mishara P,
Sah AK. Prescribing pattern in diabetic outpatients in a tertiary care teaching hospital in Nepal. J Med Diagn Res.
2007;1(4):248-55.
10. Raj K, Kamlesh K, Kajal HL. A study of drug prescribing
pattern and cost analysis among diabetic patients in a tertiary care teaching institute in North India. J Drug Deliv Ther.
2013;3(2):56-61.
11. Xinyi Z, Ruidong H, Gang H. Evaluation and analysis on
507 cases of outpatients’ prescription in hospital. Chin J
Pharmacovigil. 2010;7(12):755-7.
12. Lianzhen C, Shujie W, Qing W, Limin S, Hailian W, et al.
2003;14(3):156-8.
13. Hua L, Hongwei W, Danyang W. Analysis of basic indicators and rational drug use: review of 6000 outpatient prescriptions. Eval Anal Drug-Use Hosp China. 2009;9(4):280-1.
14. Daohai C, Hua L, Taotao L. Evaluation of basic indicators
in outpatient prescriptions and analysis of rationality in drug
use. Eval Anal Drug-Use Hosp China. 2012;12(4):373-5. 15. Bimo: Report on Nigerian field test. INRUD News
1992;3(1):9-10. In: How to Investigate Drug Use in Health Facilities. Geneva: WHO; 1993:74 (WHO/DAP/93.1).
16. Bannenberg WJ, Forshaw CJ, Fresle D, Salami AO,
Wahab HA. Evaluation of the Nile Province Essential Drug Project. Geneva: WHO; 1991. WHO/DAP/91.10. In: How to Investigate Drug Use in Health Facilities. Geneva: WHO; 1993:74 (WHO/DAP/93.1).
17. Ministry of Health/Zimbabwe Essential Drugs Action Programme: essential DrugsSurvey. In: How to Investigate
Drug use in Health Facilities. Geneva: WHO; 1993:74 (WHO/DAP/93.1).
18. Mahajan R, Singh NR, Singh J, Dixit A, Jain A, Gupta A.
Current scenario of attitude and knowledge of physicians
about rational prescription: a novel cross-sectional study. J Pharm Bioallied Sci. 2010;2(2):132-6.
19. Menik HL, Isuru AI, Sewwandi S. A survey: precepts and
practices in drug use indicators at Government Healthcare
Facilities: a hospital-based prospective analysis. J Pharm Bioallied Sci. 2011;3(1):165-9.
20. Keohavong B, Syhakhang L, Sengaloundeth S, Nishimura A, Ito K. Rational use of drugs: prescribing and dispensing practices at public health facilities in Lao PDR. Pharmacoepidemiol Drug Saf. 2006;15(5):344-7.
21. Assessment of the Pharmaceutical Sector in Ethiopia. Addis
Ababa; 2003. Available at http://www.who.int/medicines/ areas/coordination/ethiopia_pharmaceutical.pdf. Accessed
10 Aug 2014.
22. Bashrahil KA. Indicators of rational drug use and health
services in Hadramout, Yemen. East Mediterr Health J. 2010;16(2):151-5.
23. Irshaid YM, Al-Homrany MA, Hamdi AA, Adjepon-Yamoah KK, Mahfouz AA. A pharmacoepidemiological study of prescription pattern in outpatient clinics in Southwestern
Saudi Arabia. Saudi Med J. 2004;25(12):1864-70.
24. Uzochukwu BS, Onwujekwe OE, Akpala CO. Effect of
the Bamako-initiative drug revolving fund on availability and rational use of essential drugs in primary health care facilities in south-east Nigeria. Health Policy Plan.
2002;17(4):378-83.
25. Trap B, Hansen EH, Hogerzeil HV. Prescription habits of
dispensing and non-dispensing doctors in Zimbabwe. Health
Policy Plan. 2002;17(3):288-95.
26. Ofori-Adjei D. Report on Tanzanian field test. INRUD News; 3(1):9. In: How to Investigate Drug Use in Health Facilities. WHO: Geneva; 1993:74 (WHO/DAP/93.1).
27. Christensen RF. A strategy for the improvement of prescribing and drug use in rural health facilities in Uganda.
Ugandan Essential drugs and management program;
2 September-11 October 1990.In: How to Investigate Drug
use in HealthFacilities. Geneva: WHO; 1993:74 (WHO/ DAP/93.1).
28. Bimo: Field testing of drug use indicators of INRUD: report of field trip to Indonesia, Bangladesh, and Nepal, June-July 1991. In: How to investigate drug use in health facilities. Geneva: WHO; 1993: 74 (WHO/DAP/93.1).
doi: 10.5455/2319-2003.ijbcp20141221
Cite this article as: Chandelkar UK, Rataboli PV. A study of
drug prescribing pattern using WHO prescribing indicators in the state of Goa, India. Int J Basic Clin Pharmacol