E
E
f
f
f
f
i
i
c
c
i
i
e
e
n
n
c
c
y
y
o
o
f
f
S
S
o
o
m
m
e
e
E
E
x
x
p
p
o
o
n
n
e
e
n
n
t
t
i
i
a
a
l
l
E
E
s
s
t
t
i
i
m
m
a
a
t
t
o
o
r
r
s
s
f
f
o
o
r
r
E
E
s
s
t
t
i
i
m
m
a
a
t
t
i
i
n
n
g
g
H
H
e
e
t
t
e
e
r
r
o
o
g
g
e
e
n
n
e
e
o
o
u
u
s
s
P
P
o
o
p
p
u
u
l
l
a
a
t
t
i
i
o
o
n
n
P
P
a
a
r
r
a
a
m
m
e
e
t
t
e
e
r
r
s
s
O
O
l
l
ay
a
yi
i
wo
w
ol
l
a
a
O
O.
.
M
M
.,
.
,
A
Ay
ye
e
l
l
es
e
s
o
o
T
T.
.
O
O.
.
Department of Statistics, College of Physical Sciences, Federal University of Agriculture, Abeokuta, Ogun State, Nigeria
Corresponding author: Olayiwola O.M., [email protected]
ABSTRACT: Stratified Ranked Set sampling (SRSS) helps in obtaining an unbiased estimator for population parameters with some significant gain in efficiency. This paper presents modified exponential estimators of finite population mean using co-efficient of Variation and Co-efficient of Kurtosis of auxiliary variable. The bias and mean square error (MSE) of the proposed estimators with large sample approximation were derived. A set of secondary data on students’ enrolment in secondary schools in Ogun State were used. The population was stratified into 4 strata base on political zones which are Egba, Yewa, Ijebu and Remo with 89, 91, 69 and 53 schools respec tively. The sample sizes of the 4 strata based on proportional allocation are 27, 27, 21 and 15 schools respectively. The population means for students’ enrolment and number of staff are 1284.71 and 49.0 respectively. The students’ enrolment in Egba, Yewa, Ijebu and Remo zones are 140718, 137835, 56618 and 52815 respectively. The proportions of staff members to number of enrolled students are 0.042, 0,025, 0.051 and 0.047 respectively. The MSEs for four proposed estimators are 6176.84, 6503.61, 6269.63, and 6632.94. The MSEs for the corresponding four existing estimators are 9754.51, 10270.80, 9748.76, and 10561.44. The proposed estimators have least MSE, hence they are more efficient.
KEYWORDS: Heterogeous Population, Exponential Estimators, Co-efficient of Variation, Co-efficient of kurtosis and Efficiency.
1. Introduction
Ranked Set Sampling was first proposed by McIntyre ([McI52]) to increase precision without increasing the number of observations. It is a method of collecting data that improves estimation by utilizing the sampler’s judgment or auxiliary information about the relative sizes of the sampling units. Dell and Clutters ([DC72]) showed that, for comparable sample sizes, the RSS procedure results in more accurate parameter estimators than simple random sampling (SRS). Samawi ([SM96]), introduced Stratified Ranked Set Sampling (SRSS) in order to increase the efficiency of the estimator of the population mean and several works have been done on SRRS since then. Mandowara and Mehta ([MM14]) used the idea of SRSS to improve the precision of ratio estimators given by Kadilar and Cingi ([KC03]). The usual exponential estimator given by Bahl and Tuteja ([BR91]) for the population mean in Stratified random sampling is
st st
st st st
x
X
x
X
y
t
exp
1.1where
L
h h
y h W st
y
1 and
L
h h
x h W st
x
1 are the unbiased estimators of population means. Here
h
W
=N Nh
is the weight of h stratum where Nh is the hth stratum size and N is the total population size (h =
1,2,3,…….L) and L is the total number of strata in the population. In this article, we propose estimators base on the modified exponential estimators using SRSS instead of SSRS and apply them to enrolment of students in secondary schools in Ogun State.
2. SOME EXISTING EXPONENTIAL ESTIMATORS IN SSRS
L i xh h h L i xh h h L i xh h h L i xh h h st C x W C X W C x W C X W y t 1 1 1 11 exp 1.2
L i xh h h L i xh h h L i xh h h L i xh h h st B x W B X W B x W B X W y t 1 1 1 1 2 exp 1.3
L i xh xh h h L i xh xh h h L i xh xh h h L i xh xh h h st B C x W B C X W B C x W B C X W y t 1 1 1 13 exp 1.4
L i xh xh h h L i xh xh h h L i xh xh h h L i xh xh h h st C B x W C B X W C B x W C B X W y t 1 1 1 14 exp 1.5
The mean square errors (MSE) of the estimators to the first degree are :
L
h
x
h
y
h
RS
h
x
S
R
h
y
S
h
n
h
W
MSE
t
1
1
2
2
2
2
1
2
2
1
1.6
h
y
h
x
RS
h
x
S
R
h
y
S
L
h
n
h
h
W
t
MSE
2
2
2
2
2
2
2
1
2
2
1.7
h
y
h
x
RS
h
x
S
R
h
y
S
L
h
n
h
h
W
t
MSE
2
2
3
2
2
2
3
1
2
3
1.8
h
y
h
x
RS
h
x
S
R
h
y
S
L
h
n
h
h
W
t
MSE
4
2
2
2
2
4
2
1
2
4
1.93. Methodology
Motivated by estimators in (1.2) to (1.5) which show the incorporat ion of more and more parameters on auxiliary variable to give more efficient estimators and Mandowara and Mehta ([MM14]), this work proposes exponential ratio type estimators for population mean
Y
using stratified ranked set sampling.Adapting the estimator in (1.2) given by Singh et al. ( [ST05]), a new exponential ratio type estimator in stratified ranked set sampling is being proposed as follows
L i xh r h h L i xh h h L i xh r h h L i xh h h SRSS rC
x
W
C
X
W
C
x
W
C
X
W
y
t
h h 1 1 1 11
exp
3.1where
L h r h h SRSS W y h y 1 ] [ ,
L h r h h SRSS W x h x1
]
[ are the stratified ranked set sample means for variables and
respectively.
Obtaining bias and MSE of tr1 let
y
SRSS
Y
1
0
andx
SRSS
X
1
1
so thatE
1
E
0
0
.Now
L h r i i y n m y Y mr h SRSS h h h h hS
W
Y
y
V
E
V
1 1 2 ] [ 2 1 1 2 2 2 0 2)
(
)
(
h h h r i i y h y L h h h D n m Y S n W 1 2 ] [ 2 2 1 2 . Similarly,
h h h r i i x h y L h h h D n m X S n W E 1 2 ) ( 2 2 1 2 2 1
and
h h h h h r i i y i x h y x L h h h oD
n
m
Y
X
S
n
W
E
1 ] [ ) ( 1 2 1
.Further to validate first degree of approximation, we assume that the sample is large enough to get
0 and
1 so small that the terms involving
0 and
1 with degree greater than two will be negligible.The Bias and MSE of the estimator tr1 to the first degree of approximation are respectively, given by
1 0 1
2 1 2 1 4 1 2 0 2 2 1 2 1 2 1 8 3 1 0 1 2 1 0 1
Y Y t Y Y t r r
2
1 2 1 8 3 1 0 1 2 1 0 1
1 E t Y Y E
E
E
t
B r r
L h r i i y i x r i i x h h h y x x L h h h r h h h h h h h hD
D
n
m
n
W
Y
X
S
X
S
n
W
Y
t
B
1 1 ] [ ) ( 1 1 2 ) ( 2 1 2 1 2 2 2 1 1 2 12
8
3
2
8
3
3.2
1
0 1
2 1 2 1 4 1 2 0 2 2 1
1 Et Y Y E
E
E
t
MSE r r
Since
E
1
E
0
0
h h h h h h h h h h h r i i y i x h y x L h h h L h r i i x h x h h h r i i y h y L h h h rD
n
m
Y
X
S
n
W
D
n
m
X
S
n
m
n
W
D
n
m
Y
S
n
W
Y
t
MSE
1 ] [ ) ( 1 2 1 1 1 2 ) ( 2 2 2 2 1 1 2 ] [ 2 2 1 2 14
h h h h h h h r i i x i y h y x x y L h h hr D D
Adapting the estimator in (1.3) given by Singh et al. ( [ST05]), a new exponential ratio type estimator in stratified ranked set sampling is being proposed as follows
L i h r h h L i h h h L i h r h h L i h h h SRSS rx
B
x
W
x
B
X
W
x
B
x
W
x
B
X
W
y
t
h h 1 2 1 2 1 2 1 2 2)
(
)
(
)
(
)
(
exp
3.4The Bias and MSE of the estimator tr2 to the first degree of approximation are respectively, given by
2 0 1
2 1 2 2 4 1 2 0 2 2 2 2 1 2 2 8 3 1 0 2 2 1 0 2
Y Y t Y Y t r r
2
1 2 8 3 1 0 2 2 1 0 1
2 Et Y Y E
E
2E
t
B r r
L h r i i y i x r i i x h h h y x x L h h h r h h h h h h h hD
D
n
m
n
W
Y
X
S
X
S
n
W
Y
t
B
1 1 ] [ ) ( 2 1 2 ) ( 2 2 2 2 2 2 2 2 1 2 22
8
3
2
8
3
3.5
2
0 1
2 1 2 2 4 1 2 0 2 2 2
2 Et Y Y E
E
E
t
MSE r r
h h h h h h h r i i x i y h y x x y L h h hr D D
n m Y RS S R S n W t MSE 1 2 ) ( 2 ] [ 2 2 2 2 2 2 2 1 2 2 2 4
3.6Adapting the estimators in (1.4) given by Singh et al. ([ST05]), another new exponential ratio type estimator in stratified ranked set sampling is being proposed as follows
L i xh h r h h L i xh h h h L i xh h r h h L i xh h h h SRSS rC
x
B
x
W
C
x
B
X
W
C
x
B
x
W
C
x
B
X
W
y
t
h h 1 2 1 2 1 2 1 2 3)
(
)
(
)
(
)
(
exp
3.7The Bias and MSE of the estimator tr3 to the first degree of approximation are respectively, given b y
2
1 2 8 3 1 0 3 2 1 0 3
3 Et Y Y E
E
3E
t
B r r
L h r i i y i x r i i x h h h y x x L h h h r h h h h h h h hD
D
n
m
n
W
Y
X
S
X
S
n
W
Y
t
B
1 1 ] [ ) ( 3 1 2 ) ( 2 3 2 3 2 2 2 3 1 2 32
8
3
2
8
3
3.8
3
0 1
2 1 2 3 4 1 2 0 2 2 3
3 E t Y Y E
E
E
t
MSE r r
h h h h h h h r i i x i y h y x x y L h h hr D D
n m Y RS S R S n W t MSE 1 2 ) ( 3 ] [ 2 3 2 2 2 3 2 1 2 3 2 4
3.9Adapting the estimators in (1.5) given by Singh et al. ([ST05]), another new exponential ratio type estimator in stratified ranked set sampling is being proposed as follows
The Bias and MSE of the estimator tr4 to the first degree of approximation are respectively, given by
2
1 2 4 8 3 1 0 4 2 1 0 4
4 Et Y Y E
E
E
t
B r r
L
h
r
i
i y i x r
i i x h
h h y
x x
L
h h h r
h
h h h
h h
h h
D
D
n
m
n
W
Y
X
S
X
S
n
W
Y
t
B
1 1
] [ ) ( 4
1 2
) ( 2
4 2
4 2 2 2 4
1 2
4
2
8
3
2
8
3
3.11
4
0 1
2 1 2 4 4 1 2 0 2 2
4
4 E t Y Y E
E
E
t
MSE r r
h
h h
h h h
h
r
i
i x i
y h
y x x
y L
h h h
r D D
n m Y RS
S R S
n W t
MSE
1
2
) ( 4 ] [ 2
4 2 2 2 4 2
1 2
4
2 4
3.12
4. EFFICIENCY COMPARISON
On comparing 1.2, 1.3, 1.4 and 1.5 with 3.1, 3.4, 3.7, 3.10, we have:
1.
MSE
t
1
MSE
t
r1
B
1
0
where
hh h
r i
i x i
y h
D
D
n
m
Y
B
1
2
) ( 1 ] [ 2
1
2
t
1MSE
t
r1MSE
2.
MSE
t
2
MSE
t
r2
B
2
0
where
hh h
r i
i x i
y h
D
D
n
m
Y
B
1
2
) ( 2 ] [ 2
2
2
t
2MSE
t
r2MSE
3.
MSE
t
3
MSE
t
r3
B
3
0
where
hh h
r i
i x i
y h
D
D
n
m
Y
B
1
2
) ( 3 ] [ 2
3
2
t
3MSE
t
r3MSE
4.
MSE
t
4
MSE
t
r4
B
4
0
where
hh h
r i
i x i
y h
D
D
n
m
Y
B
1
2
) ( 4 ] [ 2
4
2
t
4MSE
t
r4MSE
5. DATA DESCRIPTION AND RESULT
For empirical study, a set of secondary data on the enrolment of students in secondary schools in Ogun State were used. Y is the number of enrolled students (variable of interest) and X is the number of staff (auxiliary variable). The population was stratified into 4 strata base on political zones in the State which are Egba, Yewa, Ijebu and Remo with sizes 89, 91, 69 and 53 respectively. The sample sizes of the 4 strata are 27, 27, 21 and 15 respectively with selection based on proportional allocation. The total population size is 302, population mean for Y is 1284.71 and that of X is 49.0 which give the population ratio as 26.22.
Table 1: TheEnrolled Students In Each Zone With The Corresponding Number Of Teachers
Zones Number of Enrolment (Y) Number of teacher (X) Ratio
Sum Mean Sum Mean
Egba 140718 1581.1 5913 66.44 0.042
Yewa 137835 1514.7 3507 38.54 0.025
Ijebu 56618 820.6 2868 41.57 0.051
From table 1, the sums and means of enrolled students in each zone with the corresponding number of teachers in each school for each zone. It can be seen that Egba and Yewa zones have the hig hest number of enrolled students in the schools while Ijebu and Remo have the least enrolled students. Generally the fraction indicates that the ratio of teachers to number of enrolled students is low and that more teachers should be employed.
Figure 1: Number of enrolment for Yewa Zone Figure 2: Number of enrolment for Egba Zone
Figure 3: Number of enrolment for Ijebu Zone Figure 4: Number of enrolment for Remo Zone
From the figures 1 to 4, it can be seen from the histogram of each of the zo nes that they are left skewed and that the highest number of enrolled students was between 0-3000.
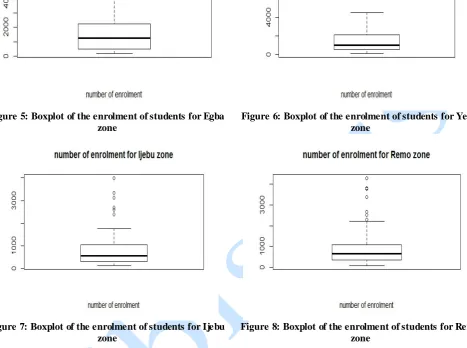
Figure 5: Boxplot of the enrolment of students for Egba zone
Figure 6: Boxplot of the enrolment of students for Yewa zone
Figure 7: Boxplot of the enrolment of students for Ijebu zone
Figure 8: Boxplot of the enrolment of students for Remo zone
From the figures, the boxplot for Egba plots has one outlier in terms of number of enrolment of students, for Yewa zone, three outliers, Ijebu Zone six outliers and Remo zone has six outliers which indicates that we have extreme number of enrolled students in these schools compared to other schools.
5.1 Exponential Ranked Set Sampling Analysis
The table 2 and 3 show the population characteristics for each stratum and the estimated MSE and the relative efficiency for estimators
t
i andt
ri for i= 1,2,3,4.Table 2: Data Statistics
Parameters Stratum 1 Stratum 2 Stratum 3 Stratum 4
N 89 91 69 53
N 27 27 21 15
R 9 9 7 5
66.44 38.54 41.57 47.34
64.85 39.52 42.76 44.80
1581.10 1514.70 820.60 996.50
1706.89 1482.41 780.43 685.87
Cy 0.8358 1.0086 0.9759 1.0273
Cx 0.6285 0.7184 0.6999 0.5724
40496.18 38555.31 20952.23 24871.36
1746369 2333901 641181 1047915
1742.79 766.43 846.31 734.34
1321.50 1527.71 800.74 1023.68
41.75 27.68 29.09 27.10
0.974 2.043 1.594 1.359
3.329 8.609 5.804 4.164
Table 3: The estimates, MSE of the estimators and their relative efficiencies
Estimator Estimates Mean Square Error Efficiency
Existing Proposed
t1 3417.05 9754.51 6176.84 1.58
t2 3414.86 10270.80 6503.61 1.58
t3 3383.74 9748.76 6269.63 1.56
t4 3174.73 10561.44 6632.94 1.59
6. CONCLUSIONS
We have developed some exponential ratio type estimators in stratified ranked set sampling. The bias and mean square errors of the proposed estimators were obtained theoretically. In the application of the estimators to the data, it was seen that the proposed estimators gave a more efficient result based on the comparison of the MSEs of the proposed estimators and that of the exponential ratio type estimators in stratified simple random sampling. We then submit that the proposed estimators are more precise as shown theoretically and empirically.
REFERENCES
[BT91] S. Bahl, R. K. Tuteja - Ratio and product type exponential estimator. Inform. and Optim. Sci., XII, I, 159-163, 1991.
[DC72] T. R. Dell, J. L. Clutter - Ranked set sampling theory with order statistics background. Biometrics 28, 545-555, 1972.
[KC03] C. Kadilar, H. Cingi - Ratio Estimators in Stratified Random Sampling. Biometrical Journal 4 (2), 218-225, 2003.
[McI52] G. A. McIntyre - A method for unbiased selective sampling, using ranked sets. Australian Journal of Agricultural Research 3, 385-390, 1952.
[MM14] V. L. Mando wara, N. Mehta - Modified ratio estimators using stratified ranked set sampling. Hacettepe Journal of Mathe matics and Statistics, Volume 43(3) , 461-471, 2014.
[SM96] H. M. Samawi, H. A. Muttlak - Estimation of ratio using rank set sampling. Biometrical Journal 38, 753-764, 1996.
[ST05] H. P. Singh, R. Tailor - Estimation of finite population mean with known co-efficient of variation