R E S E A R C H
Open Access
Sex-specific mouse liver gene expression:
genome-wide analysis of developmental changes
from pre-pubertal period to young adulthood
Tara L Conforto and David J Waxman
*Abstract
Background:Early liver development and the transcriptional transitions during hepatogenesis are well characterized. However, gene expression changes during the late postnatal/pre-pubertal to young adulthood period are less well understood, especially with regards to sex-specific gene expression.
Methods:Microarray analysis of male and female mouse liver was carried out at 3, 4, and 8 wk of age to elucidate developmental changes in gene expression from the late postnatal/pre-pubertal period to young adulthood. Results:A large number of sex-biased and sex-independent genes showed significant changes during this developmental period. Notably, sex-independent genes involved in cell cycle, chromosome condensation, and DNA replication were down regulated from 3 wk to 8 wk, while genes associated with metal ion binding, ion transport and kinase activity were up regulated. A majority of genes showing sex differential expression in adult liver did not display sex differences prior to puberty, at which time extensive changes in sex-specific gene expression were seen, primarily in males. Thus, in male liver, 76% of male-specific genes were up regulated and 47% of female-specific genes were down regulated from 3 to 8 wk of age, whereas in female liver 67% of sex-specific genes showed no significant change in expression. In both sexes, genes up regulated from 3 to 8 wk were significantly enriched (p < E-76) in the set of genes positively regulated by the liver transcription factor HNF4a, as determined in a liver-specific HNF4aknockout mouse model, while genes down regulated during this
developmental period showed significant enrichment (p < E-65) for negative regulation by HNF4a. Significant enrichment of the developmentally regulated genes in the set of genes subject to positive and negative regulation by pituitary hormone was also observed. Five sex-specific transcriptional regulators showed sex-specific expression at 4 wk (male-specificIhh;female-specific Cdx4, Cux2, Tox, andTrim24) and may contribute to the developmental changes that lead to global acquisition of liver sex-specificity by 8 wk of age.
Conclusions:Overall, the observed changes in gene expression during postnatal liver development reflect the deceleration of liver growth and the induction of specialized liver functions, with widespread changes in sex-specific gene expression primarily occurring in male liver.
Keywords:Pre-pubertal development, Liver gene expression, Sexual dimorphism, Microarray analysis, Growth hormone
Background
The liver performs a variety of physiological functions including glycogen storage, cholesterol catabolism to bile acids, and drug metabolism [1,2]. Liver development begins around embryonic day 9 (E9) in the mouse and
the transcriptional transitions during hepatogenesis are well characterized [1]. Changes in gene expression dur-ing the postnatal/pre-pubertal period are less well understood [3], especially with regards to sex-biased gene expression. Over 1,000 genes are known to be dif-ferentially expressed between male and female liver and are regulated primarily by pituitary patterns of growth * Correspondence: [email protected]
Division of Cell and Molecular Biology, Department of Biology, Boston University, Boston, MA 02215, USA
hormone secretion [4-6], which are sex-dependent and subject to regulation by estrogen and testosterone [7].
During early mouse postnatal development, rapid growth of the body and somatic organs occurs and then slows down as the animal ages. From 2 to 4 wk of age liver mass increase is predominantly due to polyploidiza-tion and to a lesser extent, hypertrophy [8], while from 4 to 8 wk there is a decrease in polyploidzation and the increase in liver mass is primarily due to hyperplasia. b-catenin, a gene associated with cell proliferation, is induced at postnatal day 5 and highly expressed until post-natal day 20 [9]. Little growth of the liver is observed after 8 wk, at which time growth-promoting genes active at 1 wk, such asIgf2, Mest, Peg3, are repressed as they are in other tissues showing decelerated growth, including kid-ney, lung, and heart [10]. There is a reciprocal relationship between the decrease inIgf2expression and the increase ofIgf1expression during postnatal mouse liver develop-ment [11]. The developdevelop-mental decreases in somatic growth and in the expression ofIgf2, Mest, Peg3appear to be regulated by the size and not the age of the animalper se, as seen in studies where the anti-thyroid drug pro-pylthiouracil is used to inhibit body growth [10].
Large changes in gene expression occur in early postna-tal mouse liver as the liver’s primary function shifts from hematopoiesis to specialized liver functions [3]. RNA poly-merase activity steadily increases and plateaus at 30 days of age [12], while RNA synthesis peaks at 60 days and decreases at later ages. Innate immune system genes are activated from E18.5 to postnatal day 3, while liver func-tion genes, such as those involved in lipid and fatty acid metabolism, are activated at postnatal day 7 [3]. In rat liver, changes in expression of genes associated with meta-bolism occur around the time of weaning [13]. In particu-lar, gluconeogenesis and ketogenic enzyme activity decrease, while glucokinase and lipogenic activity increase [13]. A decrease in respiration rates occurs in mouse liver mitochondria right after weaning, but the levels later recover in adults [14]. These changes in metabolic enzyme activity may be due to a rise in thyroid hormone and/or glucocorticoid levels [13].
Genes encoding cytochromes P450 and other enzymes of drug and steroid metabolism show marked changes in expression during postnatal liver development. In male and female mouse liver, Cyp1a2, Cyp2d33, Cyp2f2, Cyp3a13, andCyp3a25are expressed at low levels at post-natal day 10 or 15 and then increase until day 20, after which the expression is largely maintained [15]. A similar pattern of expression was observed for CYP1A2 and CYP2E1in male rat liver [16]. ManyCypsand other genes active in drug metabolism show sex-differences in expres-sion beginning at puberty [6,15,17-19]. Genes such as Cyp2b9, Cyp3a41, andCyp3a44, are expressed at high levels in both male and female mouse liver prior to
puberty, but are then selectively repressed in male liver, resulting in female-biased expression at adulthood [18-20]. In the rat, the male-specificCYP2C11and the female-spe-cificCYP2C12 are both expressed at low levels in both male and female liver until puberty, at which time CYP2C11is up regulated in male liver andCYP2C12is up regulated in female [21,22].Sultgenes involved in hydro-xysteroid sulfate conjugation display sex-specific expres-sion after puberty in mouse liver [17,23]. Six of seven Sult2agenes show high pre-pubertal expression in both male and female liver, however in adult mouse liver, three Sult2agenes display female-specific expression while three others decrease in expression in both male and female liver [17]. The seventhSult2agene is not detectable prior to puberty and is expressed at adulthood in a sex-indepen-dent manner [17].
Presently, we investigate on a global scale the effects of age and sex on gene expression in mouse liver. We com-pare gene expression profiles in the pre-pubertal period (3 wk and 4 wk of age) to the post-pubertal/young adult stage (8 wk old) and find that changes in sex-specific gene expression primarily occur in male liver. We also show that genes that show changes during this period of development are enriched in the set of genes whose expression is dependent on the liver transcription factor hepatocyte nuclear factor 4a (HNF4a) [24], as deter-mined using a liver-specific mouse HNF4a knockout model [25]. Finally, we identify other transcription factors that show significant changes in expression during post-natal development and may contribute to the observed changes in liver gene transcription during this develop-mental period.
Methods
Animal treatments, liver RNA isolation, and quantitative PCR (qPCR)
master mix (Applied Biosystems), 312 nM each qPCR primer, and 0.5-1.5μl DNA template were loaded onto a 384-well plate and run through 40 cycles on an ABS 7900HT sequence detection system (Applied Biosys-tems). Data were graphed as relative values, normalized to the 18S rRNA content of each sample. Statistical ana-lyses were carried out by 2-way ANOVA using PRISM software version 4 (GraphPad, Inc., San Diego, CA). qPCR primers are listed in Additional file 1. RNA integ-rity (minimum RIN number 8.0) was verified using an Agilent Bioanalyzer 2100 instrument (Agilent Technol-ogy, Palo Alto CA).
Microarray analysis
Seven independent competitive hybridization microarray experiments were carried out: 1) Male 3 wk vs. Female 3 wk; 2) Male 4 wk vs. Female 4 wk; 3) Male 8 wk vs. Female 8 wk; 4) Male 3 wk vs. Male 8 wk; 5) Male 4 wk vs. Male 8 wk; 6) Female 3 wk vs. Female 8 wk; and 7) Female 4 wk vs. Female 8 wk. Two independent pairs of pooled liver RNA randomized samples were used for each microarray comparison; these biological replicates were analyzed as dye swaps to correct for dye bias, giving a total of 14 microarrays. To minimize the impact of individual mouse to mouse variability on the microarray data, each biological replicate was comprised of a rando-mized pool of liver RNA prepared from n = 5-6 mice. Thus, for array comparison 1, Male 3 wk liver pool A was labeled with Alexa 555 dye and Female 3 wk liver pool A was labeled with Alexa 647 dye (biological repli-cate one), and Male 3 wk liver pool B was labeled with Alexa 647 dye and Female 3 wk liver pool B was labeled with Alexa 555 dye (biological replicate two); array com-parison 1 is thus based on comcom-parisons of 10-12 indivi-dual male mice and 10-12 indiviindivi-dual female mice at each age. Hybridization of fluorescent labeled RNA to 39,429-feature Agilent microarrays was carried out for each pair of independent biological replicates, giving a total of 14 arrays across the 7 array comparisons. SurePrint G3 4×44 K Mouse Gene Expression microarrays (catalog no. G4846A-026655; Agilent Technology; Gene expression omnibus (GEO) platforms GPL10333 and GPL11202) were used for these studies.
Linear and LOWESS normalization were performed for each microarray using Agilent Feature Extraction software. The Feature Extraction analysis also calculates the varia-tion of pixel intensity for each feature (spot) on the array. These error measurements were input to the Rosetta error model, which was used for subsequent analysis of statisti-cal significance of differential gene expression. The Rosetta error model provides a gene-specific estimate of error by incorporating two elements: a technology-specific estimate of error and an error estimate derived from replicate arrays [29]. The technology-specific component utilizes an
intensity-dependent model of error derived from numer-ous self-self hybridizations. In this study, two arrays, based on independent pools of biological replicates, were used for each comparison of interest. By including the technol-ogy-specific estimate, the Rosetta error model is able to avoid false positives that occur from under-estimation of error when a small number of replicate arrays are avail-able, thus resulting in an increase in statistical power equivalent to that which would be obtained with at least one additional replicate. For two-color microarrays a log-ratio error estimate is derived in the Rosetta error model from the individual error estimates of each sample (color) used in the co-hybridization. Then, for each feature an average log ratio and associatedp-value are obtained from replicate measurements (arrays) using the Rosetta error model error-weighted averaging method. In this approach, the average ratio is calculated by weighting the ratio from each sample inversely proportional to the variance of that sample. This produces an averaged ratio with the smallest possible error. Validation with spike-in experiments has demonstrated that the Rosetta error model has superior accuracy in detecting and quantifying relative gene expres-sion when compared to other statistical methods com-monly used in microarray analysis [30]. Direct experimental validation is provided in the present study, where qPCR analysis of n = 9-10 individuals per group gave results indistinguishable from those obtained by microarray analysis (see below).
the same gene name but different TFS groups were retained. After removing redundant probes, 5,715 probes (genes) met the above specifiedp-value, expression ratio, and well above background filters. 1,212 of the 5,715 genes showed significant sex-differences in expression at 8 wk, and on that basis were defined as adult sex-specific (adult sex-biased) genes. All microarray data files are avail-able at the GEO web site [31] as GEO series GSE34782.
Data analysis
A system of binary and decimal flags (TFS) [32] was used to classify the 5,715 regulated genes based on expression ratios andp-values across the seven microarray compari-sons (Additional file 2). Hierarchical clustering and heat map generation were carried out separately for the 1,212 adult sex-specific genes and 4,503 sex-independent genes using Cluster [33] and Java TreeView [34]. STEM cluster-ing [35,36] of the adult sex-specific genes, and separately, STEM clustering of the adult sex-independent genes, was used to identify common patterns present within each gene set. STEM clustering was carried out using log2 gene expression ratios from our microarray study, with each of the 7 microarrays serving as a separate data point for STEM clustering. The maximum number of model STEM profiles considered was set to either 30 or 50 and the maximum unit change in model profiles between time points was set equal to 2 [35,36]. The STEM profiles are derived from predefined patterns based on the maxi-mum number of profiles and the maximaxi-mum distance between two data points, which is selected by the user. A greedy approximation algorithm generates a set of pat-terns that maximizes the minimum distance between any two patterns so that the set of patterns is distinctive but also representative of all the possible patterns [35,36]. A permutation-based test was used to quantify the expected number of genes that would be assigned to each prede-fined pattern if the data were randomly generated. If the number of genes assigned to a given predefined pattern is significantly greater than the predicted number of genes, then the profile with the genes assigned to that predefined pattern is assigned a significantp-value.
The DAVID annotation tool [37,38] was used to ana-lyze the genes in each STEM cluster to identify enrich-ment clusters deemed significant (minimum enrichenrich-ment score of 1.3, which is equivalent to ap-value of 0.05). Potential transcriptional regulators were identified by searching the Gene Ontology (GO) descriptors of the 5,715 regulated genes for the terms“DNA binding”or “transcription”. The initial list of genes was filtered using the following more stringent criteria: microarray signal intensity≥25 at 8 wk of age, expression ratio > 2-fold in the arrays in which the gene exhibited ap-value < 0.0001, and in the case of adult sex-biased transcriptional regula-tors, expression ratio > 2 (or < 0.5) for the male 8 wk vs.
female 8 wk comparison. The list of adult sex-specific transcriptional regulators were further narrowed down by focusing on genes whose expression was altered by conditions that influence the expression of adult sex-spe-cific genes, such as hypophysectomy [27], STAT5b defi-ciency [32], and HNF4adeficiency [24,39].
Comparison of microarray data sets and enrichment score calculations
Gene sets identified by microarray analysis of hypophysec-tomized mouse liver [27] or HNF4a-deficient mouse liver [24] were compared to the sets of genes that showed sig-nificant changes in expression from 3 wk to 8 wk in the present study. For these analyses, a more stringent thresh-old was used to define sex-independent genes, to exclude genes showing a weak sex-bias in expression as well as genes giving very low microarray signal intensities. Thus, the stringent criteria used to identify sex-independent genes was male:female (or female:male) expression ratio < 1.2,p-value > 0.01, and Agilent microarray signal intensity
≥ 25. Enrichment scores calculated for comparisons between microarray studies run on different array plat-forms were based on to the genes represented of both microarray platforms (Agilent mouse microarray G4122F-014868 used previously [24,27] vs. Agilent mouse microar-ray G4846A-026655 for the present study). A background gene set comprised of all genes common to both platforms was used when calculating enrichment scores for male-specific, female-male-specific, and all genes that are either up or down regulated from 3 wk to 8 wk. A background gene set comprised of all sex-independent genes was used as the background when calculating enrichment scores for sex-independent genes that are either up or down regu-lated from 3 wk to 8 wk. Enrichmentp-values were calcu-lated using two tail Fisher Exact Test, with ap-value < 0.0001 deemed significant.
Results
Overall patterns of developmental change in sex-independent mouse liver genes
Genes were classified as male-specific (587 genes), female-specific (625 genes), or sex-independent (4,503 genes) based on their expression profiles in male com-pared to female liver at 8 wk of age (Table 1).
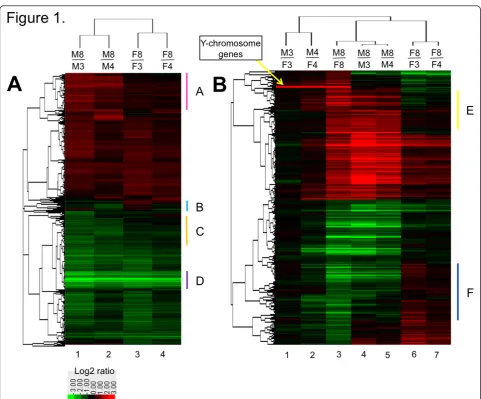
Hierarchical clustering of the 4,503 genes showing sex-independent expression at 8 wk showed that arrays from the same sex clustered together (Figure 1A). Many of the genes that were either up regulated (red) or down regulated (green) from 3 or 4 wk to 8 wk displayed similar changes in expression in both sexes. However, qualitative differences in developmental patterns between male and female liver were apparent (Figure 1A, gene groups marked A-C). Strong down regulation was seen in both sexes for some adult sex-independent genes (Figure 1A, group D), including genes involved in mitosis and the cell cycle, which reflects the decrease in cell growth that occurs in liver during the post-pubertal period [10].
Developmental regulation of sex-biased genes
Hierarchical clustering of the 1,212 adult sex-specific genes revealed similar numbers of male-biased genes as female-biased genes (Figure 1B, array 3). Sex differences in gene expression primarily emerged after 4 wk of age, with very few adult specific genes showing sex-biased expression at 3 wk or 4 wk (Figure 1B, arrays 1 and 2 vs. array 3; Figure 2A). Thus, only 16 of the adult sex-specific genes showed sex-differential expression at 3 wk (Table 1). This increased to 174 genes by 4 wk, with two thirds of these genes showing female specifi-city. However, for the majority (86%) of adult sex-speci-fic genes, sex-specisex-speci-fic expression was first observed at 8 wk (Table 1, Figure 2A).
Approximately 1,000 genes showed a change in expres-sion from 3 or 4 wk to 8 wk in male liver as compared to female liver (Additional file 3A). The largest number of genes showed postnatal developmental changes in either male liver only (2,348 genes) or in both male and female liver in a common manner (1,926 genes), as compared to changes in female liver only (981 genes) (Additional file 3C). In particular, many more adult sex-biased genes
showed post-pubertal developmental changes in male liver as compared to female liver (Figure 1B, arrays 4 and 5 vs. arrays 6 and 7; Figure 2B, C). Thus, 488 (83%) male-specific genes showed a developmental change in male liver vs. 248 (42%) showed such a change in female liver. Similarly, 358 (57%) of female-specific genes showed a developmental change in male liver vs. 208 (33%) showed such a change in female liver (Additional file 3C). More-over, 516 (43%) of the adult sex-biased genes displayed a developmental change in male liver only, while 126 (10%) showed a change in expression in female liver only (Additional file 3C). This greater frequency of develop-mental changes in male liver was seen for both male-spe-cific and female-spemale-spe-cific genes: 273 of 587 male-spemale-spe-cific genes showed a developmental change in male liver only, while only 33 were changed in female only. Similarly, 243 of 625 female-specific genes were changed in expression in male liver only, while only 93 showed a female-specific change (Additional file 3C).
In male liver, almost all male-biased genes showing a developmental change were up regulated, while almost half of female-biased genes were down regulated after puberty. In contrast, in female liver, the majority of sex-biased genes showed no significant change in expression over the same period (Figure 2B, C). Fewer developmental changes in sex-independent genes were also seen in female liver (Figure 2D). Differences in the direction of regulation between male and female liver were noted for some genes. Examples include genes up regulated in male liver after 3-4 wk but unchanged in female liver, and genes down regu-lated in male liver but unchanged or slightly up reguregu-lated in female liver (Figure 1B, groups E and F, respectively).
Clustering by predefined patterns (STEM analysis)
The 5,715 genes that met our threshold criteria for at least one of the seven microarray comparisons were clus-tered using Short Time-series Expression Miner (STEM) [35]. STEM analysis was carried out separately for adult sex-specific and adult sex-independent genes; it identified 12 significant gene profiles (gene clusters) comprised of 2,181 of the 4,503 adult sex-independent genes, and for
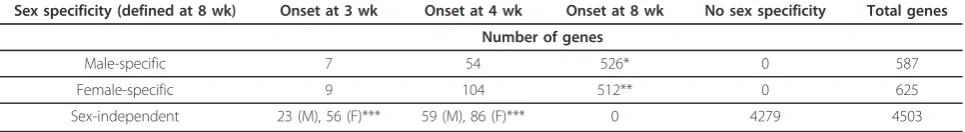
Table 1 Gene count distribution and onset of sex specificity
Sex specificity (defined at 8 wk) Onset at 3 wk Onset at 4 wk Onset at 8 wk No sex specificity Total genes
Number of genes
Male-specific 7 54 526* 0 587
Female-specific 9 104 512** 0 625
Sex-independent 23 (M), 56 (F)*** 59 (M), 86 (F)*** 0 4279 4503
The onset of sex-specificity for 1,037 out of 1,212 adult sex-specific genes occurred after 4 wk and by 8 wk. 224 of the 4,503 adult sex-independent genes met the thresholds for sex-differential expression at 3 or 4 wk, but not at 8 wk, however, only 13 of these genes showed the same sex-bias at 3 wk as at 4 wk. Three of the 7 male-specific genes showing sex specificity at 3 wk are Y-chromosome genes
* Includes 5 genes found to be male-specific at 8 wk, but female-specific at 3 or 4 wk ** Includes 6 genes found to female-specific at 8 wk, but male-specific at 3 or 4 wk
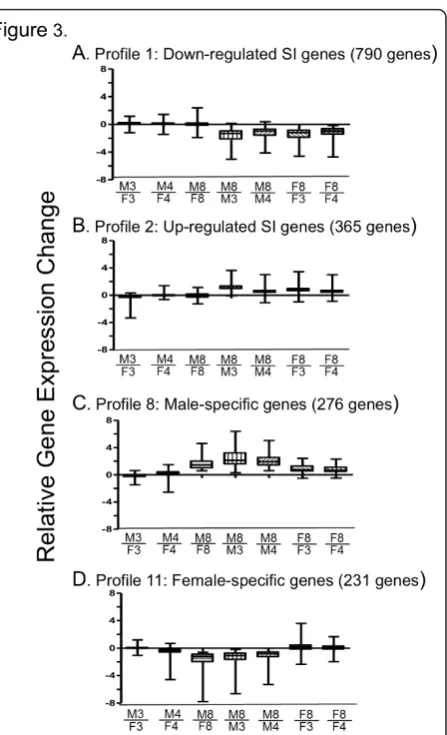
762 of the 1,212 adult sex-specific genes (Figure 3 and Additional file 4A-C). The DAVID annotation tool [37,38] was used to find significant enrichment clusters for each of the twelve STEM profiles; these results are presented in Additional file 5A-C. The largest adult sex-independent gene cluster, STEM profile 1 (Figure 3A), was comprised of 790 genes down regulated from 3 and
4 wk to 8 wk in both sexes and contained 39 significant DAVID enrichment clusters (Additional file 5A). The top three clusters showed very strong enrichment for genes of cell cycle, mitosis and cell division (41.8-fold enrichment), chromosome condensation (23.6-fold enrichment), and DNA damage and repair (11.6-fold enrichment), all con-sistent with the down regulation of cell division in adult
compared to postnatal mouse liver [3]. The largest cluster of up regulated adult sex-independent genes (365 genes, STEM profile 2) was characterized by up regulation after 3 and 4 wk in both male and female liver (Figure 3B). Profile 2 contained two significant DAVID enrichment clusters, genes associated with responses to organic substances and endogenous stimuli, and ion and metal binding (Addi-tional file 5A).
The largest cluster of adult sex-specific genes (276 male-specific genes; STEM profile 8), displayed strong up regulation from 3 and 4 wk to 8 wk in male liver, and weaker up regulation in female liver (Figure 3C).
Figure 2 Numbers of sex-specific genes and patterns of developmental regulation of adult sex-specific genes and adult sex-independent genes. Bar graphs present the number of genes that are either sex-specific in adult mouse liver or are up regulated (U), down regulated (D), or not significantly changed in expression (NC) from 3 wk to 8 wk or from 4 wk to 8 wk in male and female liver, as marked.A. The number of adult sex-specific genes increases from 3 to 8 wk, with onset of sex-specificity primarily occurring between 4 wk and 8 wk.B. Adult male-specific genes are predominantly up regulated in male liver, while in female liver they are mostly not regulated.C. Adult female-specific genes are primarily down regulated or are not regulated in male liver, while in female liver they are mostly not regulated.D. A somewhat greater number of adult sex-independent genes are regulated from 3 or 4 wk to 8 wk in male liver compared to female liver.
This profile contained three significant enrichment clus-ters, consisting of genes involved in pheromone binding and microsomal cytochrome P450/monooxygenase activity (Additional file 5B). The largest female-specific gene cluster (231 genes; STEM profile 11) was charac-terized by down regulation in male liver from 3 and 4 wk to 8 wk, without a change in female liver (Figure 3D). This profile contained 9 significant enrichment clusters, including cytochrome P450/monooxygenase activity, acyl CoA thioesterase, peroxisome, flavin mono-oxygenase, sulfotransferase, and lipid biosynthesis (Addi-tional file 5C).
HNF4a-dependence of developmentally responsive genes
To investigate whether the post-pubertal developmental changes that we observed are associated with a depen-dence of gene expression on HNF4a, a major regulator of liver-specific gene expression [25,40,41], we compared the gene groups showing up or down regulation during post-pubertal development to genes whose expression is either up or down regulated in response to liver-specific ablation of HNF4a[24]. In both male and female liver, genes up regulated from 3 wk to 8 wk showed highly significant enrichment for genes positively regulated by HNF4a(p= E-77 to E-110), and genes down regulated from 3 wk to 8 wk showed highly significant enrichment for the set of genes negatively regulated by HNF4a(p= E-66 to E-67) (Table 2). To determine whether adult sex-specific genes contribute to these enrichments, enrichment scores were calculated separately for male-specific and female-male-specific genes. Enrichment analysis was also calculated for stringent sex-independent genes, which were selected to exclude genes showing weak sex-specificity at 8 wk (see Materials and Methods). We found that male-specific genes contributed to the enrichment of the developmentally up regulated genes in genes positively regulated by HNF4a in both male liver (p= 8.8E-56) and female liver (p= 9.4E-09) (Addi-tional file 6A). Male-specific genes also contributed to the enrichment of the genes down regulated develop-mentally in the set of genes negatively regulated by HNF4ain female liver (p= 5.6E-07), but not male liver (Additional file 6A). Female-specific genes contributed to the enrichment of the developmentally up regulated genes in genes positively regulated by HNF4ain female liver (p = 2.0E-27), and to the enrichment of develop-mentally down regulated genes in genes negatively regu-lated by HNF4ain male liver (p= 5.0E-38) (Additional file 6A). Stringent sex-independent genes showed the same patterns of enrichment that are seen for all genes in Table 2 (Additional file 6A). Moreover, significant overlap was seen between stringent sex-independent genes that are up regulated from 3 to 8 wk and genes that are positively regulated by HNF4a(66% overlap),
and similarly, between stringent sex-independent genes that are down regulated from 3 to 8 wk and genes that are negatively regulated by HNF4a(65% overlap). Thus, both adult sex-independent and adult sex-specific genes are subject to positive regulation by HNF4a, in the case of the developmentally induced genes, and are subject to negative regulation by HNF4a, in the case of the developmentally repressed genes.
Pituitary dependence of developmentally responsive genes
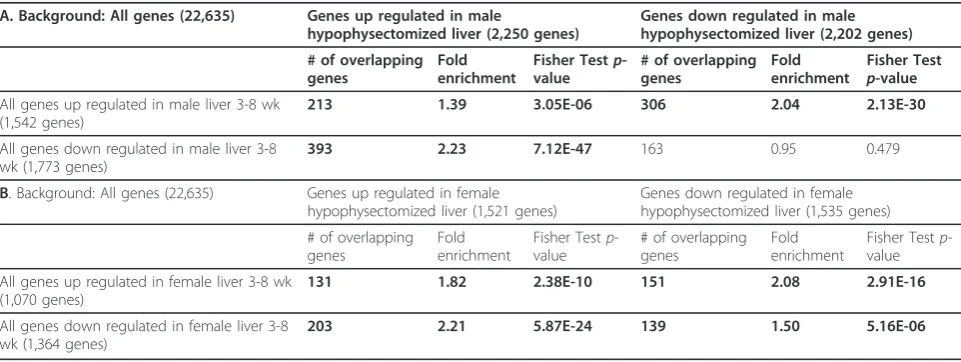
Growth hormone (GH) is an established regulator of a large majority of sex-specific gene expression in adult mouse and rat liver [5]. At 3 wk of age, serum concentra-tions of GH are low and subsequently increase in both male and female mice [42,43], with the temporal pattern of pituitary GH secretion becoming sexually dimorphic by 8 wk of age [44,45]. To investigate whether the observed developmental changes in liver gene expression might reflect changes in secretion of GH or other pitui-tary-dependent hormones, we compared the sets of genes that are up or down regulated from 3 to 8 wk of age to the sets of genes whose expression is altered following hypophysectomy [27]. Genes that were down regulated in either sex from 3 to 8 wk showed the strongest enrich-ment for genes up regulated following hypophysectomy, i.e., genes negatively regulated by pituitary hormone (p= E-24 to E-47) (Table 3). Conversely, genes up regulated from 3 to 8 wk showed the strongest enrichment for genes positively regulated by pituitary hormone (p= E-16 to E-30) (Table 3). This suggests that developmental changes in pituitary hormones, or pituitary-dependent hormones, play a significant role in the observed develop-mental changes in gene expression. Enrichment scores calculated separately for male-specific, female-specific, and stringent sex-independent genes showed that male-specific genes contributed to the enrichment of the developmentally up regulated genes in genes positively regulated by pituitary hormone in male liver, whereas female-specific genes contribute to the enrichment seen for the down regulated genes in male liver and to the enrichment seen for the up regulated genes in female liver (Additional file 6B). In contrast, the stringent sex-independent genes that were developmentally up regu-lated showed enrichment for genes under negative pitui-tary regulation (p= E-10 to E-18), suggesting that their up regulation from 3 to 8 wk reflects the loss of an inhi-bitory pituitary factor (Additional file 6B).
Developmental changes in expression of transcriptional regulators
sex-independent genes were identified as potential tran-scriptional regulators by their Gene Ontology (GO) descriptors. 37 of these genes showed at least a 2-fold change in expression on all arrays that had a significant p-value (p< 0.0001) (Additional file 7A). DAVID analy-sis of the 37 genes identified 12 significant clusters, 5 of which were closely associated with transcription. The other 7 clusters consisted of genes that contain a basic motif, or are involved in circadian rhythm, chromosomal organization, DNA replication, DNA repair or metal ion binding (Additional file 7B).
Using a similar approach, 23 male-specific genes and 32 female-specific genes were identified as potential
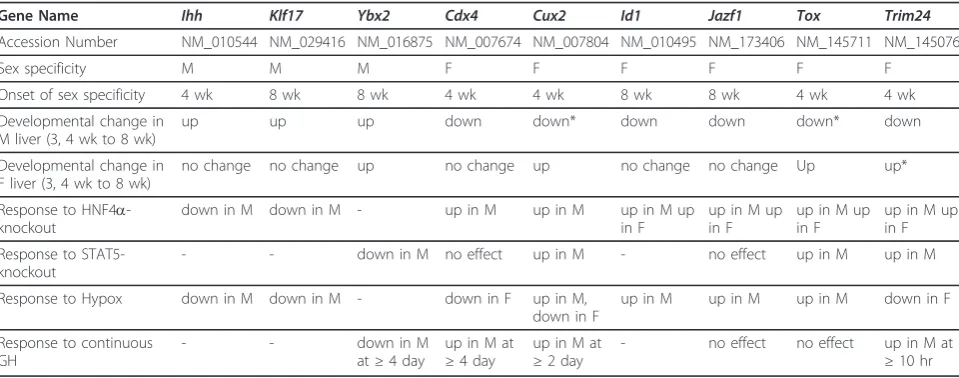
transcriptional regulators. Within these groups, 3 male-specific and 6 female-male-specific genes had a sex-bias of at least 2-fold at 8 wk and were confirmed as showing sex-specific expression in earlier mouse liver microarray stu-dies (Table 4) [27,32]. Four of these transcriptional regu-lators did not show sex-specific expression until 8 wk (Id1, Jazf1, Klf17, Ybx2) while the other five displayed sex-specificity by 4 wk (Cdx4, Cux2, Ihh, Tox, Trim24). The three male-specific transcriptional regulators (Ihh, Klf17, Ybx2) were up regulated from 3 wk to 8 wk in male liver, whileYbx2was also up regulated from 3 to 8 wk in female liver. All 6 female-specific transcriptional regulator genes were down regulated in male liver after Table 2 Genes showing developmental changes are enriched for genes altered by liver-specific deletion of HNF4a
A. Background: All genes (22,831) Genes up regulated in male HNF4a- deficient liver (2,619 genes)
Genes down regulated in male HNF4a -deficient liver (2,712 genes)
# of overlapping genes
Fold enrichment
Fisher Testp -value
# of overlapping genes
Fold enrichment
Fisher Test
p-value
All genes up regulated in male liver 3-8 wk (1,550 genes)
127 0.71 4.61E-05 537 2.92 3.87E-110
All genes down regulated in male liver 3-8 wk (1,791 genes)
486 2.37 1.15E-66 131 0.62 9.10E-10
B. Background: All genes (22,831) Genes up regulated in female HNF4a- deficient liver (2,227 genes)
Genes down regulated in female HNF4a -deficient liver (2,255 genes)
# of overlapping genes
Fold enrichment
Fisher Testp -value
# of overlapping genes
Fold enrichment
Fisher Testp -value
All genes up regulated in female liver 3-8 wk (1,087 genes)
93 0.88 0.208 337 3.14 2.43E-77
All genes down regulated in female liver 3-8 wk (1,360 genes)
366 2.76 6.39E-67 85 0.63 4.35E-06
Genes identified in the present microarray study were grouped based on their regulation from 3 wk to 8 wk and compared to genes from a previous microarray study [24] grouped by their response to liver-specific HNF4a-deficiency. All of the genes used to calculate the enrichment scores shown in this Table were represented on both microarray platforms. Total numbers of genes comprising each group are shown in parenthesis. Sample enrichment score calculation: [% of the genes down regulated in male liver from 3 wk to 8 wk that are up-regulated in male HNF4a-knockout mouse liver]/[% of all genes that are up-regulated in male HNF4a-knockout mouse liver], i.e., (486/1,791)/(2,619/22,831) = 2.37 fold enrichment. Bold text indicates enrichment with a highly significantp-value (p< 0.0001, Fisher’s exact test), anditalictext indicates depletion with a highly significantp-value (p< 0.0001, Fisher’s exact test).
Table 3 Genes showing developmental changes are enriched for genes altered by hypophysectomy
A. Background: All genes (22,635) Genes up regulated in male
hypophysectomized liver (2,250 genes)
Genes down regulated in male hypophysectomized liver (2,202 genes)
# of overlapping genes
Fold enrichment
Fisher Testp -value
# of overlapping genes
Fold enrichment
Fisher Test
p-value
All genes up regulated in male liver 3-8 wk (1,542 genes)
213 1.39 3.05E-06 306 2.04 2.13E-30
All genes down regulated in male liver 3-8 wk (1,773 genes)
393 2.23 7.12E-47 163 0.95 0.479
B. Background: All genes (22,635) Genes up regulated in female hypophysectomized liver (1,521 genes)
Genes down regulated in female hypophysectomized liver (1,535 genes)
# of overlapping genes
Fold enrichment
Fisher Testp -value
# of overlapping genes
Fold enrichment
Fisher Testp -value
All genes up regulated in female liver 3-8 wk (1,070 genes)
131 1.82 2.38E-10 151 2.08 2.91E-16
All genes down regulated in female liver 3-8 wk (1,364 genes)
203 2.21 5.87E-24 139 1.50 5.16E-06
3 or 4 wk, but in female liver showed no change in expression (Cdx4, Jazf1, Id1) or were up regulated from 3 or 4 wk to 8 wk (Cux2, Tox, Trim24).
qPCR validation
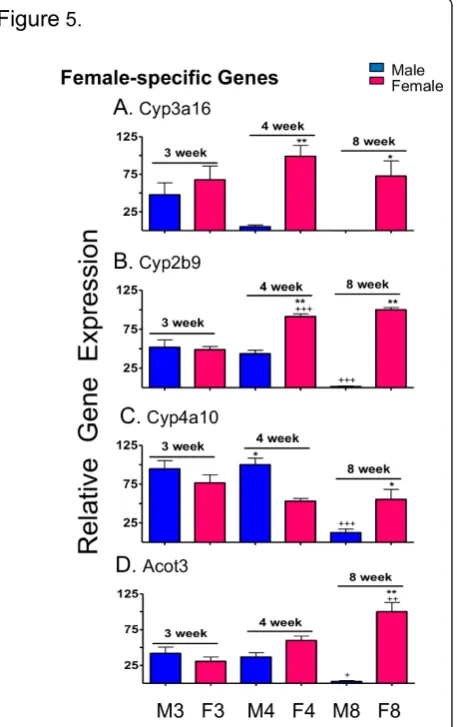
qPCR was used to validate the results obtained from the above-described developmental patterns for a selected group of sex-specific genes. One of the four adult male-specific genes investigated (Hsd3b5) was expressed at a significantly higher level in male than female liver by 4 wk and significantly increased with age in male liver (p< 0.01 from 3 wk to 4 wk and p< 0.001 from 4 wk to 8 wk) (Figure 4A). The other three genes (C6, Cyp2u1, Gstp) did not show significant sex differences in expression until 8 wk (p< 0.001) (Figure 4B-D). Two of the adult female-specific genes exam-ined (Cyp3a16, Cyp2b9) displayed sex-specificity at 4 wk (p < 0.001) (Figure 5A, B), while a third gene (Cyp4a10) showed significant male-bias at 4 wk (p < 0.01) (Figure 5C). All four genes displayed significant female-biased expression at 8 wk, as expected (Figure 5A-D). Two-way ANOVA analysis indicated significant (p < 0.0001) interaction between age and sex for all genes examined, except Cyp3a16. These qPCR profiles were remarkably similar to the corresponding microar-ray profiles (Additional file 8, Additional file 9) except in the case of Cyp3a16, where the microarray probe indicated a much lower sex-difference due to its sub-stantial cross-hybridization with Cyp3a11, an adult sex-independent gene.
Discussion
The present study of genome-wide transcriptional pro-files in mouse liver was conducted to identify develop-mental changes that occur from 3 wk (weaning) to 4 wk (just prior to puberty) to 8 wk of age (young adulthood). During this period of development the liver is completing its final stages of growth and liver function is changing from hematopoiesis to regulation of metabolism and other biological processes, including bile secretion, xeno-biotic metabolism, and cholesterol homeostasis [3,8,47]. Genes involved in growth, cell cycle, and DNA replica-tion were found to be down regulated after 3 wk and 4 wk, while genes associated with specialized liver func-tions such as drug metabolism and inflammatory response were up regulated. The latter findings are simi-lar to another study where down regulation of genes associated with mitosis, DNA replication, RNA splicing, and transcription was seen at postnatal days 7, 14, 21 and 126 compared to the mean expression level determined at 14 different time points, beginning in embryonic devel-opment [3]. Additionally, extensive changes in the expression of adult sex-specific genes were observed, especially in male liver, where the majority of male-speci-fic genes were up regulated and nearly half of female-spe-cific genes were down regulated. Developmental changes in adult sex-independent genes were also more extensive in male liver compared to female liver.
Genes up regulated from 3 to 8 wk were significantly enriched in the set of genes positively regulated by the liver transcription factor HNF4a, as determined by their Table 4 Sex-specific transcriptional regulators
Gene Name Ihh Klf17 Ybx2 Cdx4 Cux2 Id1 Jazf1 Tox Trim24
Accession Number NM_010544 NM_029416 NM_016875 NM_007674 NM_007804 NM_010495 NM_173406 NM_145711 NM_145076
Sex specificity M M M F F F F F F
Onset of sex specificity 4 wk 8 wk 8 wk 4 wk 4 wk 8 wk 8 wk 4 wk 4 wk
Developmental change in M liver (3, 4 wk to 8 wk)
up up up down down* down down down* down
Developmental change in F liver (3, 4 wk to 8 wk)
no change no change up no change up no change no change Up up*
Response to HNF4a -knockout
down in M down in M - up in M up in M up in M up
in F
up in M up in F
up in M up in F
up in M up in F
Response to STAT5-knockout
- - down in M no effect up in M - no effect up in M up in M
Response to Hypox down in M down in M - down in F up in M,
down in F
up in M up in M up in M down in F
Response to continuous GH
- - down in M
at≥4 day
up in M at
≥4 day
up in M at
≥2 day
- no effect no effect up in M at
≥10 hr
Adult sex-specific genes with a |fold change| > 2 andp< 0.0001 for the male 8 wk vs. female 8 wk microarray comparison and having GO descriptors that contain the words“DNA binding”or“transcription”were identified as potential transcriptional regulators. The transcription factor genes listed in this table were previously found to be altered in expression in response to hypophysectomy [27], STAT5b-deficiency [32], HNF4a-deficiency [24], or treatment with continuous GH [46]. M, male, F, female
* Indicates a gene that displayed a developmental change at 4 wk but not 3 wk
response to liver-specific deletion of HNF4a[24], while genes down regulated during this developmental period showed significant enrichment for genes negatively regu-lated by HNF4a. However, some differences in HNF4a regulation of the developmentally regulated genes were seen between male and female liver (Table 5). The posi-tive effects of HNF4aon developmentally up regulated female-specific genes were only apparent in female liver, while negative effects of HNF4a on developmentally down regulated genes were associated with male-specific genes in female liver and with female-specific genes in
male liver. Consistent with these findings, binding sites for HNF4a are overrepresented in genes that are up regulated at postnatal day 7, 14, 21, and 126 compared to the mean expression value at 14 developmental time points [3]. The highly significant association shown here between developmental up regulation and positive regu-lation by HNF4a, and between developmental down regulation and negative regulation by HNF4a suggests that the expression or activity of HNF4aor an HNF4a -dependent factor(s) increases in mouse liver from 3 wk to 8 wk. However, no change in HNF4a mRNA levels between 3 wk and 8 wk was seen on our microarrays. HNF4a protein and mRNA are both induced at birth and increase to adult-like levels within 2 weeks, at which time expression of HNF4a7, an alternative
Figure 4qPCR analysis of male-specific genes. qPCR analysis of relative RNA levels in male (M) and female (F) livers at 3, 4 and 8 wk, as marked at the bottom. Data shown for the four indicated adult male-specific genes are normalized to the 18S RNA of each sample, and based on n = 9-10 individuals per group (mean ± SEM). Statistical analysis (two-way ANOVA with Bonferroni post tests) was as follows: *p< 0.01, and **p< 0.001, for male vs. female comparisons at each age; +p< 0.05, ++p< 0.01, and +++p< 0.001, for 4 wk vs. 3 wk, and for 8 wk vs. 4 wk comparisons within each sex. Very similar results were obtained by microarray analysis (Additional file 8).
isoform with a unique N-terminal protein sequence is extinguished [48]. Further study is required to elucidate the mechanisms by which HNF4a contributes to the developmental changes of both specific and sex-independent genes.
Comparison of the genes undergoing developmental changes to the set of genes whose expression changes in mouse liver following hypophysectomy [27] revealed dif-ferences in the regulation by pituitary hormone between male and female liver (Table 5). In male liver, pituitary hormone positively regulates male-specific genes that are up regulated from 3 wk to 8 wk, while negatively regulat-ing female-specific genes that are down-regulated durregulat-ing the same time period. In contrast, in female liver, pitui-tary hormone positively regulated female-specific genes up regulated during female development but did not show significant enrichment for effects on male-specific genes. These differences in pituitary hormone regulation of sex-specific genes in male vs. female liver could be explained by the sex differences in pituitary GH secretion patterns, which are known to regulate many sex-depen-dent genes in the liver [5]. We also observed pituitary hormone regulation of the developmentally regulated stringent sex-independent genes, with negative regulation by pituitary hormone apparent in male liver, and both positive and negative regulation apparent in female liver (Table 5). The latter finding could be explained by increased secretion of a negative regulatory factor after 3 wk of age, or by decreased secretion of a positive regula-tory factor. One such candidate factor is corticosterone, whose adrenal production is stimulated by adrenocorti-cotropic hormone (ACTH) produced by the anterior pituitary gland, and has ~3 times higher plasma concen-trations in 20 day old mice compared to adult male mice [49].
We sought to identify transcriptional regulators that undergo developmental changes in mouse liver, as these could serve as regulators of the developmental changes in RNA transcripts described here. Seven developmentally regulated adult sex-independent transcriptional regula-tors (Asf1b, Hells, Hmgb2, Padi4, Ppard, Prim2, Top2a) are associated with chromosomal organization and were down regulated from 3-4 wk to 8 wk. One or more of these transcription factors could be associated with the down regulation of cell cycle and mitosis that occurs in liver from the postnatal period to puberty [8]. Seven other adult sex-independent transcriptional regulators identified here (Arntl, Cry1, Dbp, Nr1d1, Per2, Per3, Tef) help establish circadian rhythms. Many genes are expressed in a circadian manner in the liver, most nota-bly genes active in drug metabolism and bile acid synth-esis, including sex-specific genes [50-52]. A related gene, Per1, changes in expression at postnatal day 22 in rat liver [53]. Another study found that clock-associated genes become rhythmic by postnatal day 30 [54].
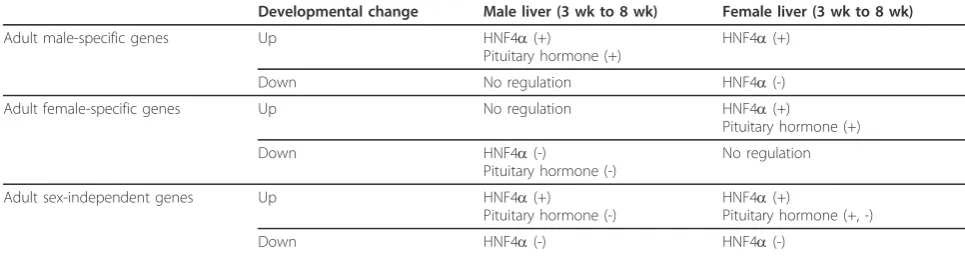
Prior studies of sex-specific hepatic gene expression have primarily focused on the adult period. Presently, excluding Y-chromosome genes, we found only 13 adult sex-specific genes that displayed sex-specificity at 3 wk and retained their sex specificity at 4 wk and 8 wk of age. By 4 wk, an additional 104 genes showed female-specific expression and an additional 54 genes displayed male-spe-cific expression. Five of the 158 genes that displayed their adult sex-specificity at 4 wk of age encode transcriptional regulators (Cdx4, Cux2, Ihh, Tox, Trim24); these genes could contribute to the developmental changes leading to global acquisition of liver sex-specificity by 8 wk. Consis-tent with our finding in mouse liver, a microarray study of gene expression in postnatal rat liver (ages ranging from 2 wk to 104 wk) reported very few sex-specific genes at Table 5 Summary of the proposed role of HNF4aand pituitary hormone in developmental changes in liver gene expression
Developmental change Male liver (3 wk to 8 wk) Female liver (3 wk to 8 wk)
Adult male-specific genes Up HNF4a(+)
Pituitary hormone (+)
HNF4a(+)
Down No regulation HNF4a(-)
Adult female-specific genes Up No regulation HNF4a(+)
Pituitary hormone (+)
Down HNF4a(-)
Pituitary hormone (-)
No regulation
Adult sex-independent genes Up HNF4a(+)
Pituitary hormone (-)
HNF4a(+)
Pituitary hormone (+, -)
Down HNF4a(-) HNF4a(-)
2 wk and 5 wk. Moreover, there was a large increase in the number of sex-specific genes, including many genes asso-ciated with drug metabolism, by 8 wk [55].
The major increase in sex-specific gene expression between 4 wk and 8 wk of age shown here for mouse liver can in part be explained by the developmental changes in growth hormone (GH) secretion during this developmen-tal period. GH has an established role in regulating specific gene expression in mouse liver [4-6], and the sex-specific patterns of pituitary GH secretion are imprinted during the neonatal period but are not manifested until puberty [6,42,56].CYP3A4shows female-biased expression in human liver [57] and displays a similar postnatal devel-opment expression pattern in mouse liver when it is intro-duced as a transgene [20,58]. This suggests that the genomic sequences that dictate the observed pattern of developmental repression in male liver are conserved between mouse and human. In the present study, the change from independent expression at 3-4 wk to sex-specific expression at 8 wk was closely associated with the up regulation of male-specific genes and the down regula-tion of female-specific genes in male liver. Conversely, in female liver the most frequent change was one that occurred in both male and female liver. Since GH is known to be the major hormonal regulator of these sex-specific genes, the developmental patterns that we observed suggest that the male-specific GH pattern could either be turning on a transcriptional activator or turning off a transcriptional repressor to up regulate male-specific gene expression. The male-specific GH pattern could also down regulate female-specific genes in male liver by either turning on a transcriptional repressor or by turning off a transcriptional activator. STAT5b and HNF4aare essen-tial transcriptional regulators of sex-specific liver gene expression, and sex-specific genes are enriched for genes that are affected by deletion of STAT5b or HNF4a [24,32,39,46]. However, activation of STAT5 alone is not sufficient to induce male-specific gene expression in pre-pubertal rats [59], indicating that other developmentally regulated factors, such as the 9 sex-specific transcription factors identified in this study, may be required to achieve sex-specific gene expression. Five of the 9 factors displayed developmental changes in male liver only (Table 4), and could contribute to the selective up regulation of male-specific genes and/or down regulation of female-male-specific genes seen in male liver but not female liver. The three male-specific transcription factor genes of interest are transcriptional activators. Y-box protein 2 (Ybx2) is an RNA-binding protein in germ cells but also has the ability to bind to and stimulate transcription of the mouse prota-mine-2 promoter [60]. Indian hedgehog (Ihh) plays a role in endodermal differentiation and can activate gene tran-scription by binding to Patched receptors Ptc1 and Ptc2 [61]. Finally, Kruppel-like factor 17 (Klf17) is a member of
the small protein zinc finger family and can activate tran-scription from CACCC-box elements [62].
The six female-specific transcriptional regulators iden-tified here are either known transcriptional repressors or their function is unknown. Cut-like homeobox 2 (Cux2) is a member of the cut/homeodomain family of tran-scription factors and can act as a trantran-scriptional repres-sor [63]. Caudal type homeobox 4 (Cdx4) is a homeodomain transcription factor that may play a role in hematopoiesis [64]. Thymus high-mobility group box protein (Tox) is a member of the sequence independent high mobility group (HMG) box family and a regulator of differentiation of developing T-cells [65]. Tripartite motif-containing 24 (Trim24) contains a zinc binding motif, a coiled-coiled region, and a RING domain, which has been shown to act as an E3-ubiquitin ligase and target tumor suppressor p53 for degradation [66]. Juxtaposed with another zinc finger protein 1 (Jazf1) contains three zinc finger motifs and is of unknown function but is associated with lipid metabolism, dia-betes mellitus, and prostate cancer [67]. Finally, inhibi-tor of DNA binding 1 (Id1) functions as a negative regulator of basic helix-loop-helix (bHLH) transcription factors and is trans-activated by JAK/STAT5 signaling in erythroid cells [68].
Three of the female-specific genes (Cux2, Tox, Trim24) were previously characterized as potential regulators of sex-specific gene expression [21]. Cux2expression is highly female-specific in both mouse and rat liver [21]. Binding sites for Cux1/Cux2 are statistically overrepre-sented at or near STAT5b-dependent male-specific genes, suggesting that Cux2 could be acting as a repres-sor of male-specific gene expression in female liver [21]. Further characterization of Cux2 and the other sex-speci-fic transcriptional regulators is required to ascertain their contributions to sex-specific liver gene expression.
Overall, the observed changes in liver gene expression from the pre-pubertal period to young adulthood reflect the deceleration of liver growth and the induction of spe-cialized liver functions. The number of sex-biased genes expressed during this period also increased dramatically at this time. Widespread changes in both sex-indepen-dent and sex-biased genes were observed, and primarily occurred in male liver. This male bias in these gene expression changes may be due to differences in pituitary hormone secretion and/or regulation by HNF4a.
Additional material
Additional file 1: qPCR primers. Primers used for qPCR validation of microarray results for selected male-specific (Cyp2u1, C6, GSTpi, Hsd3b5) and female specific (Acot3, Cyp2b9, Cyp3a16, Cyp4a10) genes.
Additional file 2: Explanation of total flagging sum (TFS)
TFS number is assigned to each gene (microarray probe) represented on the microarray based on the pattern of regulation that the gene exhibits across the set of 7 microarrays. Each of the 7 digits to the right of the decimal point place represents one the 7 microarrays, numbered sequentially from left to right, as indicated. A value of 0 indicates the gene does not meet the conditions for significant differential gene expression (as defined in Methods) for that microarray, a value of 1 indicates up regulation, and a value of 2 indicates down regulation. In the example shown, for a gene assigned TFS number 28.0022200, the 1st and 2nddecimal places are both 0, indicating that the gene is sex-independent at 3 and 4 wk. The 3rddecimal places is 2, indicating that the gene is female-specific at 8 wk. The 4thand 5thdecimal places are 2, indicating that the gene is down regulated from 3 and 4 wk to 8 wk in male liver. The 6thand 7thdecimal places are 0, indicating that there is no regulation of the gene from 3 and 4 wk to 8 wk in female liver. Each decimal place is also assigned a binary flag value: 1stdecimal place = 1, 2nddecimal place = 2, 3rddecimal = 4, 4thdecimal = 8, 5thdecimal = 16, 6thdecimal = 32, and 7thdecimal = 64. The whole number portion of the TFS is calculated by adding the binary flag value of each decimal place representing a microarray that met the thresholds for significance. Thus, the whole number portion of the TFS number is calculated as 28 = 4 (3rddecimal place) + 8 (4thdecimal place) + 16 (5thdecimal place).
Additional file 3: A.Number of differentially expressed (regulated) genes in each of the seven microarray comparisons. Each gene listed in this table meets the threshold requirements of a |fold change| > 1.5,p< 0.0001, and has a well above background intensity value for at least one of the seven microarray comparisons. The number of sex-specific genes greatly increased from 3 wk to 8 wk; also see Table 1. A larger number of genes changed from 3 or 4 wk to 8 wk in male liver compared to female liver.B. Detailed microarray data for each of the 5,715 regulated genes. Each gene listed in this table meets the threshold requirements as in Additional file 3A. Data shown include Rosetta-computed weighted ratios, Rosettap-values, and microarray signal intensities for the 7 microarray experiments. The“is well above background”value column uses a binary value to identify arrays that met this requirement (score = 1), as well as arrays where this requirement was not met (score = 0.1 or 0.01), in which case the probe is considered as not meeting the threshold for significance for that array, irrespective of the fold-change and p-values shown. Stringent sex-independent genes meet the criteria of a |fold change| < 1.2, ap-value > 0.01, and a minimum intensity of 25. Genes that do not meet this criteria and do not meet the criteria of sex-specificity (|fold change| > 1.5 andp-value < 0.0001) are labeled as sex-independent.C. Developmental changes in expression during pre-pubertal period. The gene changes listed take into account the developmental changes occurring from both 3 wk to 8 wk and from 4 wk to 8 wk and are based on the TFS number assigned to each gene (Additional file 2). The most prominent developmental change observed was a change in male liver only. A larger percentage of genes displayed a developmental change in male liver (77%) than in female liver (53%).
Additional file 4: A. Box and whisker plots representing gene expression patterns in STEM cluster profiles 9, 10, and 12. Boxes represent the 25thto the 75thpercentile of gene expression ratios for each of the 7 microarray comparisons indicated below the X-axis. A horizontal line across each box indicates the median expression ratio. The whiskers that extend above and below each box represent the highest and the lowest values. M3, male at 3 wk; M4, male at 4 wk; M8, male at 8 wk; F3, female at 3 wk; F4, female at 4 wk; and F8, female at 8 wk. (A) Profile 9 is comprised of male-specific genes that are up regulated from 3 wk to 8 wk and from 4 wk to 8 wk in male liver but not in female liver. (B) Profile 10 is comprised of male-specific genes that are, on average, slightly up regulated from 3 wk to 8 wk and from 4 wk to 8 wk in male liver and slightly down regulated from 3 wk to 8 wk in female liver. (C) Profile 12 is comprised of female-specific genes that are up regulated from 3 wk to 8 wk and from 4 wk to 8 wk in female liver.
B. Box and whisker plots representing gene expression patterns in STEM cluster profiles 3, 4, and 5. Graphs are presented as in Additional file 4A. (A) Profile 3 is comprised of sex-independent (SI) genes that are up regulated from 3 wk to 8 wk and from 4 wk to 8 wk in both male and female liver. (B) Profile 4 is comprised of sex-independent genes that are up regulated from 3 wk to 8 wk and from 4 wk to 8 wk in male liver. (C)
Profile 5 is comprised of sex-independent genes that are up regulated from 3 wk to 8 wk and from 4 wk to 8 wk in female liver, but show weak up regulation in male liver.C. Box and whisker plots representing gene expression patterns in STEM cluster profiles 6 and 7. Graphs are presented as in Additional file 4A. (A) Profile 6 is comprised of sex-independent (SI) genes that are down regulated from 3 wk to 8 wk in both male and female liver and from 4 wk to 8 wk in male liver. (B) Profile 7 is comprised of sex-independent genes that are down regulated from 3 wk to 8 wk and 4 wk to 8 wk in male liver, while slightly up or down regulated from 3 wk to 8 wk in female liver.
Additional file 5: Significant DAVID functional annotation clusters found for each STEM cluster. Each STEM cluster was analyzed using the DAVID annotation tool. DAVID annotation clusters with a minimum enrichment score of 1.3 (equivalent to ap-value of 0.05) for the genes in each STEM profile are shown, listed in descending order of enrichment score. Thep-values (also referred to as the Ease Score) are derived from a one-tail Fisher Exact Test.A. DAVID functional annotation clusters for the 7 sex-independent STEM clusters.B. DAVID functional annotation clusters for the 3 male-specific STEM clusters.C. DAVID functional annotation clusters for the 2 female-specific STEM clusters.
Additional file 6: A.Genes showing developmental changes are enriched for genes altered by liver-specific deletion of HNF4a. Shown here is the enrichment information presented in Table 2 for all genes, as well as the additional enrichment scores calculated separately for male-specific, female-male-specific, and stringent sex-independent genes. Stringent sex-independent genes had a |fold-change| < 1.2, ap-value > 0.01, and a microarray intensity≥25. All genes were used as the background gene set when calculating the enrichment scores for male-specific, female-specific, and all genes. All stringent sex-independent genes were used as the background when calculating the enrichment scores for stringent sex-independent genes. Fold enrichments (i.e., enrichment scores) were calculated as described in Table 2. The results presented in this table show which groups of genes are contributing to the significant enrichment scores reported based on an analysis of all genes in Table 2. For example, the enrichment between all genes down-regulated in male liver from 3 wk to 8 wk and genes up-regulated in HNF4aKO male liver (2.37-fold,p-value 1.15E-66) (Table 2) is seen in this table to be due to contributions from female-specific genes (3.7-fold,p-value 4.98E-38) and stringent sex-independent genes (1.92-fold,p-value 6.23E-15), but not male-specific genes (1.65-fold,p-value 0.418).B. Genes showing developmental changes are enriched for genes altered by
hypophysectomy. This table shows the enrichment data presented in Table 3 for all genes, together with enrichment scores calculated separately using male-specific, female-specific, and stringent sex-independent genes. Stringent sex-sex-independent genes had a |fold-change| < 1.2, ap-value > 0.01, and a microarray signal intensity≥25. The set of all genes common to both microarray platforms was used as the background when calculating the enrichment scores for male-specific, female-male-specific, and all genes. The set of all stringent sex-independent genes was used as the background when calculating the enrichment scores for stringent sex-independent genes. Enrichments scores were calculated as described in Table 3. The results presented in this table show which groups of genes (male-specific, female-specific and stringent sex-independent genes) are contributing to the significant enrichment scores reported based on an analysis of all genes in Table 3. For example, the enrichment between all genes down regulated in male liver from 3 wk to 8 wk and genes up regulated in hypophysectomized male liver (2.23-fold,p-value 7.12E-47) (Table 3) is seen in this table to be due to contributions from female-specific genes (enrichment score = 4.03-fold,p-value 4.40E-37) but not from male-specific genes (enrichment = 0.67-fold,p-value 1) or from stringent sex-independent genes (enrichment = 1.51-fold,p-value .0001277), neither of which show significant enrichment.
here are DAVID annotation clusters with a minimum enrichment score of 1.3 (equivalent to ap-value of 0.05), listed in descending order of cluster enrichment score. Thep-values (also referred to as the Ease Score) are derived from a one-tail Fisher Exact Test.
Additional file 8: Microarray intensities of male-specific genes. These graphs present the relative microarray intensities of each indicated male-specific gene. Expression patterns are very similar to those determined by qPCR analysis in Figure 4.
Additional file 9: Microarray intensities of female-specific genes. These graphs present the relative microarray intensities of each indicated female-specific gene. Expression patterns are very similar to those determined by qPCR analysis in Figure 5. The exception isCyp3a16, whose microarray probe cross-hybridizes withCyp3a11, a non-sex-specific gene, which results in a much lower sex-difference that that observed by qPCR.
Acknowledgements
This work was supported by National Institutes of Health (NIH) Grant DK33765 (to D.J.W.). Microarray analysis and data analysis using Rosetta Resolver software were carried out at the Functional Genomics and Bioinformatics Facility at Wayne State University under the direction of Dr. Alan Dombkowski. The authors thank Dr. Dombkowski for many useful discussions.
Authors’contributions
TLC carried out all of the laboratory studies and data analysis and contributed to writing all sections of the paper. DJW acted as mentor for study design, data analysis, and contributed to writing and editing all sections of the paper. All authors read and approved the final version of the manuscript.
Competing interests
The authors declare that they have no competing interests.
Received: 3 January 2012 Accepted: 4 April 2012 Published: 4 April 2012
References
1. Si-Tayeb K, Lemaigre FP, Duncan SA:Organogenesis and development of the liver.Dev Cell2010,18(2):175-189.
2. Spear BT, Jin L, Ramasamy S, Dobierzewska A:Transcriptional control in the mammalian liver: liver development, perinatal repression, and zonal gene regulation.Cell Mol Life Sci2006,63(24):2922-2938.
3. Li T, Huang J, Jiang Y, Zeng Y, He F, Zhang MQ, Han Z, Zhang X: Multi-stage analysis of gene expression and transcription regulation in C57/B6 mouse liver development.Genomics2009,93(3):235-242.
4. Mode A, Gustafsson JA:Sex and the liver - a journey through five decades.Drug Metab Rev2006,38(1-2):197-207.
5. Waxman DJ, O’Connor C:Growth hormone regulation of sex-dependent liver gene expression.Mol Endocrinol2006,20(11):2613-2629.
6. Waxman DJ, Holloway MG:Sex differences in the expression of hepatic drug metabolizing enzymes.Mol Pharmacol2009,76(2):215-228. 7. Chowen JA, Frago LM, Argente J:The regulation of GH secretion by sex
steroids.Eur J Endocrinol2004,151(Suppl 3):U95-U100.
8. Delone GV, Uryvaeva IV, Koretskii VF, Brodskii V:Analysis of the postnatal growth of the mouse liver by estimating the hepatocyte count, their weight and ploidy.Ontogenez1987,18(3):304-308.
9. Apte U, Zeng G, Thompson MD, Muller P, Micsenyi A, Cieply B, Kaestner KH, Monga SP:beta-Catenin is critical for early postnatal liver growth.Am J Physiol Gastrointest Liver Physiol2007,292(6):G1578-G1585.
10. Finkielstain GP, Forcinito P, Lui JC, Barnes KM, Marino R, Makaroun S, Nguyen V, Lazarus JE, Nilsson O, Baron J:An extensive genetic program occurring during postnatal growth in multiple tissues.Endocrinology
2009,150(4):1791-1800.
11. Singh JS, Rall LB, Styne DM:Insulin-like growth factor I and II gene expression in Balb/C mouse liver during postnatal development.Biol Neonate1991,60(1):7-18.
12. Bagshaw JC, Bond BH:Postnatal development of mouse liver: increasing RNA polymerase activity and orotic acid incorporation.Differentiation
1974,2(5):269-273.
13. Henning SJ:Postnatal development: coordination of feeding, digestion, and metabolism.Am J Physiol1981,241(3):G199-G214.
14. Subramanian M, Katyare SS:Oxidative phosphorylation in mouse liver mitochondria during weaning.Mech Ageing Dev1990,54(2):121-129. 15. Hart SN, Cui Y, Klaassen CD, Zhong XB:Three patterns of cytochrome
P450 gene expression during liver maturation in mice.Drug Metab Dispos2009,37(1):116-121.
16. Elbarbry FA, McNamara PJ, Alcorn J:Ontogeny of hepatic CYP1A2 and CYP2E1 expression in rat.J Biochem Mol Toxicol2007,21(1):41-50. 17. Kocarek TA, Duanmu Z, Fang HL, Runge-Morris M:Age- and
sex-dependent expression of multiple murine hepatic hydroxysteroid sulfotransferase (SULT2A) genes.Biochem Pharmacol2008, 76(8):1036-1046.
18. Sakuma T, Endo Y, Mashino M, Kuroiwa M, Ohara A, Jarukamjorn K, Nemoto N:Regulation of the expression of two female-predominant CYP3A mRNAs (CYP3A41 and CYP3A44) in mouse liver by sex and growth hormones.Arch Biochem Biophys2002,404(2):234-242. 19. Jarukamjorn K, Sakuma T, Yamamoto M, Ohara A, Nemoto N:
Sex-associated expression of mouse hepatic and renal CYP2B enzymes by glucocorticoid hormones.Biochem Pharmacol2001,62(2):161-169. 20. Cheung C, Yu AM, Chen CS, Krausz KW, Byrd LG, Feigenbaum L,
Edwards RJ, Waxman DJ, Gonzalez FJ:Growth hormone determines sexual dimorphism of hepatic cytochrome P450 3A4 expression in transgenic mice.J Pharmacol Exp Ther2006,316(3):1328-1334.
21. Laz EV, Holloway MG, Chen CS, Waxman DJ:Characterization of three growth hormone-responsive transcription factors preferentially expressed in adult female liver.Endocrinology2007,148(7):3327-3337. 22. Waxman DJ, Dannan GA, Guengerich FP:Regulation of rat hepatic
cytochrome P-450: age-dependent expression, hormonal imprinting, and xenobiotic inducibility of sex-specific isoenzymes.Biochemistry1985, 24(16):4409-4417.
23. Chen LJ, Kane B, Bujanover Y, Thaler MM:Development and regulation of bile salt sulfotransferase in rat liver.Biochim Biophys Acta1982, 713(2):358-364.
24. Holloway MG, Miles GD, Dombkowski AA, Waxman DJ:Liver-specific hepatocyte nuclear factor-4alpha deficiency: greater impact on gene expression in male than in female mouse liver.Mol Endocrinol2008, 22(5):1274-1286.
25. Hayhurst GP, Lee YH, Lambert G, Ward JM, Gonzalez FJ:Hepatocyte nuclear factor 4alpha (nuclear receptor 2A1) is essential for maintenance of hepatic gene expression and lipid homeostasis.Mol Cell Biol2001, 21(4):1393-1403.
26. Ling G, Sugathan A, Mazor T, Fraenkel E, Waxman DJ:Unbiased, genome-wide in vivo mapping of transcriptional regulatory elements reveals sex differences in chromatin structure associated with sex-specific liver gene expression.Mol Cell Biol2010,30(23):5531-5544.
27. Wauthier V, Sugathan A, Meyer RD, Dombkowski AA, Waxman DJ:Intrinsic sex differences in the early growth hormone responsiveness of sex-specific genes in mouse liver.Mol Endocrinol2010,24(3):667-678. 28. Zhang Y, Laz EV, Waxman DJ:Dynamic, sex-differential STAT5 and BCL6
binding to sex-biased, growth hormone-regulated genes in adult mouse liver.Mol Cell Biol2011,32(4):880-896.
29. Weng L, Dai H, Zhan Y, He Y, Stepaniants SB, Bassett DE:Rosetta error model for gene expression analysis.Bioinformatics2006,22(9):1111-1121. 30. Rajagopalan D:A comparison of statistical methods for analysis of high density oligonucleotide array data.Bioinformatics2003,19(12):1469-1476. 31. Gene Expression Omnibus.[http://www.ncbi.nlm.nih.gov/geo]. 32. Clodfelter KH, Holloway MG, Hodor P, Park SH, Ray WJ, Waxman DJ:
Sex-dependent liver gene expression is extensive and largely Sex-dependent upon signal transducer and activator of transcription 5b (STAT5b): STAT5b-dependent activation of male genes and repression of female genes revealed by microarray analysis.Mol Endocrinol2006,
20(6):1333-1351.
33. Eisen MB, Spellman PT, Brown PO, Botstein D:Cluster analysis and display of genome-wide expression patterns.Proc Natl Acad Sci USA1998, 95(25):14863-14868.
34. Saldanha AJ:Java Treeview-extensible visualization of microarray data.