ISSN Online: 2331-4249 ISSN Print: 2331-4222
DOI: 10.4236/wjet.2018.63B005 Aug. 29, 2018 37 World Journal of Engineering and Technology
Effect of Stocking Density on Growth
Performance, Production Trait, Food
Utilization and Body Composition, of Meagre
(
Argyrosomus regius
)
A. Ghozlan
1, M. M. Gaber
1, M. A. Zaki
2*, A. Nour
21National Institutes of Oceanography and Fisheries, Cairo, Egypt
2Animal Production Department, Alex University, Alexandria, Egypt
Abstract
A 10-week rearing trial was conducted in cages with average initial weight of 9.15 ± 0.2 g/fish and average initial length of 9.2 ± 0.02 cm/fish of meagre,
Argyrosomus regius, to examine the effect of three stocking density on growth performances, production traits, feed utilization and body
composi-tion. Nine cages 24 m3 each (4 × 6 × 1.5 m, long, width and height) were
stocked with either 1200, 3600 and 6000 fish for each cage to give a stocking
rate of 50, 150, and 250 fish/m3 respectively and fish fed daily, slightly in
excess of satiation to eliminate the possibility of food supply being a limiting factor to growth. The results revealed that, mean final weight (g/fish), gain in weight, SGR (%per day), feed conversion ratio, protein efficiency ratio and total feed intake (g/fish) were significantly (P ≤ 0.01) influenced. The best at the lowest stocking density, while, the total production and net production exhibited significantly the opposite trend. Harvest and production estimates increased with increasing stocking density. Fish body composition% of moisture, protein, fat and ash were significantly (P ≤ 0.01) influenced by stocking density. From the above results and the economic information of the
study, it can be concluded that stocking density of 50 fish/m3 of meagre
exhi-bited the highest net profit and would seem to be the most desirable density in the system studied.
Keywords
Stocking Density, Meagre, Growth, Production, Body Composition How to cite this paper: Ghozlan, A.,
Ga-ber, M.M., Zaki, M.A. and Nour, A. (2018) Effect of Stocking Density on Growth Per-formance, Production Trait, Food Utiliza-tion and Body ComposiUtiliza-tion, of Meagre (Argyrosomus regius). World Journal of Engineering and Technology, 6, 37-47. https://doi.org/10.4236/wjet.2018.63B005
DOI: 10.4236/wjet.2018.63B005 38 World Journal of Engineering and Technology
1. Introduction
Meagre (Argyrosomus regius) become the world’s largest sciaenid fish that is
widely distributed along the eastern Atlantic coast, including the Mediterranean sea as reported by [1]. This species is characterized by domestication ability, high tolerance to wide ranges of salinity (5% - 39‰) and temperature (13˚C - 28˚C) and exhibits high growth rates reaching 1.2 kg in less than 2 years. Its quality features include an attractive body shape for selling as whole fish, a good processing yield and nutritional value, low fillet fat, excellent taste and firm tex-ture [1] [2], which distinguish meagre as a highly marketable fish species.
Stocking density is a major factor that affects fish growth under farmed condi-tions [3] [4]. Increasing stocking density results in stress [5] which leads to en-hanced energy requirements causing reduced growth and food utilization. Con-sequently, identifying the optimum stocking density for a species may be critical factor is affecting growth and feed intake in cages. Fish density is a key factor af-fecting growth and maturation of wild and cultured fish besides food supply and its quality, genetics and environmental conditions [6] [7]. Rearing fish at inap-propriate stocking densities may impair growth and reduce immune competence due to factors such as social interactions and deterioration of water quality, which can affect both feed intake and conversion efficiency of the fish [8].
The major objective were to determine the effects of stocking density on growth performance, food utilization, and finally the economic feasibility of Meagre as species suitable for cages culture in Egypt.
2. Materials and Methods
2.1. Fish and Facilities
The experiment was carried out at the outdoor of Mount of Diba at Domiate Governorate, Egypt. The experimental system consisted of nine experimental cages. Each of them was 4 m long, 6 m width and 1.5 m height. Water level in
the cages was kept at 1 m depth to maintain the water volume at 24 m3.
A set of 10,800 meagre fingerlings were obtained from Mount of Diba at Do-miate Governorate, Egypt. The initial average was 9.14 ± 0.02 g/fish and average
initial length of 9.2 ± 0.02 cm/fish respectively. Cages 24 m3 each were stocked
with either 1200 3600 and 6000 fish for each cage to give a stocking rate of 50,
150, and 250 fish/m3 with triplicate cages per treatment.
DOI: 10.4236/wjet.2018.63B005 39 World Journal of Engineering and Technology Table 1. Feed formulation and proximate composition of diets contained (HBP) feed to Meagre (Argyrosomus regius).
Ingredients (%) Diets
AF Fish meal (C.P.65%)
Soybean meal (C.P.44%) Yellow corn meal
Gluten Fish oil Vit. & Min premix1 Calcium diphosphate Proximate analyses (%)2
Crude protein Crude fat
Ash Crude fiber
NFE3 Gross energy Kcal/g4 P:E ratio (mg CP:kcal)
40.0 20.0 20.0 10.0 7.0 1.0 2.0
42.74 17.26 8.6 1.60 29.8 5.1 93.0
1Vitamin and mineral premixed according to [33] Madan, et al. (2009). 2Values represent the mean of three
sample replicates. 3NFE—Nitrogen Free Extract = 100 – (% crude protein + % crude fat + % crude ash + %
crude fiber). 4The calorific values for protein, fat and carbohydrate was obtained by the conversion factors
5.65, 9.45 and 4.1 kcal/g respectively.
the possibility of food losses in each cage for 10 weeks. About 25% of fish in each cage were randomly sampled and measured at 2 weeks intervals for body weight (W) to the nearest 0.1 g. dissolved oxygen (mg/L) and water temperature ˚C in all cages were monitored twice daily (0800 and 1430) by means of YSI model 58 oxygen meter. Other water quality parameters including pH, total ammonia (mg/L) were measured twice weekly in each cage throughout the duration of study (10 weeks), according to [9].
2.2. Harvest Data and Body Composition
Fish were not fed 24 hours prior to harvest, the total number and individually weight of all fish in each cage were recorded at harvest. For body composition analysis, 5 fish from each cage at harvest were randomly sampled and stored at −20˚C for subsequent chemical analysis. Proximate analysis of the formulated diets and fish carcasses were determined according to standard methodology [10].
2.3. Statistical Analysis
DOI: 10.4236/wjet.2018.63B005 40 World Journal of Engineering and Technology needed for Duncan’s multiple rang test [12]. All percentages and ratio were transformed to arcsine values prior to analysis [13].
3. Results
3.1. Water Quality
During the feeding trial, the water quality parameter were not significantly dif-ferent (P ≥ 0.05) among treatments: averaged (±SD): water temperature 27.2˚C
± 0.8˚C dissolved oxygen 6.8 ± 0.4 mg∙l−1; pH 7.4 ± 0.6; ammonia ± 0.04 mg∙l−1;
nitrite 0.1 ± 0.05 mg∙l−1; nitrate 1.5 ± 0.2 mgl−1; alkalinity 181 ± 46 mg∙l−1; salinity
35.2 ± 1.1 g∙L−1.
3.2. Fish Growth and Production
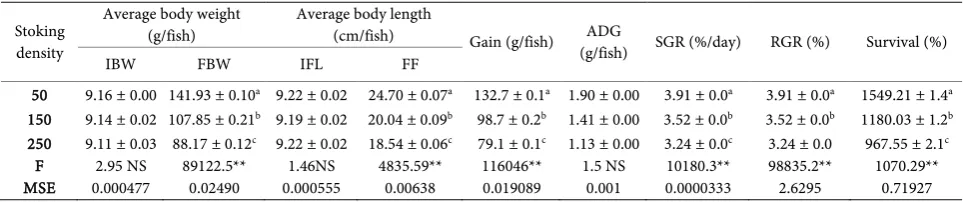
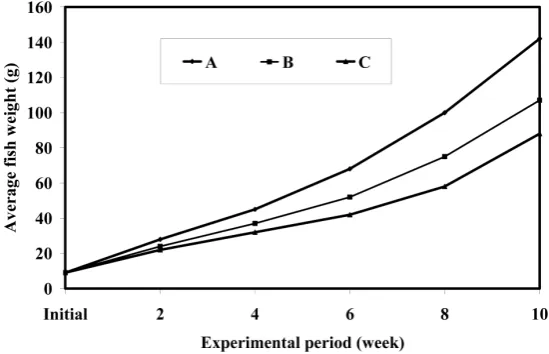
It has found that the growth of Meagre was affected stocking density. Fish reared at low density grow better than those reared at high density (Table 2 & Figure 1), and the differences where highly significantly. Final mean weight were in-versely proportional to stocking density, which was particularly evident when average fish weight reared at the lowest stocking density significantly different from fish weight reared at the highest stocking density. It can be concluded from Table 2, mean final weight (g/fish), mean final length (cm/fish), gain in weight specific growth rate (SGR) relative growth rate and survival rate% were signifi-cantly (P ≤ 0.01) the best at the lowest stocking density, while, total production and net production exhibited significantly the opposite trend Table 3. Harvests and production estimate increased with increasing stocking density. At the end
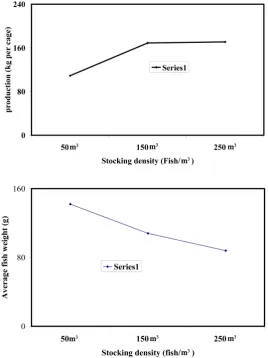
of the experiment, total production was 4.57 Kg/m3 at the lowest stocking
densi-ty and 7.17 Kg/m3 at the highest stocking density. Production was opposite to
the individual weight during the growth period, that the individual weight de-creased with the increasing stocking density (Figure 2 and Table 3), while total production increased with increasing stocking density.
3.3. Feed Utilization Efficiency
[image:4.595.57.539.590.691.2]The results of feed conversion ratio (FCR), protein efficiency ratio PER), feed intake (FI) condition factor (K), protein productive value and energy utilization
Table 2. Effect of different stoking density on growth performance of Meagre (Argyrosomus regius, Asso1801).
Stoking density
Average body weight
(g/fish) Average body length (cm/fish) Gain (g/fish) ADG
(g/fish) SGR (%/day) RGR (%) Survival (%)
IBW FBW IFL FF
50 150 250
9.16 ± 0.00 9.14 ± 0.02 9.11 ± 0.03
141.93 ± 0.10a 107.85 ± 0.21b 88.17 ± 0.12c
9.22 ± 0.02 9.19 ± 0.02 9.22 ± 0.02
24.70 ± 0.07a 20.04 ± 0.09b 18.54 ± 0.06c
132.7 ± 0.1a 98.7 ± 0.2b 79.1 ± 0.1c
1.90 ± 0.00 1.41 ± 0.00 1.13 ± 0.00
3.91 ± 0.0a 3.52 ± 0.0b 3.24 ± 0.0c
3.91 ± 0.0a 3.52 ± 0.0b 3.24 ± 0.0
1549.21 ± 1.4a 1180.03 ± 1.2b 967.55 ± 2.1c F
MSE 0.000477 2.95 NS 89122.5**0.02490 0.000555 1.46NS 4835.59**0.00638 116046**0.019089 1.5 NS 0.001 0.0000333 10180.3** 98835.2**2.6295 1070.29**0.71927
DOI: 10.4236/wjet.2018.63B005 41 World Journal of Engineering and Technology Table 3. Effect of different stoking density on feed utilization of Meagre (Argyrosomus regius, Asso1801).
Stoking
density Condition factor (K) Feed intake (g/fish) FCR PER PPV (%) Energy gain (Kcal) Energy utilization (kcal/100g Total production (kg/cage) 50
150 250
0.94 ± 0.01c 1.34 ± 0.01b 1.38 ± 0.01a
247.00 ± 0.67c 254.89 ± 0.19b 282.55 ± 1.26a
1.86 ± 0.00c 2.58 ± 0.00b 3.57 ± 0.01a
1.26 ± 0.00a 0.90 ± 0.00b 0.65 ± 0.00c
32.44 ± 0.06a 23.68 ± 0.06b 17.32 ± 0.06c
288.37 ± 0.20a 217.46 ± 0.44b 176.53 ± 0.23c
22.17 ± 0.04a 16.20 ± 0.04b 11.86 ± 0.04c
109.0 ± 0.1 169.4 ± 0.3 171.5 ± 0.2 F
MSE
848.89** 0.000211
1512.39** 0.69161
24968.4** 0.000088
12405.5** 0.000022
40455.6 ** 0.0042778
97378.8** 0.09866
39534.2 0.002033
Values are mean ± Standard deviation. * = (P ≤ 0.05) ** = (P ≤ 0.01). Values in the same column with same superscripts are not significantly different. Feed conversion ratio (FCR) = Feed intake/Weight gain; Protein efficiency ratio (PER) = Weight gain/Protein intake; Protein productive value (PPV) = Protein gain/Protein intake; Energy utilization = 100 × energy content of carcass at end—energy content of carcass at start/energy intake. Values in the same column with same superscripts are not significantly different. Feed conversion ratio (FCR) = Feed intake/Weight gain; Protein.
Figure 1. Effect of different stocking density on growth rate of Meagre (Argyrosomus re-gius, Asso1801).
are presented in Table 4. Feed utilization parameters were significantly (P ≤ 0.01) affected by stocking density.
3.4. Body Composition
Moisture, protein, fat and ash contents of fish body of Meagre reared at three stocking density are presented in Table 4. Moisture content was high (62.3%) at low stocking density and low (64.1%) at the highest stocking density. Also, pro-tein content and ash content showed the same trend as above.
3.5. Economics
The economic information for Meagre reared in cages for 10 weeks at three stocking density are presented in Table 5. From this table the net profits were directly related to stocking density. Also, the food cost and total cost increased by increasing stocking density. From the economic information, it can be
con-cluded that the highest net profit was achieved at stocking density of 150 fish/m3
DOI: 10.4236/wjet.2018.63B005 42 World Journal of Engineering and Technology Figure 2. The relation between total production and stocking density (upper graph). The relation between final average weight per fish and stocking density (lower graph).
Table 4. Effect of stocking density on body composition (dry weight basis) of Meagre
(Argyrosomus regius, Asso1801).
Stocking
density Carcass energy (kcal/100g) Moisture (%) Protein (%) Ether extract (%) Ash (%) 50
150 250
553.99 ± 2.52 555.07 ± 4.13 560.18 ± 4.17
62.26 ± 0.9a 60.32 ± 1.1b 59.16 ± 1.0b
65.89 ± 0.23a 64.54 ± 3.8b 64.14 ± 0.48b
19.23 ± 0.15a 20.15 ± 0.21b 20.93 ± 0.19b
14.34 ± 0.14a 14.32 ± 0.23a 13.54 ± 0.17b F
MSE
2.4NS 13.6
7.38** 0.999
20.25** 0.125
63.46** 0.034
20.23** 0.309
Values are mean ± Standard deviation. * = (P ≤ 0.05) ** = (P ≤ 0.01). Values in the same column with same superscripts are not significantly different. The value of initial body composition was as follows: moisture 83.97 ± 0.4, protein 66.68 ± 0.47, ether extract 10.8 ± 0.28, ash 15.06 ± 0.32.
4. Discussion
[image:6.595.207.539.511.613.2]DOI: 10.4236/wjet.2018.63B005 43 World Journal of Engineering and Technology Table 5. Economic information for Meagre (Argyrosomus regius) at three stocking den-sity.
Stocking density Item
250 150
50
6000 1944 171.5 549.4 2000 2197.6 4197.6 8575 4377.7 3600
1570 169.2 400.2 1200 1600.8 2800.8 8460 5659.2 1200
768 109.0 189.7 400 758.8 1158.8
5450 4291.2 No. fish stocked cage−1
No. fish harvested cage−1 Harvested (kg/cage) Food used Kg cage−1 Fingerling cost(LE) Food cost (LE) Total cost (LE) Value of harvest (50LEkg−1)
Net profit (LE)
Value are mean ± SD LE = lever Egyptian one $ US Dollar equal 17.65 LE. Food cost equal 4 LE/kg of diet.
density dependent and the density independent. The stocking density that sig-nificantly negatively affects the growth of fish was considered as density depen-dent category, such as the cases found for blue gill, Lepomis mar crochius
Rafi-nesque [15], Chinook salmon, Oncorhynchus tshawytscha [16], Nile tilapia,
Oreochromis niloticus [2]. In the present study the similar case of negative cur-vilinear relationship was found
[17] found that higher stocking density was accompanied by lower pH and dissolved oxygen and suggested that the resulting changes in water quality might play an important role in affecting growth and survival of fish. [18] indicated that metabolic wastes are directly proportional to stocking density have been implicated in inhibiting the growth of fish and to be toxic to fish. Moreover, fish need oxygen for aerobic generation of energy for body maintenance, locomo-tion, feeding and biosynthesis. A minimum dissolved oxygen level of 3.0 ppm was recommended during cage culture of tilapia in freshwater [19]. In the present study, a minimum dissolved oxygen level was maintained above 4.3 mg/L and no significant differences among the cages and no effected on growth was observed. The water flow system in the present study provided fairly good water quality consistently throughout the experimental period at all cages. There were no evidences of large physiochemical fluctuation, occurrence of diseases and handling stress, and deterioration of water quality in experimental cages during course of the experiment.
suf-DOI: 10.4236/wjet.2018.63B005 44 World Journal of Engineering and Technology ficient to prove the technical viability of rearing pompano in marine floating cages. In our experiment, the highest biomass was achieved at stocking density
150 fish/m3.
Increased stocking densities caused reductions in survival rate of meagre (Ta-ble 5). Percent survival was significantly higher (P < 0.001) in fish reared at the lowest density level than in fish reared at either of the two higher densities. The difference in survival between groups of fish reared at the two highest densities was significant. Raceway loading (biomass per unit of water flow) also had
ap-parent effect on survival of fish. Survival was greater in the 50 fish/m3 than in the
150 fish/m3 (P < 0.001).
Studies on higher stocking densities had been conducted in cage culture of other fish species, such as sea bass [22], salmonids [23], Japanese flounder [24] and red sea bream [25]. Fish reared at higher stocking densities had lowest final mean weight. [26] reported that slow growth of fish at higher stocking densities was probably due to the individual disturbing each other during feeding and normal activity.
In this study, the FCR (1.86) is quite similar to that reported by [27] with an FCR value of 1.84, but better than those reported by [28] from 2.51 to 2.59, [29] with FCR value of 3.0 and [30] with 2.13 and 2.23 with pompano. The decreas-ing values of feed conversion ratio obtained in this study with lower stockdecreas-ing density indicate that progressively larger portion of food was used for growth and fish assimilated the feed consumed more efficiently at lower stocking densi-ty.
There was a strong trend for both production and final harvest to increase with increasing stocking density. These results are in agreement with those of
[31] from studies on Silver Pompano, Trachinotus blochii, (Lacépède, 1801) in
marine floating cages. Also, [32] reported that reproduction of fish culture is generally depended on the stocking density.
Finally, it can be concluded that, the best desirable stocking density was 150
fish/m3 which gave the highest production and economically had the highest net
profit.
Conflicts of Interest
The authors declare no conflicts of interest regarding the publication of this pa-per.
References
[1] Duncan, N.J., Estévez, A. and Fernández-Palacios, H. (2013) Aquaculture Produc-tion of Meagre (Argyrosomus regius): Hatchery Techniques, on Growing and Mar-ket. In: Allan, G. and Burnell, G., Eds., Advances in Aquaculture Hatchery
Tech-nology, Wood Head Publishing Limited, 519-541.
https://doi.org/10.1533/9780857097460.3.519
DOI: 10.4236/wjet.2018.63B005 45 World Journal of Engineering and Technology
International Journal of Food Science Technology, 46, 711-716.
https://doi.org/10.1111/j.1365-2621.2010.02537.x
[3] Maragoudaki, D., Paspais, M. and Kentouri, M. (1999) Influence of Stocking Den-sity of Juvenile Red Porgy (Pagrus pagrus) under Different Feeding Conditions.
Aquaculture Research, 30, 501-508.
https://doi.org/10.1046/j.1365-2109.1999.00363.x
[4] El-Saidy, D.M.S. and Gaber, M.M. (2002) Intensive Culture of Nile tilapia,
Oreoch-romis niloticus (L), in Concrete Tanks in Egypt: Effect of Stocking and Feeding
Le-vels on Growth Performance, Production Traits, Feed Conversion and Body Com-position. First Scientific Conference of the Egyptian Aquaculture Society, Organized by Faculty of Environmental Agriculture Sciences, Suez Canal University, El-Arish-North Sinai, Egypt.
[5] Leatherland, J.F. and Cho, C.Y. (1985) Effect of Rearing Density on Thyroid and Internal Gland Activity and Plasma Hepatic Metabolite Levels in Rainbow Trout,
Salmo gairdneri, Richardson, Journal Fish. Biology, 27, 583-592.
https://doi.org/10.1111/j.1095-8649.1985.tb03203.x
[6] Khattab, Y.A.E., Abdel-Tawwab, M. and Ahmad, M.H. (2004) Effect of Protein Lev-el and Stocking Density on Growth Performance, Survival Rate, Feed Utilization and Body Composition of Nile tilapia Fry (Oreochromis niloticus L.). In: Bolivar, R.B., Mair, G.C. and Fitzsimmons, K., Eds., New Dimension in Farmed Tilapia.
Proceedings of the Sixth International Symposium on Tilapia in Aquaculture,
Ma-nila, Philippines, 1, 264-276.
[7] Malik, A., Kalhoro, H., Shah, S.A. and Kalhoro, I.B. (2014) The Effect of Different Stocking Densities on Growth, Production and Survival Rate of Pangas (Pangasius
hypophthalmus) Fish in Cemented Tanks at Fish Hatchery Chilya Thatta,
Sindh-Pakistan. International Journal of Interdisciplinary and Multidisciplinary
Studies (IJIMS), 1, 129-136.
[8] Ellis, T., North, B., Scott, A.P., Bromage, N.R., Porter, M. and Gadd, D. (2002) The Relationships between Stocking Density and Welfare in Farmed Rainbow Trout.
Journal of Fish Biology, 61, 493-531.
https://doi.org/10.1111/j.1095-8649.2002.tb00893.x
[9] Golterman, H.L., Clymo, R.S. and Ohnstad, M.A.M. (1978) Methods of Physical and Chemical Analysis of Fresh Waters. Blackwell Scientific Publications, Oxford, 214 p. [10] AOAC (Association of Official Analytical Chemists) (2006) Official Methods of
Analysis. Horwitz, W., Ed. 18th Edition, Washington DC.
[11] Statistical Analysis System (1993) SAS/STAT User’s Guide Release 6.03 Edition. SAS Institute Inc., Cary, North Carolina.
[12] Duncan, D.B. (1955) Multiple Range and Multiple F Tests. Biometrics, 11, 1-42.
https://doi.org/10.2307/3001478
[13] Zar, J.H. (1984) Biostatistician Analysis. Prentice Hall, Englewood Cliffs, New Jer-sey.
[14] Huang, W.B. and Chiu, T.S. (1997) Effects of Stocking Density on Survival, Growth, Size Variation, and Production of Tilapia Fry. Aquaculture Research, 28,165-173.
https://doi.org/10.1111/j.1365-2109.1997.tb01029.x
[15] Wiener, J.G. and Hanneman, W.R. (1982) Growth and Condition of Bluegills in Wisconsin Lakes: Effects of Population Density and Lake pH. Transactions of the
American Fisheries Society, 111, 761-767.
DOI: 10.4236/wjet.2018.63B005 46 World Journal of Engineering and Technology [16] Martin, R.M. and Wertheimer, A. (1989) Adult Production of Chinook Salmon
Reared at Different Densities and Released as Two Smolt Sizes. Progressive
Fish-Culturist,51, 194-200.
https://doi.org/10.1577/1548-8640(1989)051<0194:APOCSR>2.3.CO;2
[17] Miao, S. (1992) Growth and Survival Model of Redtail Shrimp Penaeus pencillatus
(Alock) According to Manipulating Stocking Density. Bulletin of the Institute of
Zoology Academia, 31, 1-8.
[18] Chen, Y.S., Beveridge, M.C.M. and Telfer, T.C. (1999) Settling Rate Characteristics and Nutrient Content of the Faeces of Atlantic salmon, Salmo salar L. and the Im-plications for Modeling of Solid Waste Dispersion. Aquaculture Research, 30, 395-398.https://doi.org/10.1046/j.1365-2109.1999.00334.x
[19] Coche, A.G. (1982) Cage Culture of Tilapias. In: Pullin, R.S.V. and Lowe-McConnell, R.H., Eds., The Biology and Culture of Tilapias, ICLARM Confe-rence Proceedings 7. International Center for Living Aquatic Resources Manage-ment, Manila, Philippines, 205-246.
[20] Gil, M.M., Palmer, M., Hernández, M.D., Grau, A., Durán, J., García García, B., Jover, M. and Pastor, E. (2015) Rearing Diet May Determine Fish Restocking Suc-cess: A Case Study of Hatchery-Reared Juvenile Meagre. Argyrosomus regius. Sci. Mar., 79, 431-441.https://doi.org/10.3989/scimar.04140.05A
[21] Chavez, H.M., Fang, A.L. and Carandang, A.A. (2011) Effect of Stocking Density on Growth Performance, Survival and Production of Silver Pompano, Trachinotus
blochii, (Lacépède, 1801) in Marine Cages. Asian Fisheries. Science, 24, 321-330.
[22] Kissil, G.W., Tandler, A., Colorni, A. and Elizur, A. (2000) Sea Bass Culture. In: Stickney, R.R., Ed., Encyclopedia of Aquaculture, John Wiley and Sons Inc., New York, 778-784.
[23] Roberts, R.J. and Hardy, R.W. (2000) Salmon Culture. In: Stickney, R.R., Ed.,
En-cyclopedia of Aquaculture, John Wiley and Sons Inc., New York, 773-778.
[24] Min, B.S. (1995) A Review of the Nursery and Grow-Out Culture Techniques for Flounder (Paralichtys olivaceus) in Korea. In: Main, K.L. and Rosenfeld, C., Eds.,
Culture of High-Value Marine Finfish in Asia and the United States, The Oceanic
Institute, Honolulu, Hawaii, 147-152.
[25] Ikenoue, H. and Kofuku, T. (1992) Mode Methods of Aquaculture in Japan. Elsevi-er, Amsterdam, 274 p.
[26] Hepher, B., Milstein, A., Leventer, H. and Teltsch, B. (1989) The Effect of Fish Den-sity and Species Combination on Growth and Utilization of Natural Food in Ponds.
Aquaculture and Fisheries Management, 20, 59-71.
https://doi.org/10.1111/j.1365-2109.1989.tb00441.x
[27] Manomaitis, L. and Cremer, C.M. (2007) Performance of Pompano Fed Soy-Optimized, Extruded Feed Using ASA-IM Low Volume High Density Cages in Vung Tau Province, Vietnam. Results of ASA-IM/Soy-in-Aquaculture 2007, Feed-ing Demonstration Project. American Soybean International MarketFeed-ing (ASA-IM). [28] Lan, H.P., Cremer, M.C., Chappell, J., Hawke, J. and O’Keefe, T. (2007) Growth
performance of Pompano (Trachinotus blochii) Fed Fishmeal and Soy Based Diets in Offshore OCAT Ocean Cages. Results of the 2007 OCAT Cage Feeding Trial in Hainan, China.
[29] McMaster, M.F., Kloth, T.C., Coburn, J.F. and Stolpe, N.E. (2006) Florida Pompano
Trachinotus carolinus Is an Alternative Species for Low Salinity Shrimp Pond
DOI: 10.4236/wjet.2018.63B005 47 World Journal of Engineering and Technology [30] Cremer, M.C. and Jian, Z. (1999) Pompano (Trachinotus ovatus) Growth Perfor-mance in 1.5 m3 Cages with Soybean Meal and Fish Meal Based Feed Rations. Re-sults of ASA/China, 1999. Feeding Trial, 35, 99-73.
[31] Chavez, H.M., Fang, A.L. and Carandang, A.A. (2011) Effect of Stocking Density on Growth Performance, Survival and Production of Silver Pompano, Trachinotus
blochii, (Lacépède, 1801) in Marine Cages. Asian Fish. Sci., 24, 321-330.
[32] Kayano, Y., Yao, S., Yamamoto, S. and Nakagawa, H. (1993) Effect of Feeding Fre-quency on the Growth and Body Constituents of Young Red-Spotted Group
Epl-nephelus akaara. Aquaculture, 110, 271-278.
https://doi.org/10.1016/0044-8486(93)90375-9
[33] Madan, M., Bhanja, S.K. and Yasmeen, B. (2009) Performance of Chitin Incorpo-rated Diet on the Indigenous Kumaon Himalayan Fishes: Snow Trout, Schizothorax
richardsonii (Gray) and Golden Mahseer, Tor putitora (Hamilton). Indian J. Fish.,