R E S E A R C H
Open Access
Reablement in community-dwelling older
adults: a cost-effectiveness analysis
alongside a randomized controlled trial
Egil Kjerstad
1*and Hanne Kristin Tuntland
2Abstract
Background:In the face of a growing number of older adults in the population, policy-makers in high-income
countries are seeking new ways to reduce the expected growth in long-term care expenditure. Research shows that disability is an important determinant of long-term care utilization. In this context, reablement has received increased attention. Reablement is a form of home-based rehabilitation, which focuses on improving independent functioning in daily activities perceived as important by the older adult.
Objective:To evaluate the cost-effectiveness of reablement.
Methods:The economic evaluation is based on data from a randomized controlled trial in which all participants were assessed at baseline and after 3 and 9 months. The intervention group participated in reablement, while the control group received usual care. The Canadian Occupational Performance Measure (COPM) was used to measure self-perceived activity performance and satisfaction with performance. Cost data were based on daily registrations of usage of home-based care personnel during a period of 9 months.
Results:Reablement was found to be more cost-effective than usual care. The assessments of performance and
satisfaction regarding daily activities were significantly higher in the reablement group compared with the control group and this was achieved at lower cost. Importantly too, in the post-trial period, the intervention group requested significantly fewer home visits which were, on average, of significantly shorter duration compared with the control group. Expenditure on home visits was significantly lower for the reablement group.
Conclusions:Reablement is a more cost-effective intervention compared with usual care. Reablement has a
potentially large effect on the demand for compensating home-based care services. Policy-makers should therefore consider implementing reablement on a larger scale.
Keywords:Rehabilitation, Randomized controlled trial, Economic evaluation, Home care services
Background
Disability in older adults involves functional decline and, as such, is an important determinant of long-term care utilization [1]. Thus, interventions that significantly in-fluence people’s disability status can potentially reduce the use of, and expenditure on, home-based care. Rea-blement, also termed restorative care, is a form of home-based rehabilitation, which focuses on improving independent functioning in daily activities perceived as important by the participant. This is contrary to simply
doing tasks for people indefinitely, which has been the traditional way home-based care services have been of-fered. Other characteristics of reablement are that the intervention is time-limited, person-centered and deliv-ered by integrated teams consisting of various profes-sionals such as occupational therapists, physiotherapists, nurses, auxiliary nurses and assistants. Furthermore, the intervention is implemented in the home setting or in the local community.
Recently, the first randomized controlled trial (RCT) on reablement conducted in Europe demon-strated that a 10-week reablement program signifi-cantly improved self-perceived activity performance
* Correspondence:[email protected]
1Uni Research Rokkan Centre, P.O. Box 7810, Bergen 5020, Norway
Full list of author information is available at the end of the article
(COPM-P) and satisfaction with performance (COPM-S) in community-dwelling older adults in a Norwegian muni-cipality [2]. However, this RCT was not evaluated from an economic point of view.
To date, two economic evaluations of reablement have been published in peer-reviewed journals. The first study was a large retrospective cohort study lasting nearly 5 years including older adults who had received reable-ment versus conventional home-based care [3]. The re-sults showed that the likelihood of using any type of home-based care service was reduced for 3 years, and the need for personal care service was reduced for nearly 5 years. The reduced use of home-based care services was associated with median cost savings per person of approximately $12,500 Australian dollars (AUD). The second study, also from Australia, was a large RCT with a 2-year follow up [4]. Participants undertaking reable-ment were found to use fewer home-based care hours and were less likely to be approved for a higher level of care such as nursing home placement. Further, they were less likely to be admitted to emergency departments or to have an unplanned hospital admission. Finally, reable-ment resulted in lower total home-based care costs than conventional care: $4,096 versus $5,270 AUD for the first year, and $5,833 versus $8,374 AUD for the total 2-year period.
Based on detailed data on home visits combined with data on outcome measures, the objective of this study was to provide an economic evaluation of reablement to complement the above-mentioned effect studies. The economic evaluation had two parts: an analysis of the cost-effectiveness of the intervention based on estimates of the incremental cost-effectiveness ratio (ICER) and es-timates of post-trial differences in home-based care expenditure.
In this first cost-effectiveness study on reablement conducted outside Australia, we found a negative incre-mental cost-effectiveness ratio (ICER), indicating that reablement leads to better outcomes (COPM-P and COPM-S) at a lower cost compared with compensating home-based care services. Importantly too, we also found significant differences in both the number of home visits and the duration of compensating home-based care services in the post-trial period. In summary, reablement led to lower expenditure on compensating home-based care services in the post-trial period. We concluded that reablement could be a promising way forward in the care of community-dwelling older adults.
Demographic changes and distribution of services In Norway, there is a view that reablement needs to be central to efforts aimed at meeting the major challenge of financing long-term care. The most recent figures from the Central Bureau of Statistics in Norway (SSB)
show that expenses related to care services exceeded 100 billion Norwegian kroner (NOK) in 2014 [5]. The share of home-based care services increased to an all-time high, making up almost half of the total expenses, while the share of expenses related to long-term and short-term care at institutions decreased to 45 %. Five per cent of the total expenses covered social activity and add-itional services.
Similarly, in Norway, the total number of users of home-based care services, that is, nursing services in the home, home help, rehabilitation and other services for users living at home, independent of age and diagnosis, has remained almost unchanged at 190,000 users. The number of older users (67 years and over) has decreased by 1,000 to a total of 107,500, and the number of young users has increased by approximately the same number, to a total of 84,500 users. There has been a marked de-crease in the number of users of home-based care ser-vices for people aged 80 years and over.
However, as reported by SSB [5], the share of users with extensive need for assistance has increased in all age groups. Since 2007, when registration of needs started, there has been a continuous increase, regardless of age. So, while the total number of users is stable, the increase in users with extensive needs necessitates more resources to be allocated to the sector. One indicator of this development is that the average number of hours of home help or compensating care has increased by 10 % since 2013. In 2014, each user, on average, received 9 h of home help per week. The corresponding hours of home-based nursing is unchanged and is approximately half the level of home help services, that is 4.6 h, on average, per user per week [5].
If reablement can postpone individuals’need for com-pensating care or reduce the level of need for compen-sating care, a continuous increase in the growth of users with extensive needs, is not inevitable. Rather, it may be (partly at least) endogenously determined, that is, dependent on the allocation of resources to reablement and other cost-effective preventive interventions by local authorities. This cost-effectiveness study of reablement is a contribution to increasing the knowledge base re-lated to measures that potentially can make a difference, not only in terms of expenditure levels in the long-term care sector, but also in relation to improved quality of life for individuals.
Implementation of reablement—a short overview
that the evolution of international and Scandinavian rea-blement has followed two parallel, but separate, paths. The implementation of reablement in Scandinavia started in the municipality of Östersund in 1999 and spread from there to other municipalities in Sweden. The development in Sweden inspired Denmark to get started in 2007, in particular in the municipality of Fredericia [9, 10]. Nowadays, almost all Danish munici-palities have started offering reablement services [11]. Since the first municipalities started implementing rea-blement in 2012, there has also been a rapid develop-ment in Norway [12]. To date, 34 % of all Norwegian municipalities are offering reablement services and the growth continues.
In the Norwegian municipality we studied, the re-searchers initiated the implementation of reablement. The municipality agreed to participate in the study be-cause of a need for more services that encourage more activity in older adults. In addition, there was a need for sustainable services in long-term care (LCT). Finally, the municipality agreed to participate due to the support of-fered during the implementation of the intervention.
Methods
Design and data collection
A parallel-group randomized controlled superiority trial was conducted, in which all participants were assessed at baseline, and after 3 and 9 months. The study was conducted in a primary care setting in a rural municipal-ity in Western Norway with approximately 14,000 inhab-itants. The recruitment period lasted from May 2012 until February 2014. Data collection was terminated in December 2014. Older adults living in the municipality were randomized to receive either reablement or usual care. The intervention period lasted on average 10 weeks. The study met the terms of the CONSORT statement for transparent reporting and was registered on November 20, 2012 in ClinicalTrials.gov, identifier NCT02043262. Ethics approval for the study was granted by the Regional Committees for Medical and Health Research Ethics in Norway (REK West, 2012/295). All participants received information about the study and gave written consent. Procedures were conducted in accordance with the Declaration of Helsinki.
The methods used in the effect study have been de-scribed in detail in the study protocol and in the pub-lished results of the health effects [2, 13]. People applying for, or referred for, home-based care services were potential participants for the study based on their self-reported activity limitations. Some of the partici-pants had been hospitalized due to an acute illness, while others were recruited after having gradually devel-oped functional decline not needing hospitalization or institution-based treatment. Home-dwelling people over
the age of 18 years, who lived in the municipality, were able to understand Norwegian, and had some functional decline in one or more daily activities were included. We excluded people if they were in need of institution-based rehabilitation or a nursing home placement, were terminally ill, or were moderately or severely cognitively reduced.
A biostatistician not involved in the assignment of par-ticipants to groups, performed the randomization with an allocation ratio of 1:1, using a computer-generated permuted block randomization sequence, with randomly selected block sizes of lengths 2 and 4. The allocation se-quence was concealed in sequentially numbered, opaque, sealed envelopes. The allocation list was stored in a safe deposit box in a central office in the municipality. Nei-ther research assistants nor health-care providers enrol-ling participants had influence on group allocation. The research assistants performed the baseline assessments in the participant’s home before randomization. The par-ticipants were asked not to reveal their group allocation to the research assistants during follow-up assessments. The success of the research assistants’blinding was reg-istered. Researchers handling data entry and data ana-lysis were blinded to group allocation.
The reablement intervention consisted of both general and individual features. Among the general features was a maximum rehabilitation period of 3 months. Further, as part of the baseline assessment, the occupational therapist and physiotherapist used the instrument Canadian Occupational Performance Measure (COPM) to identify activity limitations perceived as important by the pant [14]. During a semi-structured interview, the partici-pant was encouraged to identify problems with his/her self-care, productivity and leisure activities. The partici-pant rated the importance of each identified activity, and prioritized and rated the five most important activities in performance (COPM-P) and satisfaction with perform-ance (COPM-S) again on 1 to 10-point scales. Further, we collected socio-demographic characteristics at baseline.
The control intervention was usual care. The provision of usual care was not limited to 3 months and could continue beyond the reablement intervention period for both groups of participants. For most of the participants, usual care meant receiving the type of ser-vices offered to homebound people in the majority of municipalities in Norway. Usual care often comprises compensating help and its content is delivered accord-ing to the needs described in applications made by the participants. This may be personal or practical assist-ance, meals on wheels, safety alarm, or assistive tech-nology. However, it may also involve rehabilitation efforts by health professionals such as occupational therapists and physiotherapists.
Another important input in the economic evaluation was cost data. The cost data used in this study were based on registrations of the number of home visits to each individual participant; the duration of the visits; the type of professional delivering the care and wage costs differentiated according to profession. Such regis-trations were made over a period of 9 months. A folder containing specially designed forms was kept in each participant’s home. Every time the healthcare pro-vider(s) came to visit the participant, they had to regis-ter their name, date, healthcare profession, tasks performed and minutes spent working (in 5-min se-quences) in the folder. Travel time and time the health-care providers spent working in their offices, were not included. Based on data on hourly wages including pay-roll taxes (for the different categories of healthcare pro-fessionals), we calculated individual home-based care expenditure and expenditure per group.
The sample used in the effect study consisted of 61 participants randomized to either reablement (n =31) or to usual care (n =30). Here the drop-out rate was 11 % and 16 % at the 3-month and 9-month follow ups respectively, the majority being caused by mortalities among participants. However, there were only regis-tration data for 29 and 23 participants in the inter-vention group and control group respectively, giving a registration drop-out rate of 15 %. Reasons for miss-ing registrations were registrations forgotten (n =3), registrations lost (n =2), participant withdrawal before the intervention commenced (n =2), and no home-based services delivered (n =2). The final sample was further reduced due to the requirement that we needed to calculate each participant’s incremental cost-effectiveness ratio. Hence, the sample used in the cost-effectiveness analysis comprised only the partici-pants who were included in both the two prior samples, which included 25 participants in the inter-vention group and 21 participants in the control group, giving a 25 % drop-out rate from the original sample of 61 participants.
Statistical method
All methods of economic evaluation involve some kind of comparison between alternative interventions, treat-ments or programs. A cost-benefit approach should, in principle, address allocative efficiency, that is, contrib-ute to the decision-making process of how many re-sources should be allocated to, for instance, health, education or long-term care. A cost-effectiveness ana-lysis, on the other hand, addresses the question of pro-ductive efficiency in the process of providing a specific service at the lowest possible cost. In the context of home-based care services, this approach seemed to be the relevant approach focusing on the incremental cost-effectiveness ratio (ICER). This approach, though, is not without its limitations. The limitations are re-lated to interpretation of point estimates and, in par-ticular, to uncertainty. In a stochastic analysis, as is the case with the current study, we had to address un-certainty due to sampling variation, an issue of par-ticular importance as the sample was small. Based on a well-established analytical framework [15], we pro-ceeded as follow: Mean costs and effects in both groups were estimated and reported along with stand-ard deviations. Furthermore, mean differences and standard deviation in costs and effects were reported. These latter estimates were combined to obtain esti-mates of the incremental cost-effectiveness ratios (ICERs). Based on the standard errors, the point esti-mates of the ICERs were estimated. As discussed below, confidence intervals around the point estimates of the ICERs were of limited use. Therefore, we needed a different approach to determine the uncer-tainty around the point estimates.
Results
Baseline characteristics
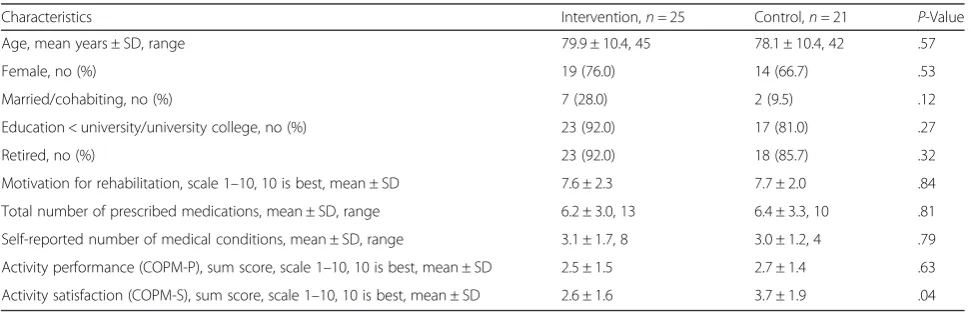
Table 1 presents the baseline demographic characteris-tics by study groups. Overall, the groups were similar at baseline with one exception: the control group scored significantly higher on COPM-S at baseline compared with that of the intervention group (3.7 vs 2.6 points re-spectively). As in the effect study, the sample consisted of predominantly older females (72 %), who lived alone (79 %) and had no higher education (82 %). The number of mortalities and the number of prescriptions indicated a frail sample.
Mean effect and cost estimates
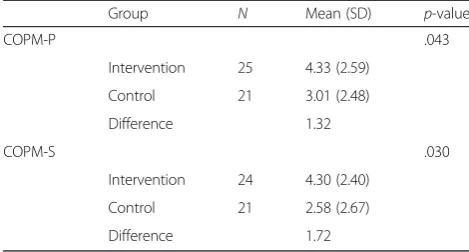
We found significant changes in both mean COPM-P and COPM-S points after 3 months, as reported in Table 2. Based on a two sample t-test, the difference in mean change in COPM-P was 1.32 points, somewhat lower than the effect reported in the effect study but still significant and in the same range. However, while the effect study did not report significant changes in COPM-S after 3 months, we found a significant change of 1.72 points.
Turning to the cost measure, we found a significant difference in both the number of visits and the duration of visits during the intervention period. While the intervention group was visited fewer times (Table 3, column 1) than the control group on average, the mean duration of visits was approximately one minute longer (not reported in the table). The higher expenditure per visit for the intervention group (column 2) reflects higher competence and subsequently higher wages for staff involved in reablement compared with staff in-volved in usual care. The significant difference in costs per visit was rather modest though (NOK 9.61), so, in total, the aggregate cost during the intervention period was approximately 12,000 NOK lower for the interven-tion group. The lower number of visits received by the intervention group, a somewhat unexpected result, ex-plains the cost difference. The difference in mean cost
per participant between the two groups was not signifi-cant based on per participant estimations (column 5). Nevertheless, we used these mean estimates in the ICER calculation rather than the calculated average cost per participant (column 4). Doing this, we used a more‘ con-servative’ cost difference compared with the difference reported in column 4.
As summarized in Table 4, the difference in mean costs per participant was approximately 1,134 NOK, that is, the mean costs per participant were lower for the intervention group compared with the control group at 3 months follow up. In Table 4,ΔC denotes the change in costs between baseline and the 3-month follow-up registrations, while ΔEP and ΔES denote the changes in
COPM-P and COPM-S, respectively. The differences or changes in mean effects are 1.32 and 1.72 points for COPM-P and COPM-S, in favour of the intervention group.
Based on the results in Table 4, we calculated the in-cremental cost-effectiveness ratios (ICER) defined by the general expression ICER =ΔC/ΔE. In conclusion, the ex-penditure needed to increase COPM-P by one point was 868.18 NOK (ICERCOPM-P=− 868.18) lower on average
for the intervention group compared with the control group. Concerning COPM-S, the expenditure needed to increase COPM-S by one point was 666.30 NOK lower on average for the intervention group compared with the control group (ICERCOPM-S=− 666.30). In both
cases, we found a combination of differences in costs and differences in effects located in the south-east quad-rant of the cost-effectiveness plane, that is, reablement was in each case more cost-efficient compared with usual care.
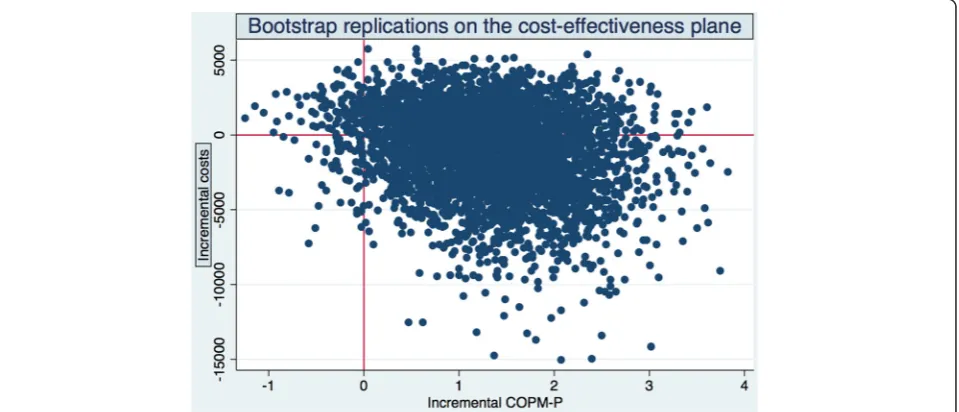
However, it is not sufficient to report the point esti-mates of cost-effectiveness ratios. Our main concern was uncertainty due to sampling variation. Thus, we needed to approach the issue of uncertainty surrounding these estimates using a bootstrap procedure. Figure 1 shows the bootstrap replications on the cost-effectiveness plane
Table 1Baseline characteristics
Characteristics Intervention,n =25 Control,n =21 P-Value
Age, mean years ± SD, range 79.9 ± 10.4, 45 78.1 ± 10.4, 42 .57
Female, no (%) 19 (76.0) 14 (66.7) .53
Married/cohabiting, no (%) 7 (28.0) 2 (9.5) .12
Education < university/university college, no (%) 23 (92.0) 17 (81.0) .27
Retired, no (%) 23 (92.0) 18 (85.7) .32
Motivation for rehabilitation, scale 1–10, 10 is best, mean ± SD 7.6 ± 2.3 7.7 ± 2.0 .84
Total number of prescribed medications, mean ± SD, range 6.2 ± 3.0, 13 6.4 ± 3.3, 10 .81
Self-reported number of medical conditions, mean ± SD, range 3.1 ± 1.7, 8 3.0 ± 1.2, 4 .79
Activity performance (COPM-P), sum score, scale 1–10, 10 is best, mean ± SD 2.5 ± 1.5 2.7 ± 1.4 .63
using difference in COPM-P as effect variable, while Fig. 2 shows the replications using COPM-S as effect variable.
It can be seen in the north-west (NW) quadrant of the cost-effectiveness plane (higher costs, lower effect) that reablement is less favourable than usual care, while in the south-east (SE) quadrant (lower costs, higher effect), reablement is favourable. In both cases, the ICERs are negative. Likewise, cost-effectiveness ratios in the north-east quadrant (NE) and south-west (SW) quadrant were positive but for different reasons. In short, confidence intervals for the ICERs were not informative.
The bootstrap procedure gave us an approximation of the cost-effect joint densities (Figs. 1 and 2). On the basis of these joint densities, we calculated the probabil-ity that reablement is actually cost-effective. The so-called Cost-Effectiveness Acceptability Curve (CEAC) [20] is constructed by imagining a decision-maker chan-ging the ceiling ratio, for example, willingness to pay, from (i) no willingness to pay for COPM-P or COPM-S gains to (ii) a willingness to pay for positive infinity for such gains. In the first case, the line representing the willingness to pay is horizontal and lies on the x-axis. Reablement is cost-effective only if its costs are less than usual care. In the second case, the line representing the willingness to pay is vertical and lies on the y-axis. In that case, costs are of no concern and reablement is chosen if it is more effective compared with usual care.
We did not plot the CEACs here but calculations on the basis of the joint density of ICER COPM-P showed that approximately 62 % (2470/4000) of the bootstrap replications fell in the SE quadrant. In other words, we found indications that there was 62 % probability that reablement was cost-effective if the decision-maker’s willingness to pay (WTP) for COPM-P gain was zero. If the WTP was approximately equal to our point estimate (870 NOK per COPM-P point), there was a 76 % prob-ability that reablement was cost-effective. If WTP was, for instance, 2000 NOK per COPM-P point, there was an 88 % probability that reablement was cost-effective.
In the case of COPM-S, we found indications that there was 60 % probability that reablement was cost-effective if the decision-maker’s willingness to pay for COPM-S gain was zero; a 73 % probability if the WTP was 667 NOK per COPM-S gain and a 91 % probability if WTP equalled 2000 NOK.
Differences in expenditure and effects between 3 and 9 months follow up
Because reablement addresses independent performance in daily activities perceived as important by the partici-pants, our hypothesis was that reablement would reduce long-term care expenditure by diminishing the need for compensating home-based care services after the trial period. Indeed, our analysis showed a significant differ-ence in the use of such services in the 6-month period following the trial (Table 5).
The intervention group received on average 88 home visits compared with the control group receiving 158 visits on average, a difference of 78 visits on average. We also found a significant difference in average duration per visit of 1.30 min (not reported in the table). The ag-gregate difference in expenditure in the 6-month period was approximately 130,000 NOK (column 3). Thus, the average cost difference per participant was approxi-mately 7500 NOK (column 4).
The estimated direct cost difference per participant was not significant (column 5). We attribute the non-significant result to the small number of observations (46 participants). The direction and size of the differ-ences are in line with the estimated results based on
Table 3Differences in mean number of visits, mean costs per visit, mean cost per participant. Intervention period. Two-sample t-tests with unequal variances. Cost figures in NOK
(1) (2) (3) (4) (5) (6)
Group No. of visits V
Average number of visits
Mean cost per visit (SD)
Total costs (2)xV
Average cost (3)/N
No. of participantN
Mean cost per partic. (SD)
Total costs
Intervention 1624 65 97.49 (82.85) 158323.76 6332.95 25 6322.78 (4101.98) 158069.50
Control 1806 86 87.88 (76.60) 158711.28 7557.68 21 7456.77 (12952.97) 156592.17
Difference 21 9.61 −387.52 −1224.72 −1134.00 1477.33
p-value .00 .68
Table 2Difference in mean change of COPM-P and COPM-S points per group. Intervention period. Two-sample t-test with equal variances
Group N Mean (SD) p-value
COPM-P .043
Intervention 25 4.33 (2.59)
Control 21 3.01 (2.48)
Difference 1.32
COPM-S .030
Intervention 24 4.30 (2.40)
Control 21 2.58 (2.67)
visits. The mean cost per person in the intervention group was 6,470 NOK, while the average in the control group was 13,914 NOK. The aggregate difference in total cost was approximately 130,000 NOK based on these es-timates (column 6).
We also found a significant lasting difference of aver-ages in COPM-P and COPM-S, that is, significant differ-ences between baseline and 9 months follow up (not reported in the table). A significant difference between baseline and 3-month follow up was sustained in both measures but the major difference was achieved during the intervention period. In fact, looking at the changes between the 3-month and 9-month follow up, the differ-ence between the groups was not significant.
Discussion
Implications for policymakers
In this cost-effectiveness study, reablement was found to be more cost-effective than usual care at 3 months fol-low up both in terms of improved performance in, and satisfaction with, daily activities. Moreover, the results of this study demonstrate that reablement is associated with significantly lower demand for traditional compen-sating care in the 6-month period following the
intervention, and consequently, lower average expendi-tures for the intervention group compared with the con-trol group. Cost savings were also found in the two other economic evaluations of reablement [3, 4]. These studies were substantially larger in terms of participants and used longer follow-up periods than the present study. Although the long-term effects are not studied here due to lack of data, the Australian studies point in the direction that the significant effects of reablement can be traced two years after the intervention [4] and even five years after [3]. Consequently, policy-makers need to consider implementing reablement on a larger scale. Nevertheless, this recommendation comes with a few words of caution.
Reablement is a client-centred intervention, where the older adults decide themselves which activities shall be the goals for their rehabilitation. This means that the older adults can prioritize other activities, beyond those that lead to a reduced need for home-based ser-vices. This happened often in the current study. The older adults did, for instance, prioritize outdoor phys-ical activities, leisure activities or social activities, none of which led to reduced need for home-based care services.
Fig. 1Bootstrap replications of the cost-effectiveness plane. COPM-P Table 4Summary statistics (intervention period). Cost figures in NOK
Control group (CG) (n =21)
Intervention group (IG) (n =25)
Difference
Cost (NOK)
Effect (COPM-P)
Effect (COPM-S)
Cost (NOK)
Effect (COPM-P)
Effect (COPM-S)
ΔC ΔEP ΔES
Mean 7456.77 3.01 2.58 6322.78 4.33 4.30 −1134.0 1.32 1.72
Standard deviation (SD) 12952.97 2.48 2.67 4101.98 2.59 2.40
In an effort to maximise the benefits gained, policy-makers might be tempted by the results in the current study to narrow the older adults’choices to only activ-ities that have the potential to reduce compensating help. We strongly discourage such a strategy. On the contrary, the major success criteria of reablement in the current study were that we used the Canadian Occupational Performance Measure instrument during the baseline interview. Using a client-centred goal for-mulation structure like COPM improves participation [21] and results [22], while a staff-directed goal-setting and rehabilitation process reduces participant engage-ment [23]. The motivational COPM interview allowed older adults to identify problems in their self-care, productivity and leisure activities and prioritize the most important of them. The effect was that the older adults were motivated and stimulated to work hard to-wards reaching their goals. This strong motivation and active engagement would have been less likely if activ-ity choices were restricted to personal care and do-mestic chores.
Implications for lifetime healthcare expenditures
As pointed out in the introduction, interventions that significantly influence people’s disability status can po-tentially reduce the use of home-based care services and thereby reduce (the growth rate of ) expenditure. As shown, reablement has this potential and we find inter-esting connections between our research and the larger issue of healthy ageing.
Healthy ageing, a scenario in which the population in a society experiences on average increased years lived in good health and increased life expectancy, implies that the increase in life expectancy is ‘translated’ into an in-crease in number of years spent in good health, leaving the demand for healthcare unchanged. As a result, the increase in average age in a population does not signifi-cantly influence healthcare expenditure per capita. The (inevitable) individual healthcare costs are merely post-poned. Some empirical studies give support to the healthy ageing scenario: individual healthcare costs in-crease substantially when an individual is close to death and these costs constitute a major part of the lifetime
Table 5Mean costs per person per group and total costs per group. Mean cost per visit, mean number of visits, total and average costs. Post-intervention period (6 months). Two-sample t-tests with unequal variances
(1) (2) (3) (4) (5) (6)
Group No. of visits
Average number of visits
Mean cost per visit (SD)
Total costs Average cost No. of partic. Mean cost per person (SD)
Total costs
Intervention 2202 88 73.50 (65.63)
161847.00 6473.88 25 6470.82 (10559.00)
161770.50
Control 3318 158 88.18
(81.08)
292581.24 13932.44 21 13914.31 (28962.05)
292200.51
Difference −78 −14.68 −130734.24 7458.56 −7443.23 −130430.01
p-value .00 .24
healthcare expenditures [24, 25]. These studies suggest that demographic changeper sewill not have a large im-pact on future aggregate healthcare expenditure.
According to van Baal and Wong [26], it is not sur-prising that individual variation in healthcare expend-iture to a large extent can be explained by time to death (TTD) rather than time from birth (age). They argue that we should consider age and TTD as proxy variables for morbidity and disability, which are the most import-ant drivers of individual healthcare demand. De Meijer et al. [1] support this argument. Of particular relevance here, they found that agesignificantly determines home-based care use and expenditurebut the effect is substan-tially reduced when controlling for disability. Further-more, the effect of disability has a much more sizeable effect on home-based care use than TTD.
The results reported by De Meijer et al. [1] also imply that disability status is one of the key variables in terms of deciding individual demand for long-term care. Age and disability proved to be the main determinants of utilization. Interestingly, the presence of at least one dis-ability displayed a greater effect on utilization than any additional disabilities. By contrast, general health status hardly affects long-term care use.
Crimmins et al. [27] emphasize that most of our knowledge about trends in disability is based on changes in the prevalence of disability. However, under-standing the dynamic forces affecting the prevalence of disability is important in interpreting changes in preva-lence and to make better projections of the likelihood of continued change. Crimmins et al. [27] point to sev-eral dynamic processes including postponed onset of disability; increase in recovery and/or changes in mor-tality of the disabled and nondisabled. As we have shown, reablement has the potential to achieve a recov-ery for older adults.
Strengths and limitations
The strengths and limitations of this study are the same as in the effectiveness study [2]. However, in addition, the major strength of the current economic study is that we use detailed costs and outcome data to evaluate the cost-effectiveness of reablement. A limitation of the cost-effectiveness study is, however, a rather large drop-out rate (25 %) in the final sample. However, the boot-strap replications improved the estimate of the ICER sampling distribution. Another limitation is that only face-to-face time spent in the participants’ homes were included in the time registration, not time spent in the healthcare providers’ offices. It is possible that reable-ment requires more time for collaboration and registra-tion than usual care. Further, a longer follow-up than 6 months would have been preferable in order to evalu-ate the sustainability of the reduction in expenditure.
Conclusions
To the best of our knowledge, this is the first published cost-effectiveness study on reablement conducted out-side Australia. We conclude that reablement stands out as a promising intervention, not only because it seems to decrease expenditure, but also because older adults feel they improve their performance and satisfaction in daily life activities. The combination of lower costs and higher effects is the kind of policy measure that will be of interest to policy-makers.
Abbreviations
AUD:Australian dollar; CEAC: cost-effectiveness acceptability curve; COPM: Canadian occupational performance measure; ICER: incremental cost-effectiveness ratio; HCE: health care expenditures; NOK: Norwegian crowns; RCT: randomized controlled trial; TTD: time to death; WTP: willingness to pay.
Competing interests
The authors declare that they have no competing interests.
Authors’contributions
HT initiated the study and developed the study design. HT was responsible for the collaboration with the local project leaders and for training and supervising the research assistants. HT monitored the data gathering and performed the preparations for the analyses. EK was responsible for the economic evaluation and contributed to its design. EK prepared the cost data used in the economic evaluation, performed the cost-effectiveness analysis and made the calculations of home-based care expenditures. Both authors wrote the article and approved the final version.
Acknowledgments
We want to thank Ingvild Kjeken for the input when planning the study design. We want also to thank the health-care providers for adherence to study protocol and the research assistants for conducting the data collection. Finally, we would like to express our thanks to the Regional Research Funds Western Norway for financial support.
Role of funding sources
HT, EK and local research assistants were sponsored by the Regional Research Funds Western Norway, grant number 229759. In addition, the Norwegian Association of Occupational Therapists supported HT. The funding sources had no involvement in the present study.
Author details
1Uni Research Rokkan Centre, P.O. Box 7810, Bergen 5020, Norway.2Centre
for Care Research Western Norway and Department of Occupational Therapy, Physiotherapy and Radiography, Bergen University College, P.O. Box 7030, Bergen, Norway.
Received: 26 February 2016 Accepted: 30 April 2016
References
1. de Meijer C, Koopmanschap M, d` Uva T, van Doorslaer E. Determinants of long-term care spending: Age, time to death or disability? J Health Econ. 2011;30:425–38.
2. Tuntland H, Aaslund M, Espehaug B, Førland O, Kjeken I. Reablement in community-dwelling older adults: A randomised controlled trial. BMC Geriatr. 2015;15(146):1–11.
3. Lewin GF, Alfonso HS, Alan JJ. Evidence for the long term cost effectiveness of home care reablement programs. Clin Interv Aging. 2013;8:1273–81. 4. Lewin G, Allan J, Patterson C, Knuiman M, Boldy D, Hendrie D. A comparison of
the home-care and healthcare service use and costs of older Australians randomised to receive a restorative or a conventional home-care service. Health Soc Care Com. 2014;22(3):328–36.
[Available from: http://www.ssb.no/en/helse/statistikker/pleie. Accessed 3 May 2016.
6. Wilde A, Glendinning C, Jones K, Baxter K, Rabiee P, Curtis LA, et al. `If they`re helping me then how can I be independent?` The perceptions and experience of users of home-care re-ablement services. Health Social Care Com. 2012;20(6):583–90.
7. Baker DI, Gottschalk M, Eng C, Weber S, Tinetti ME. The design and implementation of a restorative care model for home care. Gerontol. 2001;41(2):257–63.
8. Parsons JGM, Sheridan N, Rouse P, Robinson E, Connolly M. A Randomized Controlled Trial to Determine the Effect of a Model of Restorative Home Care on Physical Function and Social Support Among Older People. Arch Phys Med Rehab. 2013;94(6):1015–22.
9. Kjellberg J, Ibsen R. Economical evaluation of as long as posssible in own life in the municipality of Fredericia. (In Danish: Økonomisk evaluering af Længst Muligt i Eget Liv i Fredericia Kommune). Copenhagen: The Danish Commitee for Health Education; 2010.
10. Kjellberg PK, Ibsen R, Kjellberg J. From health care to rehabilitation. Knowledge and recommenations. (In Danish: Fra pleje og omsorg til rehabilitering. Viden og anbefalinger). Copenhagen: The Danish Commitee for Health Education; 2011.
11. Socialstyrelsen. Assessment of municipal experiences with rehabilitation of older adults. (In Danish: Kortlægning af kommunernes erfaringer med rehabilitering på ældreområdet). Copenhagen, Denmark; 2013.
12. Tuntland H, Ness NE, editors. Hverdagsrehabilitering (In English: Reablement). 1st ed. Oslo: Gyldendal Akademisk; 2014.
13. Tuntland H, Espehaug B, Forland O, Hole AD, Kjerstad E, Kjeken I. Reablement in community-dwelling adults: study protocol for a randomised controlled trial. BMC Geriatr. 2014;14(1):139.
14. Law M, Baptiste S, Carswell A, McColl M, Polatajko H, Pollock N. COPM Canadian Occupational Performance Measure (Norwegian version). 5th ed. Oslo: NKRR National advisory unit on rehabilitation in rheumatology; 2015. 15. Grey A, Clarke P, Wordsworth S. Applied Methods of Cost-Effectiveness
Analysis in Health Care. Oxford: Oxford University Press; 2011.
16. Briggs A, Mooney C, Wonderling D. Constructing confidence intervals for cost-effectiveness ratios: an evaluation of parametric and non-parametric techniques using Monte Carlo simulation. Stat Med. 1999;18:3245–62. 17. Briggs A, Wonderling D, Mooney C. Pulling cost-effectiveness analysis up by
its bottstraps: a non-parametric approach to confidence interval estimation. Health Econ. 1997;6:327–40.
18. Polsky D, Glick H, Wilke R, Schulman K. Confidence intervals of cost-effectiveness ratios: a comparison of four methods. Health Econ. 1997;6:243–52.
19. Severens JL, De Boo T, Konst E. Uncertainty of incremental cost-effectiveness ratios: a comparion of Fieller and bootstrap confidence intervals. Int J Technol Assess Health Care. 1999;15:608–14.
20. Van Hout B, Maiwenn J, Gordon G, Rutten F. Costs, effects and C/E ratios alongside a clinical trial. Health Econ. 1994;3:309–19.
21. Wressle E, Eeg-Olofsson AM, Marcusson J, Henriksson C. Improved client participation in the rehabilitation process using a client-centred goal formulation structure. J Rehabil Med. 2002;34(1):5–11.
22. Parsons JGM, Parsons MJG. The effect of a designated tool on person-centred goal identification and service planning among older people receiving homecare in New Zealand. Health Soc Care Com. 2012;20(6):653–62. 23. Lexell E, Lexell J, Larsson-Lund M. The rehabilitation plan can supprt clients`
active engagement and facilitate the process of change - experiences from people with late effect of polio participating in a rehabilitation programme. Disabil Rehabil. 2015;38(4):329–36.
24. Felder S, Werblow A, Zweifel P. Do red herrings swin in circles? Controlling for the endogeneity of time to death. J Health Econ. 2010;29:2015–212. 25. Zweifel P, Meier M. Ageing of population and health care expenditure: a
red herring? Health Econ. 2009;8(6):485–96.
26. van Baal P, Wong A. Time to death and the forecasting of macro-level health care expenditures: Some further considerations. J Health Econ. 2012;31:876–87.
27. Crimmins E, Hayward M, Hagedorn A, Saito Y, Brouard N. Change in disability-free life expectancy for Americans 70 years or older. Demography. 2009;46(3):626–46.
Submit your manuscript to a
journal and benefi t from:
7 Convenient online submission
7 Rigorous peer review
7 Immediate publication on acceptance
7 Open access: articles freely available online
7 High visibility within the fi eld
7 Retaining the copyright to your article