The Role of Valence Electron Concentration on the
Structure and Properties of Rapidly Solidified Sn-Ag
Binary Alloys
M. Kamal1, A. B. El-Bediwi1, T. El-Ashram2, M. E. Dorgham1
1Metal Physics Lab., Physics Department, Faculty of Science, Mansoura University, Mansoura, Egypt; 2Physics Department, Faculty
of Science, Port Said University, Port Said, Egypt. Email: [email protected]
Received October 28th,2011; revised December 2nd, 2011; accepted January 15th, 2012
ABSTRACT
A group of binary Sn-xAg alloys (x = 0.5, 1.5, 2.5, 3.5, 4.5, 5.5 and 6.5 wt%) has been produced by a single copper roller melt-spinning technique. In this study the interaction between Fermi sphere and Brillouin zone and Hume- Rothery condition of phase stability have been verified. It is found that by increasing valence electron concentration VEC the diameter of Fermi sphere 2kF increases which leads to the increase in the diameter of Brillouin zone which arises from the decrease in volume of the unit cell. It is found that the electrical resistivity increases by increasing VEC due to the decrease in relaxation time with increasing VEC. Also it has been confirmed that the correlation between Young’s modulus and the axial ratio c/a of -Sn unit cell.
Keywords: Alloys; Rapid Solidification; Valence Electron Concentration; Resistivity; Young’s Modulus; Fermi Energy;
Brillouin Zone
1. Introduction
Valence electron concentration (VEC) plays an important role on the structure and properties of alloys. This quan- tity indicates the number of all valence electrons in the alloy per number of atoms. Hume-Rothery found that definite structures of compounds arise in certain ranges of the valence electron concentration [1]. These com- pounds are called Hume-Rothery compounds or electron compounds. Also [2,3] found that the axial ratio c/a of
the β-Sn tetragonal unit cell increases by increasing VEC and decreases by decreasing VEC. This observation is confirmed recently by [4]. The increase in the axial ratio with decreasing VEC was explained qualitatively by [2,5] on the basis of the interaction between Fermi surface and Brillouin zone. When the Brillouin zone boundary touches the Fermi sphere, the structure corresponding to the zone will be stabilized. As a result, a pseudo-gap of density of states around the Fermi level will arise. This is the Hume- Rothery condition of phase stability i.e., KB = 2kF where
KB is the diameter of Brillouin zone and kF is the radius of Fermi sphere. Also it is found by [6] that the most important factor for the formation of stable quasicrystals is the valence electron concentration.
Fermi parameters such as Fermi energy EF, radius of Fermi sphere kF Fermi velocity vF, and the diameter of
the Brillouin zone KB can be calculated from the follow- ing equations;
2 2 3π2 3
2 F N E m V , 1 2 3 3π F N k V , F F k v m
, Bhkl 2π hkl
K d
where N/V is the total number of electrons per unit vol- ume in the alloy, m is the effective mass, ħ is the reduced Plank’s constant and dhkl is the interplanar distance.
Another example of the importance of VEC is the con- nection which has been observed by [4,7] between Young’s modulus and the axial ratio c/a of the tetragonal
unit cell of -Sn in which Young’s modulus increases by increasing the axial ratio. Also it is found that the resis- tivity decreases by increasing c/a. Therefore the objec-
2. Experimental Procedures
A group of binary Sn-xAg alloys (x = 0.5, 1.5, 2.5, 3.5, 4.5, 5.5 and 6.5 wt%) have been produced by a single copper roller melt-spinning technique.
Required quantities of the used metals were weighed out and melted in a porcelain crucible. After the alloys were molten, the melt was thoroughly agitated to effect homogenization. The casting was done in air at a melt temperature of 800˚C. The speed of the copper wheel was fixed at 2900 r.p.m. which corresponds to a linear speed of 30.4 m·s–1. X-ray diffraction analysis is carried
out with a Shimadzu x-ray diffractometer (DX-30), using Cu-K radiation with a Ni-filter ( = 0.154056 nm). Dif-
ferential thermal analysis (DTA) is carried out in a Shi- madzu DT-50 with heating rate 10 K/min. The measure- ment of resistivity is carried out by the double bridge method [8]. Young’s modulus was measured by the dynamical resonance method [9]. Vickers microhardness number (HV) is measured using the FM-7 microhardness tester.
3. Results and Discussion
[image:2.595.111.484.431.705.2]3.1. Structure
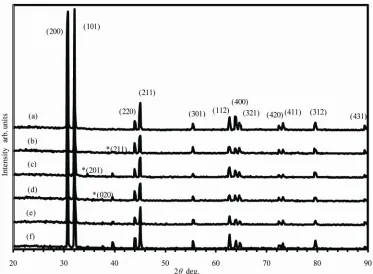
Figure 1 shows the x-ray diffraction patterns for as-
quenched melt-spun Sn-Ag alloys. The structure of Sn- 0.5Ag alloy is single solid solution of Ag in Sn (Figure
1(a)). The solid solubility of Ag in Sn for conventional
method is about 0.02 wt% at room temperature accord- ing to the equilibrium phase diagram [10]. This means extension of solid solubility from 0.02 to 0.5 wt% Ag. The Ag atoms are trapped in Sn lattice in excess of equi- librium concentration due rapid solidification. For Sn- 1.5Ag alloy an intermetallic compound Ag3Sn is formed
(Figure 1(b)). From 2.5 to 5.5 wt% Ag the number and
intensity of peaks due to intermetallic compound Ag3Sn
increase which means that its proportion increases (Fig- ures 1(c)-(f)). The intermetallic compound Ag3Sn is or-
thorhombic with space group (Pmmn) and lattice pa-rameters a = 5.968 A, b = 4.7802 and c = 5.1843 A.
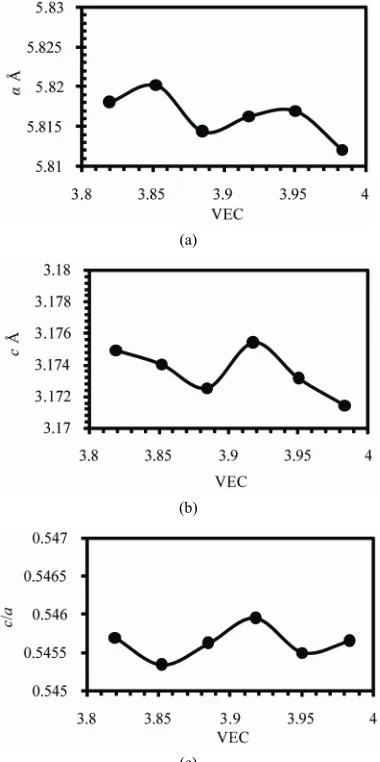
Figure 2 shows the variation of lattice parameters a, c
and the axial ratio c/a of the -Sn matrix with valence
electron concentration VEC. The variation in a and c
occurs in such a way to keep v decreases by increasing
VEC as shown in Figure 3(a). The axial ratio c/a has a
maximum value at VEC = 3.917 and minimum value at 3.852.
Figure 3(a) shows the variation of volume of unit cell v with VEC. It is found that the volume of unit cell
decreases by increasing VEC (see also Table 1). Figure 3(b) shows the variation of the intensity ratio from (101)
to (200) planes I101/I200 of -Sn matrix with VEC. It is
found that the ratio decreases to a minimum value 0.341 at 3.917 and then increases to maximum value about 1.8 at 3.983. The value of I101/I200 for pure Sn was found to
Figure 1. X-ray diffraction pattern for as quenched melt spun (a) Sn-0.5Ag; (b) Sn-1.5Ag; (c) Sn-2.5Ag; (d) Sn-3.5Ag; (e) n-4.5Ag; (f) Sn-5.5Ag alloys. All peaks are for -Sn and the peaks for Ag3Sn are indicated by *.
S
(a)
(b)
[image:3.595.78.268.87.468.2](c)
Figure 2. The variations of lattice parameters (a) a, (b) c and (c) the axial ratio c/a.
be 1.1 [11]. The addition of 0.5 Ag raises this value to 1.8; this may be attributed to that the Ag atoms are trapped in Sn lattice in excess of equilibrium concentra- tion. The decrease in I101/I200 to 0.341may be due to the
precipitation of Ag to form the intermetallic compound Ag3Sn.
The relationship between the diameter of the Brillouin zone KB and the diameter of the Fermi sphere 2kF is
shown in Figure 4. A linear correlation is found between KB and 2kF. As 2kF increases, KB increases in agreement of the condition of stability (see also Table 1). The value
of KB is calculated for (211) planes. This is direct evi- dence on the interaction between Fermi sphere and Bril- louin zone and verification of Hume-Rothery condition of phase stability. From Table 1 it is clear that as the Ag
concentration increases, VEC decreases since the valency of Ag is +1. All of the Fermi parameters decrease by decreasing VEC and vice versa. The decrease in v with
increasing VEC means that the volume of the first Bril- louin zone increases by increasing VEC since they are inversely proportional to each other. This is also indi- cated by the increase in KB with increasing VEC. There-
(a)
[image:3.595.326.518.263.567.2](b)
[image:3.595.59.540.637.736.2]Figure 3. The variation of (a) volume of unit cell (v) and (b) intensity ratio from (101) and (200) planes (I101/I200) with VEC.
Table 1. The Fermi parameters and the diameter of the Brillouin zone.
wt% Ag in Sn at.% Ag in Sn VEC n × 1023 (cm–3) v (Å3) KB211 (Å–1) 2kF (Å–1) EF (eV) VF × 104 (m·s–1)
0.5 0.5498 3.9835 1.4803 107.13 3.125472 3.2731 0.6366 1.893
1.5 1.6479 3.9505 1.4775 107.37 3.123219 3.2709 0.6358 1.892
2.5 2.7438 3.9176 1.4744 107.42 3.12254 3.2687 0.6349 1.890
3.5 3.8375 3.8848 1.4713 107.25 3.124291 3.2664 0.6340 1.889
4.5 4.9291 3.8521 1.4679 107.52 3.121835 3.2639 0.6330 1.888
5.5 6.0184 3.8194 1.4645 107.47 3.122153 3.2613 0.6320 1.886
Figure 4. The relationship between the diameter of the Bril- louin zone KB and the diameter of the Fermi sphere 2kF.
fore by increasing VEC the diameter of Fermi sphere increases which leads to the increase of the diameter of Brillouin zone which arises from the decrease in volume of the unit cell.
3.2. Thermal Analysis
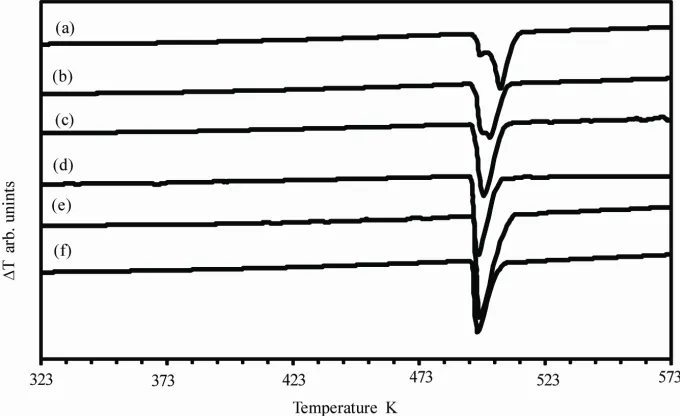
The DTA curves obtained for as-quenched melt-spun Sn-xAg alloys (x = 0.5, 1.5, 2.5, 3.5, 4.5 and 5.5 wt%) are shown in Figure 5. There is double peak in case of
Sn-0.5Ag and Sn-1.5Ag alloys. This double peak may be due to the decomposition of the supersaturated solid so- lution of Ag in Sn which is formed due to rapid solidifi- cation. The variation of the enthalpy ∆H of fusion with valence electron concentration VEC is shown in Figure 6(a). ∆H decreases by increasing VEC i.e., ∆H increases
with Ag concentration. A maximum value 76.82 × 10³
J·kg–1 is observed for VEC = 3.85 and then ∆H decreases
with VEC to a minimum value 28.81 × 10³ J·kg–1 for
VEC = 3.95. The increase in enthalpy is due to the in- crease in the proportion of Ag3Sn intermetallic com-
pound and this increases the incoherent interfaces which in turns increase the interfacial energy and hence in- creasing the enthalpy. The solidus Ts and liquidus T1
temperatures are shown in Figure 6(b). It is evident that
the Sn-3.5Ag alloy is the eutectic alloy because it has the lowest melting point. Also the eutectic reaction is found to occur at about 494 K.
3.3. Electrical Properties
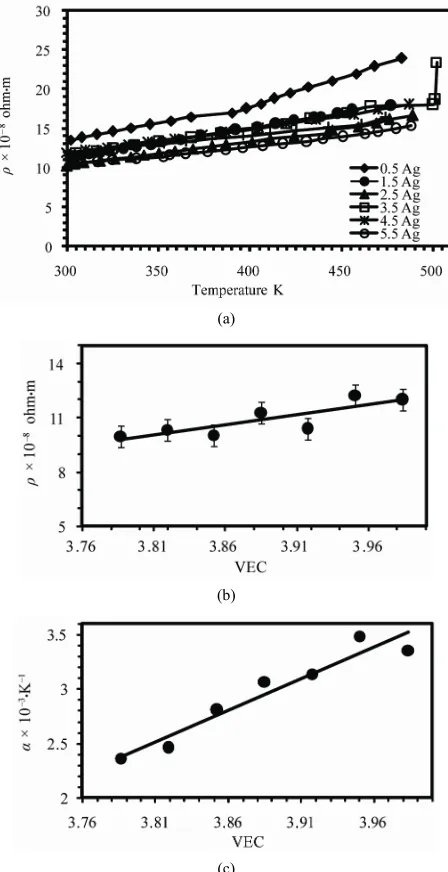
The temperature dependence of the electrical resistivity () of as-quenched melt-spun alloys is shown in Figure 7 (a). The resistivity increases linearly with temperature
however; there is a phase transition before melting in case of Sn-0.5Ag alloy in agreement with DTA results. Also a rapid increase in resistivity observed for 3.5 Ag alloy at about 494 K which is due melting of alloy. The variation of the resistivity at room temperature with va- lence electron concentration (VEC) is shown in Figure 7 (b). The resistivity increases with VEC from about 9.9 ×
10–8 to 12 × 10–8 ohm·m. The resistivity is given by;
2
m ne
where m is the effective mass, n is the number
of electrons per unit volume, e is the electron charge, and
is relaxation time. The relaxation time is given by;
F
l v
, where l is the mean free path and vF is the Fermi
velocity. From Table 1 it is clear that vF increases with
VEC, so that decreases with VEC. Therefore the resis-
Figure 5. Differential thermal analysis for as quenched melt spun (a) Sn-0.5Ag; (b) Sn-1.5Ag; (c) Sn-2.5Ag; (d) Sn-3.5Ag; (e) n-4.5Ag; (f) Sn-5.5Ag alloys.
S
[image:4.595.127.467.497.705.2](a)
[image:5.595.310.534.85.521.2](b)
Figure 6. The variation of (a) enthalpy of fusion, (b) solidus and liquidus temperatures with VEC.
tivity increases with VEC which is observed experimen- tally.
Figure 7(c) shows the variation of temperature coeffi-
cient of resistivity with VEC. It is found that in- creases linearly with increasing VEC. It is well known that the relaxation time is inversely proportional to the temperature which leads to the linear dependence of the resistivity with temperature. Therefore as the relaxation time decreases with VEC, increases with VEC.
3.4. Mechanical Properties
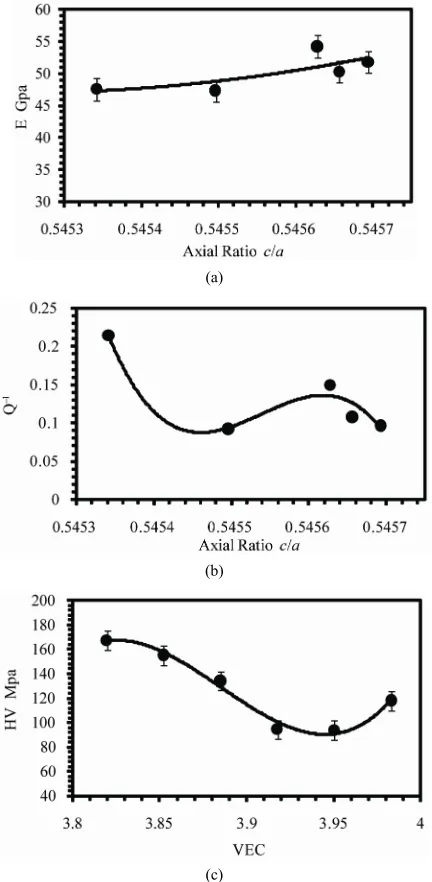
Figure 8(a) shows the variation of Young’s modulus (E)
with the variation of the axial ratio (c/a) of the -Sn ma-
trix. It is evident that E increases by increasing c/afrom
47.56 GPa at 0.5453 to 54.22 GPa at 0.5456. This result is in agreement with the result obtained by [4]. The in- crease in c/a ratio means the stretching of the unit cell
along the c-axis, this modification in the shape of unit
cell of Sn matrix may results in an increase in the bond strength which results in an increase of Young’s modulus.
Figure 8(b) shows the variation of internal friction Q–1
with the axial ratio (c/a). Q–1 decreases from 0.2138 at
0.5453 to 0.0962 at 0.5456. There are several mecha- nisms by which internal friction results such as thermoe- lastic effect, motion of interstitial and substitutional at- oms, intercrystalline thermal current and the motion of dislocations. Which of these mechanisms is operative
(a)
(b)
(c)
Figure 7. (a) The temperature dependence of resistivity (b) The varaition of resistivity at room temperature and (c) temperature coefficient of resistivity with VEC.
depends on the frequency. In the frequency range from 0.1 to 20 Hz used in the present work the mechanism inherent here is the motion of interstitial atoms. The de- crease in internal friction with c/a may be due to the
stretching of the unit cell along c-axis resists the move-
ment of Ag atoms within the unit cell.
Figure 8(c) shows the variation of Vickers micro-
[image:5.595.91.255.86.356.2](a)
(b)
(c)
Figure 8. (a) Variation of Young’s modulus and (b) internal friction with axial ratio (c) Variation of Vickers micro-hardness number with VEC.
of Ag3Sn intermetallic compound which increases by
increasing Ag concentration.
4. Conclusion
In this study the interaction between Fermi sphere and Brillouin zone and Hume-Rothery condition of phase stability have been verified. By increasing valence elec- tron concentrationVEC the diameter of Fermi sphere 2kF increases which leads to the increase in the diameter of Brillouin zone which arises from the decrease in volume
of the unit cell. The electrical resistivity increases by increasing VEC due to the decrease in the relaxation time
with increasing VEC. Also it has been confirmed that the correlation between Young’s modulus and the axial ratio c/a of -Sn unit cell. In conclusion, valence electron
concentration is the most important factor for structure and properties changes of Sn-Ag alloys.
REFERENCES
[1] W. Hume-Rothery, “Research on the Nature, Properties and Conditions of Formation of Intermetallic Compounds, with Special Reference to Certain Compounds of Tin,”
Journal Institute of Metals, Vol. 35, 1926, pp. 295-299. [2] G. V. Raynor and J. A. Lee, “The Tin-Rich Intermediate
Phases in the Alloys of Tin with Cadmium, Indium and Mercury,” Acta Metallurgica, Vol. 2, No. 4, 1954, pp. 616- 620. doi:10.1016/0001-6160(54)90197-2
[3] R. H. Kane, B. C. Giessen and N. J. Grant, “New Me- tastable Phases in Binary Tin Alloy Systems,” Acta Met- allurgica, Vol. 14, No. 5, 1966, pp. 605-609.
doi:10.1016/0001-6160(66)90068-X
[4] T. El-Ashram, “The Relation between Valency, Axial Ratio, Young’s Modulus and Resistivity of Rapidly So- lidified Tin-Based Eutectic Alloys,” Journal of Materials Science: Materials in Electronics, Vol. 16, 2005, pp. 501- 505. doi:10.1007/s10854-005-2724-3
[5] K. Schubert, U. Roseler, W. Mahler, E. Doerre and W. Schuett, “Strukturuntersuchungen an Einigen Valenzelek-tronen-Armen Legierungen Zwischen B-Metallen,” Z. Metallk, Vol. 45, 1954, pp. 643-647.
[6] A.-P. Tsai, “Decagonal Structure of Al72Ni20Co8 Studied
by Atomic-Resolution Electron Microscopy,” Journal of Non-Crystalline Solids, Vol. 334-335, 2004, pp. 317-322. doi:10.1016/j.jnoncrysol.2003.11.038
[7] M. Kamal, A. B. El-Bediwi and T. El-Ashram, “The Ef- fect of Rapid Solidification on the Structure, Decomposi- tion Behavior, Electrical and Mechanical Properties of the Sn-Cd Binary Alloys,” Journal of Materials Science: Ma- terials in Electronics, Vol. 15, No. 4, 2004, pp. 211-217. doi:10.1023/B:JMSE.0000012457.77041.c6
[8] Y. A. Geller and A. G. Rakhshtadt, “Science of Materi- als,” Mir Publishers, Moscow, 1977.
[9] E. Schreiber, O. L. Anderson and N. Soga, “Elastic Con- stants, and Their Measurements,” McGraw-Hill Compa- nies, Inc., New York, 1973.
[10] M. Hansen and K. Anderko, “Constitution of Binary Al- loys,” 2nd Edition, McGraw-Hill Companies, Inc., New York, 1958.
[11] T. El-Ashram, “Structure and Properties of Rapidly So- lidified Pure Tin,” Radiation Effects and Defects in Solids, Vol. 161, No. 3, 2006, pp.193-197.
[image:6.595.65.281.86.527.2]