SOFTWARE QUALITY PREDICTION USING FUZZY RULE BASED SYSTEM
*
Jaya Pal
Department of CS & E, Birla
ARTICLE INFO ABSTRACT
Development of software quality, development effort etc is a common application of software metrics. A new tool as Fuzzy
prediction. This paper illustrates the practice of estimation at a personal level using projects and presents the results obtained with a fuzzy rule based system and an ordinary multip
Result shows that the value of MMRE applying fuzzy logic is smaller than MMRE applying multiple regression; while the value of Pred (0.25) and Pred (0.05) applying fuzzy logic is higher than Pred (0.25) and Pred (0.05) applying multiple regr
used as alternative for predicting the software quality.
Copyright © 2015 Jaya Pal and Vandana Bhattacherjee
permits unrestricted use, distribution, and reproduction in any medium, provided the original work is properly cited.
INTRODUCTION
Software Quality Prediction has been identified as one of the major challenges for computer science (Fredrick
2003). No method or model of estimation should be preferred over all others. Fuzzy logic may be used as a convenient tool for software development quality estimation
2002; Briand and Wieczorek, 1996).
Soft computing technique likes fuzzy logic, case based reasoning have been used by several researchers for estimation of development cost and time in Software Enginee (Musflek et al., 2000; Huang et al., 2004; Idri
et al., 2002; Gray et al., 1997; Braz et al., 2004
and Kumar, 2006; Bhattacherjee, 2006; Bhattacherjee, 2009 Bhattacherjee et al., 2008;
al., 2009). In this research paper a fuzzy logic system for
software quality prediction has been developed. Further this paper compares estimations obtained with Multiple Regression and Fuzzy Logic. For developing the model, three quality metrics have been gathered for dataset collected from the projects developed by postgraduate students of Birla Institute of Technology, Mesra, Ranchi, India. These metrics are Graphical User Interface (GUI), Meaningful Error Message (MEM) and User Manual (UM).
*Corresponding author: Jaya Pal,
Department of CS & E, Birla Institute of Technology, Ranchi.
ISSN: 0975-833X
Vol.
Article History:
Received 26th September, 2015
Received in revised form
15th October, 2015
Accepted 27th November, 2015
Published online 30th December,2015
Key words:
Software Quality Estimation, Fuzzy Logic, Fuzzy Rule based System, Multiple Regressions.
Citation: Jaya Pal and Vandana Bhattacherjee Journal of Current Research, 7, (12), 24181-24185
RESEARCH ARTICLE
SOFTWARE QUALITY PREDICTION USING FUZZY RULE BASED SYSTEM
Jaya Pal and Vandana Bhattacherjee
Department of CS & E, Birla Institute of Technology, Ranchi
ABSTRACT
Development of software quality, development effort etc is a common application of software metrics. A new tool as Fuzzy Logic offers a good technique for building models for software quality prediction. This paper illustrates the practice of estimation at a personal level using projects and presents the results obtained with a fuzzy rule based system and an ordinary multip
Result shows that the value of MMRE applying fuzzy logic is smaller than MMRE applying multiple regression; while the value of Pred (0.25) and Pred (0.05) applying fuzzy logic is higher than Pred (0.25) and Pred (0.05) applying multiple regression. Thus Results demonstrate that fuzzy logic can be used as alternative for predicting the software quality.
Jaya Pal and Vandana Bhattacherjee. This is an open access article distributed under the Creative Commons Att use, distribution, and reproduction in any medium, provided the original work is properly cited.
Software Quality Prediction has been identified as one of the Fredrick and Brooks, No method or model of estimation should be preferred over all others. Fuzzy logic may be used as a convenient tool
ware development quality estimation (Witold Pedrycz,
Soft computing technique likes fuzzy logic, case based reasoning have been used by several researchers for estimation of development cost and time in Software Engineering
Idri et al., 2001; Idri ., 2004) (Bhattacherjee , 2006; Viraj and ., 2008; Bhattacherjee et . In this research paper a fuzzy logic system for software quality prediction has been developed. Further this estimations obtained with Multiple Regression and Fuzzy Logic. For developing the model, three quality metrics have been gathered for dataset collected from the projects developed by postgraduate students of Birla Institute of Technology, Mesra, Ranchi, India. These metrics are Graphical User Interface (GUI), Meaningful Error Message
Department of CS & E, Birla Institute of Technology, Ranchi.
Multiple regressions
A linear equation with three independent variables (multiple regressions) may be expressed as:
y = b0 + b1x1 + b2x2 + b3x3
Where b0, b1, b2 and b3 are constants; independent variables, and y
values of b0, b1, b2 and b3 of the multiple regressions Equation may be obtained solving the following system of linear equations
Σy = nb0+ b1(Σx1) + b2(Σx2) + b
Σx1y = b0(Σx1) + b1(Σx1 2
) + b2(Σx
Σx2y = b0(Σx2) + b1(Σx1x2) + b2
Σx3y = b0(Σx3) + b1(Σx1x3) + b
Fuzzy logic
Intelligent Systems provide alternative paradigms aimed at facilitating the representation and manipulation of uncertain, incomplete, imprecise or noisy data. Specifically, Fuzzy Logic offers a particularly convenient way to generate a keen mapping between input and output spaces thanks to fuzzy
International Journal of Current Research
Vol. 7, Issue, 12, pp.24181-24185, December, 2015
INTERNATIONAL
Jaya Pal and Vandana Bhattacherjee, 2015. “Software Quality Prediction using Fuzzy Rule based System 24185.
SOFTWARE QUALITY PREDICTION USING FUZZY RULE BASED SYSTEM
Institute of Technology, Ranchi
Development of software quality, development effort etc is a common application of software Logic offers a good technique for building models for software quality prediction. This paper illustrates the practice of estimation at a personal level using projects and presents the results obtained with a fuzzy rule based system and an ordinary multiple regression. Result shows that the value of MMRE applying fuzzy logic is smaller than MMRE applying multiple regression; while the value of Pred (0.25) and Pred (0.05) applying fuzzy logic is higher than Pred ession. Thus Results demonstrate that fuzzy logic can be
is an open access article distributed under the Creative Commons Attribution License, which
A linear equation with three independent variables (multiple regressions) may be expressed as:
……….. (1)
are constants; x1, x2 and x3 are the y is the dependent variable. The
the multiple regressions Equation may be obtained solving the following system of
) + b3(Σx3) …………. (2)
(Σx1x2) + b3(Σx1x3) ………... (3)
2(Σx22) + b3(Σx2x3) ………. (4)
(Σx1x3) + b2(Σx2x3) + b3(Σx32) ………. (5)
Intelligent Systems provide alternative paradigms aimed at facilitating the representation and manipulation of uncertain, plete, imprecise or noisy data. Specifically, Fuzzy Logic offers a particularly convenient way to generate a keen mapping between input and output spaces thanks to fuzzy
INTERNATIONAL JOURNAL OF CURRENT RESEARCH
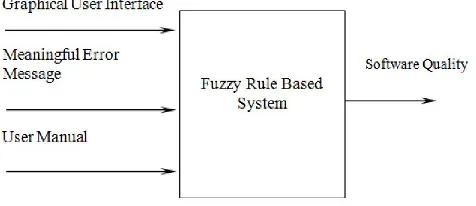
rules’ natural expression (12). This paper presents a fuzzy rule based system having three fuzzy inputs, namely Graphical User Interface (GUI), Meaningful Error Message (MEM) and User Manual (UM) and one output Software Quality (SQ) as shown in Figure 1.
[image:2.595.49.287.132.235.2]
Figure 1. Proposed Fuzzy Rule Based System
Fuzzy rule based system
A typical fuzzy logic system consists of four main components as shown in Figure.
1. Fuzzification: that contains predefined set of linguistic values. It converts non-fuzzy (Deterministic) inputs of fuzzy system into fuzzy inputs for inferencing mechanism.
2. Knowledge base: that consists of two parts: database that defines linguistic variables conditional statements (Fuzzy sets, and rule base that represents the mapping of fuzzy input set into a fuzzy output set. Rules are fuzzy implications). Fuzzy sets, and rule base that represents the mapping of fuzzy input set into a fuzzy output set. Rules are fuzzy conditional statements (implications).
3. Decision logic: that simulates human decision making based on fuzzy concepts. Conclusion of certain condition is derived by decision making logic.
4. Defuzzification: that converts rule base fuzzy outputs into non-fuzzy (.numerical) values.
Fuzzy inferencing rules generally connect m conditional variables X1,..., Xm to n consequent variables Y1,..., Yn in form of:
IF (X1 is A1 and ………..Xm is Am) THEN (Y1 is B1 and ... Yn is Bn).
Where A1,..., Am and B1,..., Bn are linguistic terms of linguistic variables X1,...,Xm andY1,..., Yn, respectively.
The IF part is called the “antecedent” and the THEN part is called the “consequent”. To make a decision based on a set of rules, a rules-based system follows these steps:
1. All the rules that apply are invoked, using the membership functions and truth values obtained from the inputs (by a process called fuzzification), to determine the result of the antecedent.
2. This result in turn will be mapped into a membership function and truth value controlling the output variable. This process is known as implication. Two of the more common implication functions are: clipping (the fuzzy set is clipped to a value given by the level of activation of the input variables) and scaling (the fuzzy set is multiplied by a value given by the level of activation of the input variables).
3. These results are combined by a process called aggregation. One common approach for the aggregation involves using the “maximum” of the implicated sets.
4. Finally, a process known as defuzzification is used to compute a single value that is representative of the aggregated fuzzy set. A typical defuzzification approach .
Evaluation criteria
A common criterion for the prediction of software quality model is the Magnitude of Relative Error (MRE) which is defined as follows:
| Actual quality – Predicted quality | MRE =
Actual quality
The MRE value is calculated for each observation whose quality is predicted. The aggregation of MRE over multiple observations (N), can be achieved through the Mean MRE (MMRE) as follows:
A complementary criterion is the prediction at level l, Pred (l) = k/N, where k is the number of observations where MRE is less than or equal to l, and N is the total number of observations. Thus, Pred (25) and Pred (5) gives the percentage of projects which were predicted with a MRE less or equal than 0.25 and 0.05 respectively.
RESEARCH METHODS
Metrics used
the requirements laid down in SRS document, the greater is its quality. The metrics have been used GUI, MEM and UM which served as input to the Fuzzy Logic System (19).
Description of metrics
1. GUI (Graphical User Interface): GUI was measured as the relative number of forms which were clearly displayed, on a scale of 0-10.
2. MEM (Meaningful Error Message): MEM was measured as the relative number of meaningful error messages displayed by the software, on a scale of 0-1.
3. UM (User Manual): UM was measured as the completeness of the user manual or help file, on a scale of 1-20.
The quality of the ultimate product (projects) has been judged by team of three experts who ranked the various projects on a scale of 50-100 and this served as the predicted output.
Data Gathered
The hundred and ten project developed by Post Graduate students during their final semester were evaluated for quality metrics. The snapshot of the projects are depicted in Table 1.
Multiple regression equation
Solving the System of linear equations (2),(3),(4) and (5) using three independent variables and data from Table 1 the equation (1) gives
SQ’=134.3 +11.35*GUI-69.32*MEM–5.37*UM ………. (6)
Therefore GUI, MEM as well as UM metrics are all useful to predict the software quality per project.
Fuzzy rules
The term fuzzy identification usually refers to the techniques
and algorithms for constructing fuzzy models from data. The expert knowledge in a verbal form is translated into a set of if– then rules. A certain model structure can be created, and parameters of this structure, such as membership functions and weights of rules, can be tuned using input and output data. For our application, we have used the Mamdani- type fuzzy rule based system. Here a general rule has following format:
RK : If(x1 is A1k) & (x2 is A2 k) &…& (xn is Ank) then (y is Bk)
Where RK is the k-th rule in the fuzzy rule base (k=1, 2,…k).
Here Ajk and Bk are fuzzy sets on appropriate domains (j=1,
2,….,n)
This paper is based on the following fuzzy rules:
Rule 1: If GUI is low and UM is Small then SQ is low. Rule 2: If GUI is average and UM is medium then SQ is Average.
Rule 3: If GUI is high and UM is big then SQ is high. Rule 4: If MEM is low then SQ is low.
Rule 5: If MEM is average then SQ is average. Rule 6: If MEM is high then SQ is high.
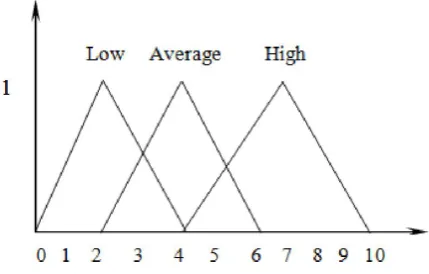
Input and output Membership Functions (MF) are depicted in Table 2. All are triangular and their scalar parameters (a, b, c) are defined as follows:
[image:3.595.70.256.399.509.2]MF(x) = 0 if x < a MF(x) = 1 if x = b MF(x) = 0 if x > c
Table 2. Membership Function Characteristics
Inputs
Variable Name Range MF Parameters
a b c
Graphical User Interface 0-10 Low 0 2 4
Average 2 4 6
High 4 7 10
Meaningful Error Message 0-1 Low 0.1 0.25 0.4
Average 0.3 0.5 0.7
High 0.5 0.85 1
User Manual 1-20 Small 2 6 10
Medium 8 11 14
Big 12 16 20
Output
Variable Name Range MF Parameters
a b c
Software Quality 50-100 Low 50 60 70
Average 60 80 90
High 80 90 100
The membership function plots corresponding to Table 2 are shown in Figures 2(a), 2(b), 2(c) and 2(d).
Figure (a). Graphical User Interface (input) Table 1. Projects Id and metrics, Graphical User Interface
(GUI): Meaningful Error Message (MEM), User Manual (UM), Software Quality (SQ) (ranks)
Sl No. Project Id GUI MEM UM SQ
1 P1 0 0.5 9 75
2 P2 5 0.5 14 80
3 P3 1 0.4 8 72
4 P4 7 0.7 12 82
5 P5 7 0.7 16 82
6 P6 6 0.6 14 83
7 P7 7 0.8 18 91
8 P8 1 0.2 9 62
9 P9 7 0.5 14 82
[image:3.595.326.541.605.742.2]Figure (b). Meaningful Error Message (input)
Figure (c). User Manual (input)
40 50 60 70 80 90 100
Figure (d). Software Quality (output)
Figure 2. Membership Function plots
Experimental results
Both multiple regressions (equation 6) and these fuzzy rules Systems are applied to same data subset. The MRE results are depicted in Table3.
Conclusion
This paper illustrates the practice of estimation at a personal level using small projects and presents the results obtained with a fuzzy logic system and an ordinary multiple regression.
Results demonstrate that fuzzy logic can be used as alternative for estimating the software quality.
Table 3. MRE comparison between estimation models
Project Id Actual SQ Multiple Regression Fuzzy Logic
SQ’ MRE SQ’ MRE
P1 75 51.31 0.315 75.6 0.008
P2 80 81.21 0.015 80.3 0.004
P3 72 74.97 0.041 71.6 0.005
P4 82 100.81 0.229 82 0.000
P5 82 79.33 0.032 81.96 0.0005
P6 83 85.63 0.032 82.5 0.006
P7 91 61.69 0.322 90 0.010
P8 62 83.46 0.346 61.25 0.004
P9 82 103.91 0.267 81.96 0.0005
P10 92 78.36 0.148 91.5 0.005
Moreover, the pred (5), pred (25) and MMRE as given in Table4:
Result showed that the value of MMRE applying fuzzy logic is smaller than MMRE applying multiple regression; while the value of Pred (25) and Pred (5) applying fuzzy logic is higher than Pred (25) and Pred (5) applying multiple regression. Moreover one of the 10 MRE equal to zero using Fuzzy Logic(as shown in bold font in Table3).
Future research involves in collecting more data to serve as the basis of a generalized fuzzy tool for quality prediction. Additional parameters would be included in our future metrics for facilitating more accurate prediction.
Acknowledgements
The authors thank the postgraduate students of Birla Institute of Technology who participated in the study.
REFERENCES
Bhattacherjee, V. 2006. “The Soft Computing Approach to Program Development Time” in proceedings ICTT, pp.291-292
Bhattacherjee, V. and Kumar, S. 2006. An Expert Case Based Framework for Software Cost Estimation, in proceedings SCT-2006, pp 183-188
Bhattacherjee, V. and Pal, J. 2009. “Fuzzy Rule Based System for Fine Prediction in Accidents” in proceedings of Conference on information Science, Technology and Management, CISTM, MDI Gurgaon, India, July 13-15, 2009
Bhattacherjee, V., Kumar, S. and Rashid, E. 2008. “A Cases Study on Estimation of Software Development Effort” in proceedings ICACT.
[image:4.595.42.289.54.591.2]Bhattacherjee, V., Kumar, S. and Rashid, E. 2009. ”Case Based Estimation Model Using Project Feature Weight “in proceedings RAIT, pp 142-246
Table 4. Prediction Results
Multiple Regression Fuzzy Logic
MMRE 0.1747 0.0043
Pred(5) 0.4 1.0
[image:4.595.322.543.109.225.2] [image:4.595.349.519.268.311.2]Braz, M. and Vergilio S. 2004. Using Fuzzy Theory for Effort Estimation of Object-Oriented Software. Proceedings of the 16th IEEE International Conference on Tools with Artificial Intelligence, ICTAI.
Briand, L.C. and Wieczorek, I. Software Resource Estimation. Encyclopedia of Software Engineering. Volume 2, New York: John Wiley & Sons, pp. 1160-1196.
Fredrick P. Brooks, Jr. 2003. Three Great Challenges for Half-Century-Old Computer Science. Journal of the ACM, Vol. 50, No. 1 pp. 25-26, January 2003
Gray, A. and MacDonell S. Applications of Fuzzy logic to Software Metric Models for Development Effort Estimation. 1997
Idri, A., Abran, A. and Khoshgoftaar, T. 2002. Estimating Software Project Effort by Analogy Based nonlinguistic Values. Proceedings of the Eighth IEEE Symposium on Software Metrics (METRICS.02).
Idri, A., Abran, A. and Khoshgoftaar, T. Fuzzy, 2001. Analogy: a New Approach for Software Cost Estimation. International (7) X. Huang, J. Ren and L.F. Capretz. A Neuro-FuzzyTool for Software Estimation .Proceedings of the 20th IEEE International Conference on Software Maintenance, p. 520 2004. Workshop on Software Measurement (IWSM´01), Montréal, Québec, Canada, August 28-29.
Lofti A. Zadeh, 1999. From Computing with Numbers to Computing with Words – From Manipulation of Measurements to Manipulation of Perceptions. IEEE Transactions on Circuits and Systems – I: Fundamental Theory and Applications , vol. 45, no. 1,pp 105-119. Mall, R. 2003. Fundamentals of Software Engineering, PHI,
2nd Edition.
Musflek, P., Pedrycz, W., Succi, G. and Reformat, M. 2000. Software Cost Estimation with Fuzzy Models, Applied Computing Review, Vol. 8, No. 2. pages 24-29.
Pal, J. and Bhattacherjee, V. 2009. “A Fuzzy Logic System for
Software Quality Estimation”, in proceedings ICIT 2009,
pp 183-187.
Pressman, R. 2001. Software Engineering, 5th ed. McGraw-Hill.
Viraj, N. and Bhattacherjee, V. 2009. “Software Development Time Estimation Using Fuzzy Logic”, presented at TECHTATVA 2009,Manipal Institute of Technology, Karnataka, India, September 8-11.
Witold Pedrycz, 2002. Computational Intelligence as an Emerging paradigm of Software Engineering. SEKE, Ischia, Italy