https://www.scirp.org/journal/jgis ISSN Online: 2151-1969
ISSN Print: 2151-1950
DOI: 10.4236/jgis.2019.115031 Oct. 11, 2019 500 Journal of Geographic Information System
Remote Sensing Applied to the Evaluation of
Spatial and Temporal Variation of Water
Quality in a Coastal Environment, Southeast
Brazil
Pedro Bettencourt1, Julio Cesar Wasserman1,2* , Fábio Ferreira Dias3, Paulo Roberto Alves3,
Dandara Bernardino Bezerra4, Camila Américo Santos5, Luis Perez Zotes1,
Sérgio Ricardo Barros1
1Post-Graduate Program in Sustainable Systems Management, UFF, Niterói, Brazil 2Post-Graduate Program in Geochemistry, UFF, Niterói, Brazil
3Department of Geoenvironmental Analysis, UFF, Niterói, Brazil
4Pós graduação em Biologia Marinha e Ambientes Costeiros, UFF, Niterói, Brazil 5Pós graduação em Engenharia de Biossistemas, UFF, Niterói, Brazil
Abstract
The monitoring of water quality in large coastal regions demands great ana-lytical efforts through the collection of many samples, over long periods. Re-mote sensing is a reliable tool that can provide valuable information on the spatial and temporal variations of environmental parameters, particularly turbidity and chlorophyll a. The aim of the present research was to evaluate the spatial and temporal distribution of water quality from 2005 to 2017 along the north coast of São Paulo and its responses to the implementation of in-dustrial developments and to variations in rainfall. Fifty-two MODIS images were used, showing concentrations of chlorophyll a and turbidity, in the dry season and wet season, from 2005 to 2017. The results showed that dilution processes (due to rainfall) control chlorophyll a concentrations. However, a notable increase in concentrations could be identified after the installation of some of the developments in the region, particularly roads and ports. Turbid-ity was also shown to be affected by dilution processes, and during the wet season this parameter presented lower values. No effect in the results of tur-bidity could be identified from the installation of roads or ports, showing that vegetation cover exerts an important control on the erosional processes.
Keywords
Water Quality, Chlorophyll a, Turbidity, MODIS, Remote Sensing
How to cite this paper: Bettencourt, P., Wasserman, J.C., Dias, F.F., Alves, P.R., Bezerra, D.B., Santos, C.A., Zotes, L.P. and Barros, S.R. (2019) Remote Sensing Ap-plied to the Evaluation of Spatial and Temporal Variation of Water Quality in a Coastal Environment, Southeast Brazil.
Journal of Geographic Information System, 11, 500-521.
https://doi.org/10.4236/jgis.2019.115031
Received: August 19, 2019 Accepted: October 8, 2019 Published: October 11, 2019 Copyright © 2019 by author(s) and Scientific Research Publishing Inc. This work is licensed under the Creative Commons Attribution International License (CC BY 4.0).
http://creativecommons.org/licenses/by/4.0/
DOI: 10.4236/jgis.2019.115031 501 Journal of Geographic Information System
1. Introduction
Long-term monitoring programs can provide information on water-quality changes caused by population growth, large infrastructure projects, and in-creased industrial activity [1] [2]. These anthropogenic activities may surpass the loading capacity of a system, resulting in environmental degradation. Yet, in or-der to be effective, monitoring programs need to be carefully designed and tho-rough. Simply drawing samples from a system does not always take spatial varia-tions into account, and interpolation frequently fails to give a realistic or com-prehensive picture of the spatial processes [3]. To overcome these pitfalls, re-mote sensing techniques have proved useful, to fill in the gaps between sampling sites [4].
The application of remote sensing to evaluate water quality began in the early 1970s, and was based on the concept that light backscattering changes as a func-tion of the presence of different substances in the water [5] [6]. Later, Miller, Cruise [4] showed that the application of algorithms to the strength of the re-mote sensor signals, pixel by pixel, would allow the quantification of the amount of suspended particulate matter in the water. In their work, they were able to ca-librate the values with simultaneous measurements, using oceanographic pro-cedures. Following on their work, international cooperation efforts like the Ocean Color European Archive Network (the OCEAN project) [7] were shown to be useful in the identification of relationships between water components and remote sensor signals.
The validation of remote sensing data has been the subject of various research programs (e.g.: Hakvoort, de Haan [8]), showing that in many situations, con-centrations of phytoplankton pigments and turbidity could be adequately esti-mated from multi-band satellite images. Many different satellite sensors have been used for the purpose of estimating water quality; for example, various ver-sions of the Landsat satellite system have been applied [9] [10] [11]. But the most commonly used sensor is MODIS (Moderate Resolution Imaging Spectro-radiometer), installed aboard the Terra and Aqua satellites; it is capable of ob-taining enough images to cover the entire surface of the earth every one or two days [12] [13]. The main limitation of MODIS is its resolution (images consist of 250-m pixels), which, although suitable for many large-scale applications [14], is not always sufficient for more detailed studies. Recently, however, Fu, Xu [15] showed that, depending on the needed scale, MODIS images can be spatially downscaled with Landsat 8 images.
DOI:10.4236/jgis.2019.115031 502 Journal of Geographic Information System not identify any work relating water quality, rainfall and large dimension devel-opments in the drainage basin altogether.
An earlier study [19] evaluated variations in the water quality of a small drai-nage basin in Southeast Brazil, and observed the extreme influence of one rafall event, but hourly sampling showed that early in the morning, when local in-habitants had not yet begun their daily activities, human inputs were insignifi-cant. Later in the day, human-induced inputs increased. Then, at night, water quality improved again. These authors showed that the rapid response of the water system to human activities was attributable to the small size of the drai-nage basin (a few square kilometers), where heavy rains promote immediate in-crease in discharge rates. It is also interesting to note that, in addition to drai-nage basin size, draidrai-nage network structure, spatial distribution of land use, ba-sin storage capacity in urban and rural soils, and storm-water retention ponds also influence the discharge rates [20], which in turn affect the water quality of the ocean just off the coast. Nevertheless, the amount of rain in a drainage basin always exerts a heavy influence on water quality, and graphs of monthly or weekly rainfall patterns are extremely useful for supplementing water-quality data from remote sensing images.
In the present research, the evolution of the water quality along the northern coast of São Paulo State, Brazil, was evaluated based on satellite (Acqua) images (MODIS) from 2005 to 2017, taking into account the additional influence of large infrastructure projects recently constructed in the region (since 2005), population increases, and rainfall events. The association of these parameters as explaining elements for the water quality determined by satellite images is a new approach for a better understanding of the factors that control concentrations of chlorophyll a and turbidity. Regardless the fact that images provide 35 spectral bands that are capable of displaying a number of water quality parameters, these two elements were chosen as indicators, because they are good indicators and, because they are reliably mapped from satellite images.
2. Materials and Methods
2.1. The Study Area
DOI: 10.4236/jgis.2019.115031 503 Journal of Geographic Information System
Figure 1. Location of the study area, indicating the 4 municipalities of the coastal region. Stars represent the meteorological stations whose data were used to construct an isohyet map. Black circles indicate stations whose data were used to construct the pluviometry graphs.
Because of access limitations, human occupation of the north coast of São Paulo was not prioritized during the nineteenth or twentieth centuries. Howev-er, near the end of the 1960s, the construction of the maritime terminal Tebar in the city of São Sebastião led to fast-paced industrial development in that city. In the early 1980s the SP-55 road (presently BR-101) was constructed, creating easy land transportation access to the area [22]. The well-preserved forest and attrac-tive recessed beaches drew tourism activity, and the area began to be significant-ly developed for recreation, mainsignificant-ly in Ilhabela and Ubatuba [23], causing con-flicts with the industries and petroleum facilities that had recently been installed.
DOI:10.4236/jgis.2019.115031 504 Journal of Geographic Information System
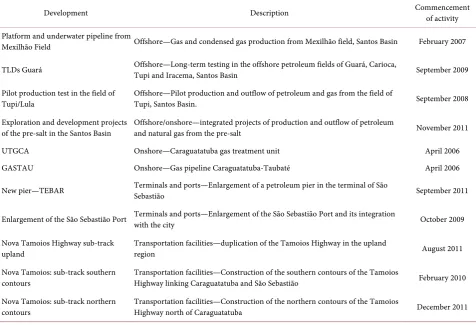
Table 1. Large new developments installed along the north coast of São Paulo (since 2005) that have significantly impacted the area. The developments are divided into petroleum facilities (onshore and offshore), terminals and ports, and transportation facil-ities.
Development Description Commencement of activity Platform and underwater pipeline from
Mexilhão Field Offshore—Gas and condensed gas production from Mexilhão field, Santos Basin February 2007 TLDs Guará Offshore—Long-term testing in the offshore petroleum fields of Guará, Carioca,
Tupi and Iracema, Santos Basin September 2009 Pilot production test in the field of
Tupi/Lula
Offshore—Pilot production and outflow of petroleum and gas from the field of
Tupi, Santos Basin. September 2008 Exploration and development projects
of the pre-salt in the Santos Basin
Offshore/onshore—integrated projects of production and outflow of petroleum
and natural gas from the pre-salt November 2011 UTGCA Onshore—Caraguatatuba gas treatment unit April 2006 GASTAU Onshore—Gas pipeline Caraguatatuba-Taubaté April 2006 New pier—TEBAR Terminals and ports—Enlargement of a petroleum pier in the terminal of São Sebastião September 2011
Enlargement of the São Sebastião Port Terminals and ports—Enlargement of the São Sebastião Port and its integration with the city October 2009 Nova Tamoios Highway sub-track
upland
Transportation facilities—duplication of the Tamoios Highway in the upland
region August 2011
Nova Tamoios: sub-track southern contours
Transportation facilities—Construction of the southern contours of the Tamoios
Highway linking Caraguatatuba and São Sebastião February 2010 Nova Tamoios: sub-track northern
contours Transportation facilities—Construction of the northern contours of the Tamoios Highway north of Caraguatatuba December 2011
might be expected. Regional population growth was significant in the decades of the 1990s and 2000s, reaching 44% in the former period and 22% in the second [26].
2.2. Pluviometric Survey
Rainfall data were obtained from various meteorological stations within the
region (stars in Figure 1) reported in the National Agency of Waters
(ANA-Hidroweb), enabling the construction of an isohyet map of rainfall distri-bution. Three meteorological stations (black circles in Figure 1) were selected to analyze the variations during the period 2005-2017. No station in the municipal-ity of Ilhabella was included because they were all located very close to the São Francisco Station in the Municipality of São Sebastião. Rainfall was displayed in monthly line graphs to give a better overview of the variations within this period.
2.3. Chlorophyll a and Turbidity from Satellite Imagery
in-DOI: 10.4236/jgis.2019.115031 505 Journal of Geographic Information System stalled in the satellite Aqua (originally known as EOS PM-1). The acquired im-ages provide 35 spectral bands that can be treated to evaluate many aspects of the surface of the water, including concentrations of chlorophyll a and water turbidity. These images were obtained from the site “Ocean Color Browse” (https://oceancolor.gsfc.nasa.gov/cgi/browse.pl?sen=am). Images displaying chlorophyll a concentrations and water turbidity in a day with little cloud cover were chosen for each period, downloaded and analyzed using the software “SeaDAS7.4”. The final maps were prepared in the environment “ArcMap” using the software “ARCGIS 10.2”. In the summers of 2007 and 2012, the images were inadequate (due to cloud cover) and could not be used.
3. Results and Discussion
3.1. Climatic Conditions during the Study
De Souza Rolim, Paes de Camargo [27] showed that the climate in the north coast area of São Paulo is tropical, with extremely wet summers and dry winters (type Am, after the classification of Köppen). The average rainfall over 70 years of measurements at the São Francisco Station (São Sebastião; black circle in Fig-ure 1) was 1197.1 mm, while at the CEEPAM station (Caraguatatuba; black cir-cle in Figure 1), the value was 2027.9 mm and in Ubatuba (black circir-cle in Figure 1), it was 2253.6. This significant southwest-to-northeast rainfall gradient is represented in the isohyet map (Figure 2). These differences are probably asso-ciated with orographic processes, because the elevated areas in the northeast are steeper than those in the southeast. It has to be emphasized that vegetation cover in the north is denser, and higher pluviosity should not result in higher concen-trations of suspended matter (turbidity), as will be discussed further here.
[image:6.595.208.539.513.696.2]The results of monthly rainfall data from 2005 to 2017 are represented in the graphs of Figure 3, for the stations São Francisco (São Sebastião), CEEPAM (Caraguatatuba) and Ubatuba (Ubatuba). It is possible to identify periods of very
DOI:10.4236/jgis.2019.115031 506 Journal of Geographic Information System
Figure 3. Monthly variation in rainfall during the period 2005-2017 in the stations of São Francisco (municipality of São Sebas-tião), CEEPAM (municipality of Caraguatatuba) and Ubatuba (municipality of Ubatuba). See Figure 1 for the position of each station (black circles).
strong rainfall activity during the summers of 2011 and 2013 in the stations CEEPAM (Caraguatatuba) and Ubatuba. During the spring of 2009 and the summer of 2011 very high values were registered in Ubatuba. High values were also observed in CEEPAM (Caraguatatuba) in October 2008. The highest monthly values for the municipalities of Caraguatatuba and Ubatuba reached 500 mm, while in São Sebastião, the highest values never exceeded 400 mm. The years 2009, 2010, 2011 and 2013 also registered excessive rainfall in other areas of southeast Brazil; these were probably associated with more intense El Niño phenomena [28].
3.2. Chlorophyll a and Turbidity in the North Coast Area of São Paulo
In the present work 26 images (dry and wet seasons from 2005 to 2017 inclusive) were prepared, displaying the parameter chlorophyll a, with another 26 images displaying the parameter turbidity. A complementary sample set of images is presented in the appendix A (A1 to A9).
Among the parameters that may control intensity of chlorophyll a production, the provision of nutrients is relevant and associated with wet-season (summer) tourism activity in the region [29]. Sunlight incidence is also important for pri-mary chlorophyll a production and is expected to be more intense in the wet 0 100 200 300 400 500 600 700 Jan -05 Se p-05 Ma y-06 Jan -07 O ct -07 Jun -08 Fe b-09 O ct -09 Jul -10 Ma r-11 N ov -11 Jul -12 Ma r-13 De c-13 Aug -14 Apr -15 De c-15 Aug -16 Ma y-17 Ra in fa ll ( m m )
São Francisco - Station 2345057
0 100 200 300 400 500 600 700 Jan -05 Jul -05 Jan -06 Jul -06 Jan -07 Jul -07 Jan -08 Jul -08 Jan -09 Jul -09 Jan -10 Jul -10 Jan -11 Jul -11 Jan -12 Jul -12 Jan -13 Jul -13 Jan -14 Jul -14 Jan -15 Jul -15 Jan -16 Jul -16 Jan -17 Ra in fa ll ( m m )
CEEPAM - Station 2345191
0 100 200 300 400 500 600 700 Fe b-06 Aug -06 Fe b-07 Aug -07 Fe b-08 Aug -08 Fe b-09 Aug -09 Fe b-10 Aug -10 Fe b-11 Aug -11 Fe b-12 Aug -12 Fe b-13 Aug -13 Fe b-14 Aug -14 Fe b-15 Aug -15 Fe b-16 Aug -16 Ra in fa ll ( m m )
DOI: 10.4236/jgis.2019.115031 507 Journal of Geographic Information System season (summer). On the other hand, the transparency of the water is very im-portant because less turbid water allows more light to penetrate, increasing water primary production [30], so that in the dry season (winter), although lower nu-trient concentrations are expected, higher primary production may result from water transparency. Finally, higher volumes of water entering the system (as in the wet season) may dilute concentrations of chlorophyll a [19].
[image:8.595.233.507.294.679.2]For chlorophyll a, the analysis of the whole image sequence (since 2005) indi-cates that in the wet season primary production is less intense than in the dry season (Figure 4 shows the dry and wet seasons for the year 2010). This beha-vior indicates that although the provision of nutrients and the intensity of sun-light are expected to be higher during the wet season (summer), it is probable that strong water dilution hinders primary production. In Figure 3, for all sta-tions, it can be observed that the dry-period (from May to September) rainfall is about one third that of the wet-period amounts. However, Figure 5 shows that
Figure 4. Chlorophyll a concentration (in mg∙m−3 = μg∙L−1) along the north coast of São
DOI:10.4236/jgis.2019.115031 508 Journal of Geographic Information System
Figure 5. Turbidity (qualitative approach) along the north coast of São Paulo. Image on left is from the wet season (February) of 2010 and image on right from the dry season (June) of 2010.
the results of turbidity (also for the year 2010) did not show the expected higher values during the wet season, indicating that dilution from higher rainfall is more important than other influences. This trend was similar for all the other years.
DOI: 10.4236/jgis.2019.115031 509 Journal of Geographic Information System
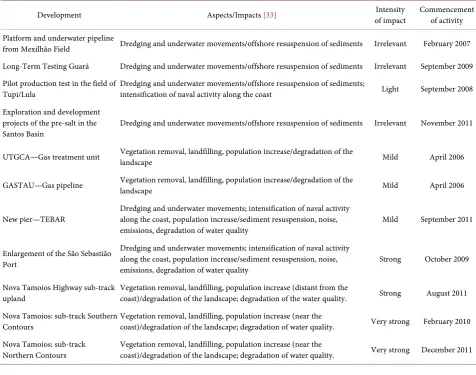
Table 2. Main impacts of development projects, their intensities and the periods when the activity began.
Development Aspects/Impacts [33] of impact Intensity Commencement of activity
Platform and underwater pipeline
from Mexilhão Field Dredging and underwater movements/offshore resuspension of sediments Irrelevant February 2007 Long-Term Testing Guará Dredging and underwater movements/offshore resuspension of sediments Irrelevant September 2009 Pilot production test in the field of
Tupi/Lula
Dredging and underwater movements/offshore resuspension of sediments;
intensification of naval activity along the coast Light September 2008 Exploration and development
projects of the pre-salt in the
Santos Basin Dredging and underwater movements/offshore resuspension of sediments Irrelevant November 2011 UTGCA—Gas treatment unit Vegetation removal, landfilling, population increase/degradation of the landscape Mild April 2006
GASTAU—Gas pipeline Vegetation removal, landfilling, population increase/degradation of the landscape Mild April 2006
New pier—TEBAR Dredging and underwater movements; intensification of naval activity along the coast, population increase/sediment resuspension, noise, emissions, degradation of water quality
Mild September 2011
Enlargement of the São Sebastião Port
Dredging and underwater movements; intensification of naval activity along the coast, population increase/sediment resuspension, noise,
emissions, degradation of water quality Strong October 2009 Nova Tamoios Highway sub-track
upland Vegetation removal, landfilling, population increase (distant from the coast)/degradation of the landscape; degradation of the water quality. Strong August 2011 Nova Tamoios: sub-track Southern
Contours
Vegetation removal, landfilling, population increase (near the
coast)/degradation of the landscape; degradation of water quality. Very strong February 2010 Nova Tamoios: sub-track
Northern Contours Vegetation removal, landfilling, population increase (near the coast)/degradation of the landscape; degradation of water quality. Very strong December 2011
production of chlorophyll a is clearly verifiable from the images in the dry sea-sons of 2007 and 2012 (Figure 6), indicating a population increase as the source of increased inputs of nutrients. Observations from all the years, sampled in the Supplementary Material, clearly corroborate this trend. However, the year 2017 was an exception, when the concentrations significantly decreased. Based on the parameters we considered in this article, it is not possible to explain this phenomenon environmental improvement. Considering that the images are in-stantaneous pictures of the different situation, it is possible that other factors like exceptional oceanic currents (not considered in the present article) influenced water quality in the year 2017. Although there is no indications of the presence of oceanic waters in the study area, Paloczy, Brink [31] observed the intrusion of the South Atlantic Central Water (SACW) om the continental shelf of the Espi-rito Santo Basin, farther North of the study area.
DOI:10.4236/jgis.2019.115031 510 Journal of Geographic Information System
Figure 6. Chlorophyll a concentration (in mg∙m−3 = μg∙L−1) along the north coast of São
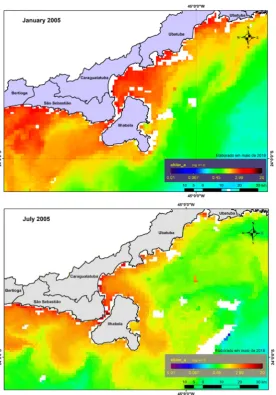
DOI: 10.4236/jgis.2019.115031 511 Journal of Geographic Information System
Figure 7. Turbidity (qualitative approach) along the north coast of São Paulo. Image on left is from the dry season (July) of 2005 and image on right from the dry season (July) of 2013.
the most impacting development, the turbidity was low. It is probable that, re-gardless of whether the most impacting development promoted the resuspension of sediments and the intensification of erosion in the continent, the region pre-sented a well-preserved vegetation cover, particularly in the eastern portion [32]. This vegetation cover hinders any long-term increase in turbidity in the region.
4. Conclusions
Various parameters seem to control chlorophyll a in the water column of the north coast of São Paulo including provision of nutrients (associated with popu-lation increase and tourism). The transparency (depending on turbidity) of the water also contributes to the primary production by increasing the intensity of sunlight incidence also depending on the season. The volume of rainwater en-tering the system that promotes dilution of the concentrations also seems to be important. The occurrence of higher concentrations of chlorophyll a in the dry season (winter) is unexpected, because this period has less tourism activity, less incidence of sunlight and higher turbidity. Therefore, the dilution promoted by intense rainfall during the wet season (summer) is more effective in reducing primary production than all the other parameters, along the north coast of São Paulo.
DOI:10.4236/jgis.2019.115031 512 Journal of Geographic Information System Images of turbidity along the north coast of São Paulo show that dilution from heavy rainfall in the wet season (summer) also controls this parameter in the water column. Most of the images show a higher turbidity in the dry season (winter) than in the wet season (summer), except for the years 2005 and 2009. Nevertheless, no temporal trends in turbidity could be observed from 2005 to 2017. After the installation of the most impacting developments during 2009-2011 no consistent or relevant increase in turbidity could be identified. Apparently, the preservation of the vegetation cover along the north Coast of São Paulo, and particularly in the eastern portion of the region, hinders increases in turbidity due to impacting developments like dredging and landfilling.
Finally, it is interesting to highlight some limitations of the research. First, al-though satellite images of the chlorophyll a and turbidity have been largely cali-brated in many studies, the fact that we did not calibrate the results with real samples is a limitation, because the color response of the images may be differ-ent in distinct locations. Second, the interpretation of the results with other pa-rameters like position of oceanic waters may be important, as discussed on the results of the year 2017. Unfortunately, the temporal behavior of oceanic cur-rents in the southeast Brazil is poorly known and further studies are necessary. Third, it would be very helpful to compare the results of images with other bio-geochemical parameters, like salinity, pH, redox potential, dissolved oxygen and freshwater discharges. Some of these parameters like salinity can also be esti-mated by satellite imaging, while others have to be measured in situ.
Acknowledgements
The authors are grateful to Nemus Ltd. for financial support. JCW is also grate-ful to the Brazilian Council of Scientific and Technological Development (CNPq) for a research grant (grant # 306714/2013-2). PB is also grateful to CAPES for financial support (grant # 001). These financial supports do not imply any sort of bias in the results or their interpretation.
Conflicts of Interest
The authors declare no conflicts of interest regarding the publication of this paper.
References
[1] Kohli, P., Siver, P.A., Marsicano, L.J., Hamer, J.S. and Coffin, A.M. (2017) Assess-ment of Long-Term Trends for ManageAssess-ment of Candlewood Lake, Connecticut, USA. Lake and Reservoir Management, 33, 280-300.
https://doi.org/10.1080/10402381.2017.1335812
[2] Paterson, A.M., Ruhland, K.M., Anstey, C.V. and Smol, J.P. (2017) Climate as a Driver of Increasing Algal Production in Lake of the Woods, Ontario, Canada. Lake
and Reservoir Management, 33, 403-414.
https://doi.org/10.1080/10402381.2017.1379574
DOI: 10.4236/jgis.2019.115031 513 Journal of Geographic Information System T.B., et al. (2019) Science Meets Policy: A Framework for Determining Impairment Designation Criteria for Large Waterbodies Affected by Cyanobacterial Harmful Algal Blooms. Harmful Algae, 81, 59-64.https://doi.org/10.1016/j.hal.2018.11.016 [4] Miller, R.L., Cruise, J.F., Otero, E. and Lopez, J.M. (1994) Monitoring Suspended
Particulate Matter in Puerto-Rico—Field-Measurements and Remote Sensing.
Journal of the American Water Resources Sources Association, 30, 271-282.
https://doi.org/10.1111/j.1752-1688.1994.tb03290.x
[5] Kirk, J.T.O. (1994) Light and Photosynthesis in Aquatic Ecosystems. 2nd Edition, Cambridge University Press, Cambridge.
https://doi.org/10.1017/CBO9780511623370
[6] Jerlov, N.G. (1976) Marine Optics. Elsevier Oceanography Series, Elsevier, Amster-dam, 230.
[7] Barale, V., Larkin, D., Fusco, L., Melinotte, J.M. and Pittella, G. (1999) Ocean Project: The European Archive of CZCS Historical Data. International Journal of
Remote Sensing, 20, 1201-1218.https://doi.org/10.1080/014311699212696
[8] Hakvoort, H., de Haan, J., Jordans, R., Vos, R., Peters, S. and Rijkeboer, M. (2002) Towards Airborne Remote Sensing of Water Quality in the Netherlands: Validation and Error Analysis. ISPRS Journal of Photogrammetry and Remote Sensing, 57, 171-183.https://doi.org/10.1016/S0924-2716(02)00120-X
[9] Kabbara, N., Benkhelil, J., Awad, M. and Barale, V. (2008) Monitoring Water Qual-ity in the Coastal Area of Tripoli (Lebanon) Using High-Resolution Satellite Data.
ISPRS Journal of Photogrammetry and Remote Sensing, 63, 488-495.
https://doi.org/10.1016/j.isprsjprs.2008.01.004
[10] Snyder, J., Boss, E., Weatherbee, R., Thomas, A.C., Brady, D. and Newell, C. (2017) Oyster Aquaculture Site Selection Using Landsat 8-Derived Sea Surface Tempera-ture, Turbidity, and Chlorophyll a. Frontiers in Marine Science, 4, 190.
https://doi.org/10.3389/fmars.2017.00190
[11] Erkkila, A. and Kalliola, R. (2004) Patterns and Dynamics of Coastal Waters in Multi-Temporal Satellite Images: Support to Water Quality Monitoring in the Arc-hipelago Sea, Finland. Estuarine, Coastal and Shelf Science, 60, 165-177.
https://doi.org/10.1016/j.ecss.2003.11.024
[12] Kim, H.C., Son, S., Kim, Y.H., Khim, J.S., Nam, J., Chang, W.K., et al. (2017) Re-mote Sensing and Water Quality Indicators in the Korean West Coast: Spa-tio-Temporal Structures of MODIS-Derived Chlorophyll-a and Total Suspended Solids. Marine Pollution Bulletin, 121, 425-434.
https://doi.org/10.1016/j.marpolbul.2017.05.026
[13] Biswas, S.N., Rakshit, D., Sarkar, S.K., Sarangi, R.K. and Satpathy, K.K. (2014) Im-pact of Multispecies Diatom Bloom on Plankton Community Structure in Sundar-ban Mangrove Wetland, India. Marine Pollution Bulletin, 85, 306-311.
https://doi.org/10.1016/j.marpolbul.2014.04.015
[14] Chen, S.S., Han, L.S., Chen, X.Z., Li, D., Sun, L. and Li, Y. (2015) Estimating Wide Range Total Suspended Solids Concentrations from MODIS 250-m Imageries: An Improved Method. ISPRS Journal of Photogrammetry and Remote Sensing, 99, 58-69.https://doi.org/10.1016/j.isprsjprs.2014.10.006
[15] Fu, Y.Z., Xu, S.G., Zhang, C.K. and Sun, Y. (2018) Spatial Downscaling of MODIS Chlorophyll-a Using Landsat 8 Images for Complex Coastal Water Monitoring.
Es-tuarine, Coastal and Shelf Science, 209, 149-159.
https://doi.org/10.1016/j.ecss.2018.05.031
DOI:10.4236/jgis.2019.115031 514 Journal of Geographic Information System and Ecoregion Effects on Fish Assemblage Structure in Tributaries of the Rio Pa-raiba do Sul, Brazil. Freshwater Biology, 54, 2600-2615.
https://doi.org/10.1111/j.1365-2427.2009.02269.x
[17] Page, B.P., Kumar, A. and Mishra, D.R. (2018) A Novel Cross-Satellite Based As-sessment of the Spatio-Temporal Development of a Cyanobacterial Hatinful Algal Bloom. International Journal of Applied Earth Observation and Geoinformation, 66, 69-81.https://doi.org/10.1016/j.jag.2017.11.003
[18] Li, Y., Zhang, Y.L., Shi, K., Zhou, Y.Q., Zhang, Y.B., Liu, X.H., et al. (2018) Spati-otemporal Dynamics of Chlorophyll-a in a Large Reservoir as Derived from Landsat 8 OLI Data: Understanding Its Driving and Restrictive Factors. Environmental
Science and Pollution Research, 25, 1359-1374.
https://doi.org/10.1007/s11356-017-0536-7
[19] Souza, N.M. and Wasserman, J.C. (1996) Diurnal Variation of Anionic Surfactants and Forms of Phosphorus in a Polluted Stream (Piratininga, Rio de Janeiro, Brazil).
Toxicological & Environmental Chemistry, 55, 173-181.
https://doi.org/10.1080/02772249609358333
[20] Wright, D.B., Smith, J.A., Villarini, G. and Baeck, M.L. (2012) Hydroclimatology of Flash Flooding in Atlanta. Water Resources Research, 48.
https://doi.org/10.1029/2011WR011371
[21] Suguio, K. and Martin, L. (1978) Quaternary Marine Formations of the State of São Paulo and Southern Rio de Janeiro. Conference Quaternary Marine Formations of
the State of São Paulo and Southern Rio de Janeiro, Sao Paulo, 11-18 September
1978, 55.
[22] Borelli, E. (2015) Dinâmica urbana e degradação ambiental do Litoral Norte Paulista, II Simpósio Internacional de Gestão de Projetos/Simpósio Internacional de Inovação e Sustentabilidade São Paulo, SP, Uninove. 1-17.
[23] Luchiari, M.T.D. (2002) Turismo e cultura caiçara no Litoral Norte paulista. In: Rodrigues, A.B., Ed., Turismo e desenvolvimento local, Hucitec, São Paulo, 136-154.
[24] Binsztok, J., Wasserman, J. and Romeu, T. (2010) Visibilidade e (In)visibilidade Construídas pelos “Dragões” da Exploração e Produção de Petróleo em Macaé—RJ. Anais XVI Encontro Nacional dos Geógrafos: Crise, práxis e autonomia: Espaços de resistência e de esperanças—Espaço de Socialização de Coletivos, Porto Alegre, RS, Associação dos Geógrafos Brasileiros, 1-7.
[25] Binsztok, J., Wasserman, J.C. and Romeu, T. (2010) Restruturação produtiva, modificações sócio-espaciais e exploração de petróleo no Brasil: O caso de Macaé, RJ. XI Coloquio Internacional de Geocritica. contrib. 102. Sociedade Internacional de Geocrítica, Facultad de Filosofía y Letras (Universidad de Buenos Aires), Buenos Aires, Argentina, 2-7 May 2010, 1-10.
[26] IBGE (2010) Demographic census 2010. Instituto Brasileiro de Geografia e Estatística—Comitê de Estatísticas Sociais, Brasília.
[27] de Souza Rolim, G., Paes de Camargo, M.B., Grosseli Lania, D. and Leite de Moraes, J.F. (2007) Classificação climática de Köppen e de Thornthwaite e sua aplicabilidade na determinação de zonas agroclimáticas para o estado de São Paulo. Bragantia, 66, 711-720.https://doi.org/10.1590/S0006-87052007000400022
[28] Carranzano, J., de€Jesús, T.L., Matías, F. and Wasserman, J.C. (2018) The Influence of Climate Change on the Intensity and Distribution of Rain in Four Rio de Janeiro (Brazil) Weather Stations. Ambiência, 14, 140-153.
DOI: 10.4236/jgis.2019.115031 515 Journal of Geographic Information System urbano e áreas de risco no litoral norte de São Paulo. Revista Brasileira de Estudos
de População, 30, 35-56.https://doi.org/10.1590/S0102-30982013000100003
[30] Bouillon, S., Abril, G., Borges, A.V., Dehairs, F., Govers, G., Hughes, H.J., et al. (2009) Distribution, Origin and Cycling of Carbon in the Tana River (Kenya): A Dry Season Basin-Scale Survey from Headwaters to the Delta. Biogeosciences, 6, 2475-2493.https://doi.org/10.5194/bg-6-2475-2009
[31] Paloczy, A., Brink, K.H., da Silveira, I.C.A., Arruda, W.Z. and Martins, R.P. (2016) Pathways and Mechanisms of Offshore Water Intrusions on the Espirito Santo Ba-sin Shelf (18 Degrees S-22 Degrees S, Brazil). Journal of Geophysical Research:
Oceans, 121, 5134-5163.https://doi.org/10.1002/2015JC011468
[32] Batista, S.S. (2016) Avaliação dos efeitos de ações antrópicas sobre o sistema costeiro de Ubatuba (SP) através de modelagem ambiental. Dissertation, USP, São Paulo.
DOI:10.4236/jgis.2019.115031 516 Journal of Geographic Information System
[image:17.595.237.514.91.487.2]Appendix A
DOI: 10.4236/jgis.2019.115031 517 Journal of Geographic Information System
Figure A2. Satellite image of Chlorophyll a. January and June 2011.
[image:18.595.232.519.301.701.2]DOI:10.4236/jgis.2019.115031 518 Journal of Geographic Information System
Figure A4. Satellite image of Chlorophyll a. February and July 2017.
[image:19.595.234.524.507.705.2]DOI: 10.4236/jgis.2019.115031 519 Journal of Geographic Information System
DOI:10.4236/jgis.2019.115031 520 Journal of Geographic Information System
Figure A7. Satellite image of Turbidity. January and June 2011.
[image:21.595.234.517.307.706.2]DOI: 10.4236/jgis.2019.115031 521 Journal of Geographic Information System