doi:10.4236/msa.2011.28132 Published Online August 2011 (http://www.SciRP.org/journal/msa)
Application of Statistical Design Strategies to
Optimize the Preparation of CuO Nanoparticles by
Hydrothermal Technique
Reda Mohamed1,2*, Ibreheem Mkhalid1, Elham Azaam1
1Chemistry Department, Faculty of Science, King Abdulaziz University, Jeddah, KSA; 2Central Metallurgical R&D Institute, CMRDI, Cairo, Egypt.
Email: *[email protected]
Received January 23rd, 2011; revised March 10th, 2011; accepted June 7th, 2011.
ABSTRACT
Synthesis of CuO nanoparticles by hydrothermal technique in presence of cetyltrimethylammonium bromide (CTAB) as surfactant was carried out by statistically designed experiments based on Box Behnken method. Reaction parameters as time, temperature and surfactant concentration have been studied to show their effect on CuO particle size and mor-phology. The results of experimental design indicate that the surfactant concentration, reaction time and temperature were significant in CuO particles were characterized using XRD and SEM. These work findings showed that CuO na-noparticles were formed at 100˚C. On other hand, their crystallinity was improved with rising temperature from 100 to
200˚C to achieve particle size of CuO in the range of 49 - 92 nm.
Keywords:Statistical Design, CuO, Nanoparticles, Surfactant, Hydrothermal
1. Introduction
Nanocrystalline semiconductor particles have drawn considerable interest in recent years because of their spe-cial properties such as a large surface to-volume ratio, increased activity, special electronic properties and uniq- ue optical properties as compared to those of the bulk materials [1,2]. The oxides of transition metals are an important class of semiconductors, which have applica-tions in magnetic storage media, solar energy transfor-mation, electronics and catalysis [3-12]. Among the ox-ides of transition metals, CuO has attracted much atten-tion because it is the basis of several high-Tc supercon-ductors. CuO is a semiconducting compound with a nar-row band gap and used for photoconductive and photo-thermal applications [13]. However, up to now, the re-ports on the preparation and characterization of nano-crystalline CuO are relatively few contrariwise to other transition metal oxides such as zinc oxide, titanium di-oxide, tin dioxide and iron oxide. Recently methods for the preparation of nanocrystalline CuO have been re-ported as the sonochemical method [14], sol-gel tech-nique [15], one-step solid state reaction method at room temperature [16], electrochemical method [17], thermal decomposition of precursors [18], and co-implantation of
metal and oxygen ions [19], hydrothermal [20-22]. The optimum conditions and the interaction between the pa-rameters for preparation of CuO nanosized particles are not determined yet; in this work statistically designed experiments (Box Behnken method) have been per-formed to study the synthesis of nanoparticles CuO via a low-temperature hydrothermal technique with and with-out surfactant as a function of the surfactant concentra-tion, reaction time, and temperature.
2. Experimental
CuO nanoparticles were synthesized as follow: equal volume of Cu(NO3)2·3H2O and urea NaOH are mixed in
presence of a cetyltrimethylammonium bromide (0 - 5 m mol) at room temperature with magnetic stirring. Cu(OH)2
precipitate are formed instantaneously. The Cu(OH)2 pre-
cipitate was separated by decantation and washed by water several times. Suspension of Cu(OH)2
Application of Statistical Design Strategies to Optimize the Preparation of CuO Nanoparticles by Hydrothermal Technique 982
diffraction (XRD) patterns were conducted at room tem-perature (RT) using Bruker axs, D8 advance using Cu Kα
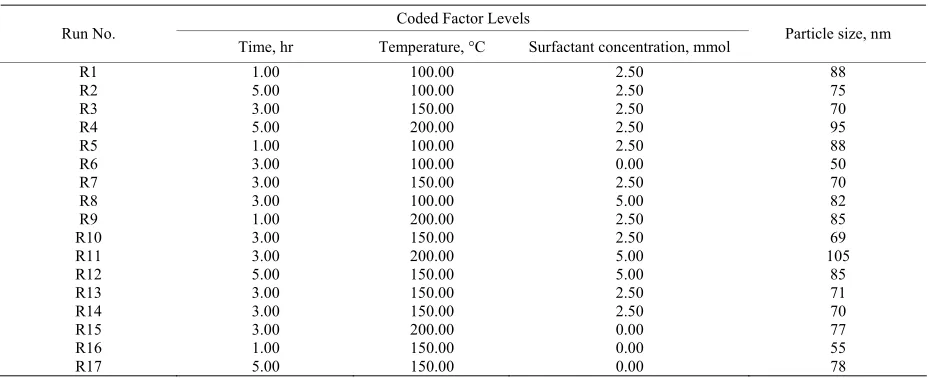
radiation at a wavelength 0.154 nm. Box Benhken ex-perimental design for the variables is shown Table 1.
Plots of the response surface, contours, and the best pre-dictive models for estimating the variable response were developed. The Box-Behnken design in Table 1 can fit
the following model [23];
0 3 3 31 i i 1 1 ij i j
i i j
E y x x x
(1)where y is the estimate of the response variable and Xi’s are the independent variables [surfactant concentration, time and temperature] that are known for each experi-mental run. The parameters β0, βi, and βij are the
regres-sion parameters.
3. Results and Discussions
In the precipitation and hydrothermal process, the CuO powders form by two reactions according to the follow-ing equations:
3
2 2Cu NO 2 NaOHCu(OH) +2 NaNO3
2
(2)
2
Cu(OH) Hydrothermal CuO+H O (3)
Copper nitrate reacts with sodium hydroxide to form copper hydroxide that needs to be converted into the de-sired CuO product by hydrothermal method. X-ray dif-fraction and SEM results confirm the crystallinity of CuO with a small primary crystal size below 70 nm, re-spectively. There are three variables for preparation of CuO nanoparticles via hydrothermal process: surfactant concentration, temperature and time. The optimum con-ditions using experimental design have been revealed.
3.1. Effect of Synthetic Variables on CuO Particles Size
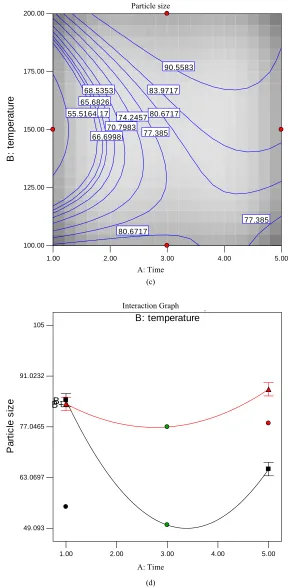
Figure 1 shows that the effect of reaction time and
tem-perature on CuO particle size (0, 2.5 and 5 mmol surfac-tant). The particles size was increased from 50 to 84 nm with increasing hydrothermal time from 1 to 5 hours in absence of surfactant as shown in Figure 1(a). Moreover,
we noticed that with increasing temperature from 100 - 200˚C the particles size increased from 64 to 84 nm after 3 hours. The lowest particle size, 49 nm, was achieved at low surfactant concentrations and temperature 125˚C. At 3 mmol surfactant concentration, the particles size growth was dependent on reaction time, (Figure 1(b)).
Moreover, the particles size increment can be performed with rising the reaction temperature. The contour shown in Figure 1(c), at 5 mmol surfactant concentration,
illus-trates that the particles size can be controlled through tuning reaction time and temperature. The surfactant ad-dition showed pronounceable influence on growth of CuO nanoparticle that can be followed by observing the particles size of sample prepared in absence and presence of surfactant. However the lowest particle size can be achieved at 150˚C for 1 hour without surfactant. Interac-tion graph for the particles size of CuO as a funcInterac-tion of temperature and time at 2.5 mmol surfactant concentra-tion is shown in Figure1(d). It reveals that the particles
size of sample prepared at 100˚C is much larger than 200˚. This unexpected behavior might be due to removal part of CTAB attached the Cu(OH)2 surface during washing
step the before the hydrothermal treatment. Surfactant concentration, temperature and time have a significant role for reducing CuO particle size.
[image:2.595.66.530.518.707.2]All the experimental data was collected at the 3-D cu-
Table 1. Experimental Box Behnken Design with the 3 levels and 3 variables utilized in the experiment.
Coded Factor Levels Run No.
Time, hr Temperature, °C Surfactant concentration, mmol Particle size, nm
R1 1.00 100.00 2.50 88
R2 5.00 100.00 2.50 75
R3 3.00 150.00 2.50 70
R4 5.00 200.00 2.50 95
R5 1.00 100.00 2.50 88
R6 3.00 100.00 0.00 50
R7 3.00 150.00 2.50 70
R8 3.00 100.00 5.00 82
R9 1.00 200.00 2.50 85
R10 3.00 150.00 2.50 69
R11 3.00 200.00 5.00 105
R12 5.00 150.00 5.00 85
R13 3.00 150.00 2.50 71
R14 3.00 150.00 2.50 70
R15 3.00 200.00 0.00 77
R16 1.00 150.00 0.00 55
Particle size
B
: t
em
p
er
at
ur
e
1.00 2.00 3.00 4.00 5.00
100.00 125.00 150.00 175.00 200.00
64.2117
64.2117
70.7983
70.7983 77.385 77.385
83.9717
49.4758
55.5164
55.5164
A: Time
(a)
Particle size
B
: t
em
p
er
at
ur
e
1.00 2.00 3.00 4.00 5.00
100.00 125.00 150.00 175.00 200.00
64.2117
70.7983
70.7983
77.385
77.385 83.9717
90.5583
65.6826 66.6998
68.5353
74.2457
74.2457 80.6717
5 5 5 5 5
A: Time
Application of Statistical Design Strategies to Optimize the Preparation of CuO Nanoparticles by Hydrothermal Technique 984
Particle size
B
: t
em
p
er
at
ur
e
1.00 2.00 3.00 4.00 5.00
100.00 125.00 150.00 175.00 200.00
64.2117
70.7983 77.385
77.385 83.9717
90.5583
55.5164 65.6826
66.6998 68.5353
74.2457
80.6717 80.6717
A: Time (c)
Interaction Graph
B: temperature
p
P
a
rt
icl
e
si
ze
1.00 2.00 3.00 4.00 5.00 49.093
63.0697 77.0465 91.0232 105
B-B+
A: Time
(d)
[image:4.595.147.437.84.671.2]bic as shown in Figure 4.The data revealed that particles
size was ranged from 65 to 92 nm. At low temperature, 100˚C, and long reaction time without surfactant, the par-ticle size was 65 nm. Rising temperature to 200˚C the par-ticles size increased to 83 nm. On the other hand, at low temperature and short reaction time without surfactant the particle size was 88 nm. With rising temperature to 200˚C and surfactant concentration to 5mmol, the particles size was increased to 92 nm. Under such conditions, low sur-factant concentration would be desirable for less aggrega-tion.
The diagnostic results provide plot that can be used to analyze the data, which is plot of predicted values as a function of experimentally observed values for the parti-cle size of CuO when the surfactant concentration, time and temperature are changed. These plot show that there is a linear relationship between the experimentally ob-served and predicted values from the model, and also that the differences between observed and predicted values are in the range of ± 1%. These indicate that experiments were conducted well and the results are not carrying any significant error. Also the standard deviation was 0.71 and R2 0.9994.
3.2. XRD Patterns
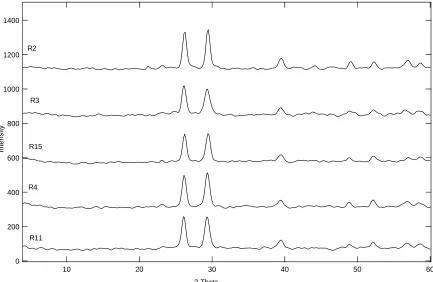
The XRD patterns of five CuO powders were determined and similar results were obtained. Here, R2, R3, R11 and
Cube Graph
Particle size
A: Time
B
: t
e
m
p
erat
ure
C: surfactant concentrati
A- A+
B-B+
C-C+
84.37
81.37 83.38
76.38
65.37
74.37 87.38
92.38
Figure 2. 3-D plot for all experimental data.
R15 were selected as an example to reveal the effect of temperature and surfactant concentration on the XRD patterns as shown in Fiure 3. There are no noticeable
changes in the crystallographic patterns and intensity ratios among peaks. But, a clear sharpening and attenua-tion of peaks can be observed with increasing the tem-perature. Pure CuO powder is formed only after hydro-
1400
1200
1000
800
600
400
200
0
60 50
40 30
20 10
R2
R3
R4
R11 R15
2-Theta
In
te
n
s
[image:5.595.312.537.86.281.2]ity
[image:5.595.82.515.417.699.2]Application of Statistical Design Strategies to Optimize the Preparation of CuO Nanoparticles by Hydrothermal Technique 986
R15 R4
[image:6.595.150.475.85.346.2]R11
Figure 4. SEM surface morphology of R4, R11 and R15.
thermal heating at 100˚C. In general, the peak sharpening in XRD patterns can be ascribed to the increasing of crystallite size. On other word, the increase in the inten-sity of diffraction peaks is attributed to the increase in the crystallinity of the obtained powder [24-25].
3.3. SEM Morphology
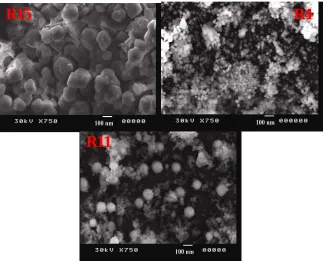
The SEM micrographs of CuO powder prepared at dif-ferent conditions are presented in Figure 4. R4, R11 and
R15 are selected to be representative samples for all dif-ferent conditions. At R15 without surfactant, particle shape of CuO powder is cubic. R4 and R11 with surfac-tant concentration of 2.5 and 5 mmol, the particle mor-phology are become spherical after surfactant addition. This means that, CTAB as surfactant is playing an im-portant role for modifying the particles morphology.
4. Conclusions
Statistically designed experiments based on Box Behnk- en method were achieved to synthesize CuO nanoparticle in presence CTAB as surfactant by hydrothermal tech-nique. CuO is formed only after hydrothermal heating at 100˚C. Compared to other method for synthesizing cop-per oxide powders, the reaction conditions are considera-bly moderate. It was found that, the surfactant concentra-tion, reaction time and temperature were significant in tuning the particle size. The morphology of CuO parti-cles was modified, from cubic structure to spherical one,
using CTAB surfactant. The particle sizes of the CuO pr- oduced are ranged from 49 to 92 nm.
REFERENCES
[1] B. J. Jin, S. H. Bae, S. Y. Lee and S. Im, “Effects of Na-tive Defects on Optical and Electrical Properties of Zno Prepared by Pulsed Laser Deposition,” Material Science Engeneerig B, Vol. 71, No. 1-3, 2000, pp. 301-305.
doi:10.1016/S0921-5107(99)00395-5
[2] P. Zu, Z. K. Tang, G. K. L. Wong, M. Kawasaki, A. Oh-tomo, H. Koinuma and Y. Segawa, “Ultraviolet Sponta-neous and Stimulated Emissions from zno Microcrystal-lite Thin Films at Room Temperature,” Solid State Com-mun, Vol. 103, No. 8, 1997, pp. 459.
doi:10.1016/S0038-1098(97)00216-0
[3] E. Ohshima, H. Ogino, I. Niikura, K. Maeda, M. Sato, M. Ito and T. Fukuda, “Growth of the 2-in-size Bulk ZnO single Crystals by the Hydrothermal Method,” Journal Crystal Growth, Vol. 260, No. 1-2, 2004, pp. 166-170.
doi:10.1016/j.jcrysgro.2003.08.019
[4] T. L. Yang, D. H. Zhang, J. Ma, H. L. Ma and Y. Chen, “Transparent Conducting ZnO: Al Films Deposited on Organic Substrates Deposited by r.f. Magnetron-Sputter- ing,” Thin Solid Films, Vol. 326, No. 1-2, 1998, pp. 60-62.
doi:10.1016/S0040-6090(98)00763-9
[5] B. Sang, A. Yamada and M. Konagai “Films for Solar Cells Grown by a Two-step Process with the Atomic Layer Deposition Technique,” Japanese Journal Applied Physics, Vol. 37, 1998, pp. 206-208.
[6] J. F. Cordaro, Y. Shim and J. E. May,” ““Bulk electron traps in zinc oxide varistors,” Journal Applied Physics, Vol. 60, No. 12, 1986, pp. 4186-4191. doi:10.1063/1.337504
[7] P. Verardi, N. Nastase, C. Gherasim, C. Ghica, M.Dinescu, R. Dinu and C. Flueraru, “Scanning force Microscopy and Electron Microscopy Studies of Pulsed Laser Deposited Zno Thin Films: Application to the Bulk Acoustic Waves (Baw) Devices,” Journal Crystal Growth, Vol. 197, No.3, 1999, pp. 523-528.
doi:10.1016/S0022-0248(98)00808-2
[8] X. Tang, E. Shi G. Choo, L. Li, J. Ding and J. M. Xue, “One-Pot Synthesis of Water-Stable ZnO Nanoparticles via a Polyol Hydrolysis Route and Their Cell Labeling Applications,” Langmuir, Vol. 25, No. 9, 2009, pp. 5271- 5275. doi:10.1021/la900374b
[9] I. Irzh, L. Genish, L. Klein, A. Solovyov and A. Ge-danken, “Synthesis of ZnO and Zn Nanoparticles in Mi-crowave Plasma and Their Deposition on Glass Slides,”
Langmuir, Vol. 26, No. 8, 2010, pp. 5976-5984.
doi:10.1021/la904499s
[10] Y. L. Zhang, Y. Yang, J. H. Zhao, R. Q. Tan, P. Cui and W. J. Song, “Preparation of ZnO Nanoparticles by a Sur-factant-Assisted Complex Sol-gel Method Using Zinc Ni-trate,” Journal of Sol-Gel Science and Technology, Vol. 51, No. 2, 2009, pp. 198-203.
doi:10.1007/s10971-009-1959-5
[11] S. M. Haile, D. W. Jonhagon, G. H. Wiserm, Aqueous “Precipitation of Spherical Zinc Oxide Powders for Va-ristor Applications,”Journal American Ceram Socience, Vol. 72, No. 10, 1989, pp. 2004-2008.
doi:10.1111/j.1151-2916.1989.tb06020.x
[12] C. H. Lu and C. H. Yeh, “Influence of Hydrothermal Conditions on the Morphology and Particle Size of Zinc Oxide Powder,” Ceramics International, Vol. 26, No. 4, 2000, pp. 351-357.
doi:10.1016/S0272-8842(99)00063-2