DOI: doi:10.1016/j.imavis.2017.09.007
Reference: IMAVIS 3651
To appear in: Image and Vision Computing
Received date: 15 November 2016
Revised date: 2 July 2017
Accepted date: 18 September 2017
Please cite this article as: Kasim Terzi´c, Sai Krishna, J.M.H. du Buf, Texture features
for object salience, Image and Vision Computing(2017), doi:10.1016/j.imavis.2017.09.007
ACCEPTED MANUSCRIPT
Texture features for object salience
Kasim Terzi´ca,c,∗, Sai Krishnab, J.M.H. du Bufc
aSchool of Computer Science, University of St Andrews, Scotland
bDepartment of Science and Technology, Centre for Applied Autonomous Sensor Systems, ¨Orebro University, Sweden cDepartment of Electronic Engineering and Computer Science, University of the Algarve, Portugal
Abstract
Although texture is important for many vision-related tasks, it is not used in most salience models. As a consequence, there are images where all existing salience algorithms fail. We introduce a novel set of texture features built on top of a fast model of complex cells in striate cortex, i.e., visual area V1. The texture at each position is characterised by the two-dimensional local power spectrum obtained from Gabor filters which are tuned to many scales and orientations. We then apply a parametric model and describe the local spectrum by the combination of two one-dimensional Gaus-sian approximations: the scale and orientation distributions. The scale distribution indicates whether the texture has a dominant frequency and what frequency it is. Likewise, the orientation distribution attests the degree of anisotropy. We evaluate the features in combination with the state-of-the-art VOCUS2 salience algorithm. We found that using our novel texture features in addition to colour improves AUC by 3.8% on the PASCAL-S dataset when compared to the colour-only baseline, and by 62% on a novel texture-based dataset.
Keywords: Texture, Colour, Salience, Attention, Benchmark
1. Introduction
The seminal work by Itti, Koch and Niebur [27, 26] included an orientation component from responses of oriented Gabor filters. However, since then, texture has largely been ignored in computational salience mod-els. Most recent work on salience has focused on the pop-out effect primarily caused by colour and intensity, and widely-used benchmarks in this field mostly fea-ture prominent, brightly coloured objects. Colour and intensity are undoubtedly very important cues, but tex-ture can also evoke a pop-out effect; see Fig. 1. Any observer immediately experiences the striking effect in the left image, but most state-of-the-art salience models will fail to identify the salient region. The remarkable success of these models on challenging datasets has un-fortunately led to a neglect of texture as an attentional cue.
∗
Corresponding author at: School of Computer Science, Univer-sity of St Andrews, Scotland
Email addresses:[email protected](Kasim Terzi´c),
[email protected](Sai Krishna),[email protected](J.M.H. du
Buf)
URL:kt54.host.cs.st-andrews.ac.uk(Kasim Terzi´c),
mpi.aass.oru.se/people/sai-krishna/(Sai Krishna),
w3.ualg.pt/~dubuf/(J.M.H. du Buf)
Figure 1: An example of texture salience. The textured region in the left image leads to a strong pop-out effect, despite it having the same average colour and intensity as the surrounding region. Blob detection based on colour therefore fails in this case (middle image). However, blob detection based on texture features, as described in this paper, detects the salient blob (right image).
In this paper, we revisit the Itti and Koch model and examine which types of features are well-suited to de-tecting salient regions on the basis of texture. We then propose a simple set of features on top of complex cells. We combine these features with the recent state-of-the-art VOCUS2 algorithm, which evolved from the Itti and Koch framework, in order to demonstrate the eff ective-ness of our approach. We evaluate our approach on a set of standard datasets, and on a novel dataset which specifically addresses texture.
We see this work as a first step towards a texture-based salience mechanism texture-based on a fast model of
ACCEPTED MANUSCRIPT
tical cells in V1 [54]. To the best of our knowledge,this is the first model of its kind, which can provide a baseline for further work in this area. We do not ex-pect that a purely texture-based approach will ever out-perform colour-based approaches. Rather, we are con-vinced that an additional salience channel can improve existing algorithms in situations where object and back-ground colours are similar.
2. Related Work
Visual salience has become one of the central top-ics in computer vision over the past few decades, and considerably longer in the field of human and biologi-cal vision. In order to deal with the inherent complexity of the visual world, biological systems have evolved a way to prioritise information by identifying objects, or parts, which stand out from the rest, and which are likely to characterise the essence of the surrounding scene. The concept of Bayesian surprise has been explored to model this process [25]. Psychophysical experiments have shown that texture is perceived in a pre-attentive fashion [48]. Pre-attentive means bottom-up and data-driven, which is also referred to as covert attention, in contrast to overt, consciously directed attention.
In their influential work, Laurent Itti, Christof Koch and Ernst Niebur [27, 26] introduced a filtering ap-proach to covert attention. Their model, which inspired countless others, extracts salience by a combination of centre-surround DoG filters. They applied these filters to feature maps which consist of colour channels and the responses of oriented Gabor filters, thus mimicking early biological vision. Their model was designed for explaining sequential saccadic eye movements, from the most conspicuous image point to other points with de-creasing order of conspicuity and inhibition of return. The recent algorithm VOCUS2 by Frintrop et al. has extended the same principle to detecting larger salient regions instead of points [14], demonstrating the con-tinued usefulness of the concept. The original Itti and Koch model has been extended numerous times, for example by weighting the different feature maps after identifying useful features [24] and by exploring the role of salience in overt attention [46]. In addition, eye fixation maps have been combined with traditional seg-mentation methods in order to model the segseg-mentation of salient regions [35]. The idea of contrasting the cen-tre of a region against its surround has also been applied using different similarity measures. Bruce and Tsotsos used information content of the two regions [6] for their AIM model, while Klein and Frintrop used the KL
di-vergence of feature statistics [30] and later multivariate probability distributions [31].
Much research in recent years has moved towards de-tecting entire salient objects in scenes. For testing the methods, there exist several high-profile benchmarks of natural images where the task is to segregate a promi-nent object. Most of the current approaches try to seg-ment an entire object, and regions can be modelled ac-cording to their colour and luminance [1], contrast [9, 8] or dissimilarity [13]. Another approach is to learn a cor-rect foreground object segmentation from a set of train-ing images [38]. This object-based salience can be very important for providing top-down feedback for scene understanding in artificial intelligence [51, 43] and cog-nitive robotics [53, 32]. Yet other methods try to repre-sent the scene in terms of visual perception [17], graph-based visual salience [21], and object-graph-based salience features [20]. Additionally, salience has also been mod-elled as a discriminant process [16] and as a regression problem [28]. Multi-scale processing has been shown to improve salience on small-scale, high-contrast patterns [59].
ACCEPTED MANUSCRIPT
matched filters for specific textures can be used [33],but performance becomes limited by the representative-ness of the chosen filters. Wavelets have also been used to successfully classify different textures [4]. Typically, texture segmentation is based on some kind of feature gradient (or feature contrast), and the maxima represent texture boundaries. Although texture models (and es-pecially Gabor-based texture models) have been exten-sively benchmarked [18] and successfully used for tex-ture segmentation [44] and classification [4], compara-tively few authors have explored their use for salience and attention models.
The earliest work on texture-based salience was prob-ably by Sayeda-Mahmood [48]. The algorithm pro-duces four binary maps from the image, and constructs a number of features, including the total number of holes in a region, the area occupied by holes in a white re-gion, and the shape and distribution of the holes. A heuristic algorithm then combines these into a salience score. The features are complex to compute because they involve region growing, counting and computing convex hulls, and they were only tested on artificial im-ages in a segmentation context. Building on the Itti and Koch model, Li’s method [37] employed responses of V1 cells directly to detect pop-out effects in simple tex-tures consisting of oriented textons. This work has been extended to multi-spectral features and a large number of textons [56], although it was only tested on a novel multi-spectral dataset. In [7], texture features are used to detect edges and combined with an object model to fill the rest of the salient object. Kalinke et al. [29] used co-occurrence matrices in order to extract texture-based features for creating hypotheses in an intelligent vehi-cle scenario. Powerful texture models for video [10, 58] are often difficult to use within the centre-surround fil-tering context, but they can be used within a discrim-inative framework [15]. More recently, the eye fixa-tion model of Momtaz and Daliri uses human fixafixa-tions to train a salience model using features like orientation and spatial frequency [41]. However, most of the above approaches are either difficult to apply within a centre-surround filtering context, or they do not aim to be gen-eral enough for salient region detection in natural im-ages.
There are several approaches which build salience maps from the frequency spectrum of the image. The method of Hou and Zhang is based on the global Fourier transform [23]. They subtract the average log-spectrum of many images from the log-spectrum of a specific im-age. This produces a residual spectrum. When this spectrum is transformed back to the spatial domain, it indicates salient regions which potentially correspond
to objects. Guo et al. [19] built on this concept, but argued that the phase, not the amplitude, of the spec-trum is key to finding salient regions. They extended this concept to the Quaternion Fourier Transform which can represent intensity, colour and motion of each pixel. An more recent take on quaternion-based salience was proposed by Schauerte and Stiefelhagen [49], whose method achieved state-of-the-art results on predicting human eye fixations. These methods are not biologi-cally plausible, nor are they based explicitly on texture, but our experiments show that they are more effective at texture salience than colour-based methods.
We are not aware of any recent work on salience which attempts to explicitly model texture and test model parameters on large-scale salience datasets. While there is a wealth of research on texture analysis and segmentation, methods are often difficult to use in a salience setting. In the rest of this paper we present a new and more biological interpretation of the local Ga-bor filter responses, extending our earlier work [52]. We describe the local texture using a parametric model of the local power spectrum. The parameters of this model represent new features, which are then processed using centre-surround DoG filters.
3. Methods
Salient parts of an image are often defined as regions which differ strongly from their surround, which are therefore conspicuous and appear to “pop-out.” They can be detected by applying centre-surround filters to a stack of images, where each image represents a certain feature. In general terms, we can define a feature vec-torFconsisting ofNindependent feature dimensions at each pixel position in the image:
F=[F1, . . . ,FN] F∈ RN. (1) Typically, salience models use colour channels to rep-resentF, for exampleF=[L,a∗,b∗]. Here the compo-nents represent a pixel’s colour in CIELAB space.
The input image can then be represented by a stack of real-valued images, each image in the stack being a different feature dimension at each pixel location:
S(x)=[I1(x), . . . ,IN(x)] , (2)
where x is a vector representing the usually two-dimensional pixel position.
ACCEPTED MANUSCRIPT
will have similar values. Thus, salient regions willgen-erate strong responses if filtered by appropriately-sized centre-surround filters. However, as shown in Fig. 1, if the salient region is not defined by colour, intensity or contrast, this approach will fail. If the region is primar-ily defined by a difference in texture, one must include texture parameters. In general, colour-only or texture-only approaches are prone to failure because there will always exist images in which a salient region is char-acterised by the other property, and the compromise is to use feature vectors which consist of both colour and texture parameters.
3.1. Properties of texture features
We propose that texture features suitable for salience detection should have the following three properties: constancy, similarity and Euclidean geometry. Al-though it is conceivable that additional properties could be beneficial, we are here primarely interested in fea-tures which fit seamlessly into the centre-surround fil-tering framework.
Euclidean geometry. The feature vectorFshould con-tain real-valued elements, as defined in Eq. 1. The in-dividual imagesIn from the image stackScan then be filtered independently by a bank of centre-surround fil-ters. The filtering operation is naturally performed in the space of real values, since it only requires multipli-cation, addition and negative values. Colour coding in CIELAB space fulfils this criterion.
Constancy. A large, homogeneous texture should result in a constant feature representation. This way, large tex-tured regions will produce no internal response when filtered by a centre-surround filter. At the same time, a small, differently textured region embedded within a large region should generate a strong response.CIELAB colour features exhibit constancy in case of homoge-neously coloured regions, but they may not be constant within a homogeneous texture. For example, when one or more colour components are modulated periodically, so will be the corresponding features. In such a case success depends on the colour components of the small region and its surrounding region, and their periodici-ties must be much smaller than the centre Gaussian of the DoG kernel.
Similarity. Visually similar textures should be repre-sented by similar feature vectors. Visually dissimilar textures should produce very different vectors. Here, too, CIELAB features as used in most salience models are similar for similar colours, but have no relation to
texture unless texture is defined by colour modulation and the above observations with respect to constancy are considered.
It is clear that colour channels (like theLa∗b∗ compo-nents of CIELAB space) possess the above properties. Below, our goal is to find texture-based features with the same properties, such that they can be used in con-junction with a salience algorithm based on colour chan-nels, in particular an algorithm which employs centre-surround DoG filtering.
3.2. Local power spectrum
Our texture features are based on the local image spectrum at each pixel location. In this section, we ex-plain how a local spectrum can be obtained from Gabor filter responses.
Simple cells in area V1 of the visual cortex are often modelled by oriented Gabor filters. The phases of the filters are commonly restricted to obtain odd-symmetric (sine) and even-symmetric (cosine) components. Re-sponses of these odd and even cells can be conveniently represented in quadrature, where the even component represents the real part, and the odd component repre-sents the imaginary part of a complex filter:
Gλ,θ(x,y)=exp −x˜ 2+γ˜y2
2σ2 !
exp i2πx˜ λ
!
, (3)
where rotation is defined by ˜
x=xcosθ+ysinθ (4) ˜
y=ycosθ−xsinθ , (5) λ is the wavelength of the sinusoidal part (in pixels), andσ is the standard deviation of the Gaussian enve-lope, which controls the receptive field size (also in pix-els). Parameterθdenotes the orientation of a rotated 2D Gabor filter.
There is a wide range of possible parameter choices, and it is known that V1 cells come in many phases, ori-entations and receptive field sizes. This leads to a large number of filtering operations, but efficient algorithms exist which work in real time. We rely on the recent implementation from [55], and adopt their default pa-rameters:σ/λ=0.56,γ=0.5,andθassumes 8 values equally spaced on [0, π). λ assumes 9 values, spaced half an octave apart.
Responses of simple cells are obtained by convolving an imageIwith the complex Gabor filters,
ACCEPTED MANUSCRIPT
Odd simple cells respond maximally at step stimuli,while even simple cells respond to bars and lines. Com-plex cells in the visual cortex respond to both, and they are less sensitive to location. One common way to model complex cells is by using the moduli of simple cell responses [22]:
Cλ,θ(x,y)=
Sλ,θ(x,y)
. (7)
The advantage of this representation, as opposed to e.g. the HMAX pooling model, is that each complex cell at a given pixel location encodes one part of the local power spectrum. Fig. 2 illustrates this concept: the local power spectrum can be seen as a 2D function over orientation and frequency (scale). Each texture possesses a specific local power spectrum, or “signature.”
The use of many Gabor filters at multiple orientations and scales means that our current algorithm for extract-ing texture features incurs a penalty of half a second per image. However, our code is not very optimised at the moment and the filtering operation can be more than 10 times faster on a GPU [55].
3.3. Spectral texture features
The local power spectrum (Fig. 2) tells us several im-portant things about the texture. The horizontal axis rep-resents the orientations of the complex cells. Vertical stripes in the power spectrum mean that complex cells tuned to a particular orientation respond strongly, and that the texture has a corresponding orientation com-ponent. Since the eight filter orientations are evenly spaced on [0, π), filters with θ = 0 and θ = (7/8)π cover neighbouring orientations. Therefore, the local power spectrum should be imagined as being cylindri-cal or cyclic over orientation. The verticylindri-cal axis repre-sents the frequency or scale of the complex cells, and it can tell us about the coarseness or fineness of the tex-ture or of its components. In principle, the entire power spectrum can be used as feature vector, but it consists of 8×9=72 values at each pixel location. Apart from the fact that the use of 72 feature images is prohibitive, the question is whether we really need all the precise in-formation. Since our goal is to have few features which can indicate that an object differs from its surrounding, we aim at a more compact model.
We observed that for many textures the local power spectrum resembles a 2D Gaussian function [11]. This means that often the power is clustered around one ori-entation and one scale. This is partly due to a property of the V1 model we use: each complex cell is tuned to a specific orientation and scale, but cells tuned to sim-ilar orientations and scales also respond, be it less, ef-fectively yielding a smooth power spectrum. Although
a 2D Gaussian spectrum is a crude approximation for many real-world textures, for example those with two dominant orientations, it still contains important infor-mation which can be useful for distinguishing different textures. In our model, the 2D Gaussian spectrum is rep-resented by the mean scale and orientation, µs andµo, and the spreads around these, the standard deviationsσs andσo. Fig. 2 illustrates the parameters.
These four parameters have a very intuitive interpre-tation. µs andµo indicate the dominant scale and ori-entation, and can thus differentiate between coarse and fine textures, and textures with different orientations.σo represents a texture’s isotropy: a small value means that a texture is anisotropic with one pronounced orientation, whereas a large value indicates the presence of multi-ple orientations. Similarly,σsindicates the mixture of scales. A small value means one, well-defined scale, while a large value means that the texture contains both coarse and fine elements.
The 2D array holding the local power spectrum is processed using a very quick algorithm. Since the spec-trum is typically noisy, it is first smoothed by a lowpass 3×3 block filter. This filter is applied to the “cylindri-cal” array which is cyclic in the orientation dimension. Then, two projections are computed by summing the ar-ray into two 1D arar-rays: the scale arar-raySiand the (also cyclic) orientation arrayOi. In each of these arrays, the local maximum is found, yieldingµsandµo. Here, the local maximum is used as a rough approximation of the mean of the fitted Gaussian which is faster and did not negatively affect performance in our tests. Finally, the standard deviationsσsandσoaroundµsandµoare de-termined, taking again into account the periodicity of Oi. Although true 1D or 2D curve fitting leads to more accurate values, in practice we did not find significant differences in the salience results. We must not forget that the four parameters are still to be processed by big DoG filters, i.e., big lowpass filters before the subtrac-tion. Therefore, in our evaluation we use the simpler approach. Figure 3 illustrates the features in case of a real input image from Achanta et al. [1].
3.4. Salience extraction
Once an image is processed by our spectral algo-rithm, it is represented by a stack of four feature im-ages similar to an RGB, HSV or CIELAB colour stack. As discussed earlier, the features extracted by our algo-rithm also behave in a similar way as colour features, so they can be used as direct input to a standard salience algorithm. Our work aims at finding texture features which are compatible with the centre-surround filtering framework for blob detection.
ACCEPTED MANUSCRIPT
!!
! ! ! ! ! ! ! ! ! !
! ! ! ! ! ! ! ! ! ! ! ! ! ! ! ! ! ! ! ! !
! ! ! ! ! ! ! ! ! ! ! ! ! ! ! ! ! ! ! ! !
!
! !
!"!
!
µ
"!!
#!µ
#! [image:7.595.182.427.110.309.2]!
Figure 2: Our texture model. A local power spectrum is a 2D matrix with the dimensions representing orientation (horizontal axis) and frequency (vertical). This spectrum often resembles a 2D Gaussian function. We therefore fit two 1D Gaussians to the 1D marginal arrays to obtain the means and standard deviations of orientation and frequency, which we use as features.
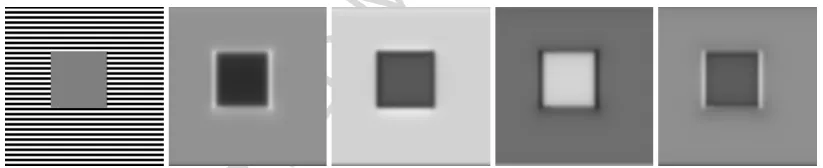
Figure 3: Example of texture features extracted from a synthetic image. Blob detection on these feature maps is used to produce a salience map. From left: input image,µo,σo,µf,σf.
In order to evaluate the effects of our features in a fair way, we decided to use an off-the-shelf state-of-the-art algorithm which implements a variation of the Itti and Koch model. The VOCUS2 algorithm [14] has re-cently shown strong performance across a wide range of salience benchmarks, and we therefore employ it in our evaluation. Our main motivation was to perform a fair comparison between standard colour-based features and our new texture-based ones on a set of difficult and texture-dominated images.
In our tests, we used three versions of this salience detector. The first is the default version, using three colour-based channels as input: intensity, red/green, and blue/yellow. Each of these feature channels is processed by a set of centre-surround filters to produce a conspicu-ity map for each channel. These conspicuconspicu-ity maps are then summed to create the salience map [14]. The sec-ond version uses our four feature maps (mean and stan-dard deviation of orientation and scale at each pixel) instead of the colour/intensity maps. The result is a
salience map derived purely from our texture model. The final, complete version uses a combination of all available features: three colour-based, plus four texture based, for a total of seven input feature maps.
4. Evaluation
We evaluated our features on three standard datasets: MSRA-1000 [1], PASCAL-S [36], and ECSSD [50]. Additionally, we tested on a novel texture dataset which was designed to test how sensitive existing salience al-gorithms are to texture. We report the precision-recall curve and the Area Under Curve (AUC).
[image:7.595.92.504.351.435.2]ACCEPTED MANUSCRIPT
!! ! ! ! !
!
! ! ! ! !
! ! ! ! ! !
! !
! ! ! !
! !
! !
! !
! ! ! ! ! !
! ! ! ! ! !
!!!Image!!!!!!!!!!!!!!!!!!!!!!!SR!!!!!!!!!!!!!!!!!!!!!!!!!!MZ!!!!!!!!!!!!!!!!!!!!!VOCUS2!!!!!!!!!!!!!!!!!!Ours!!!!!!!!!!!!!!!!!!!!!!!!GD!!!!!!! !
! !
! ! !
! !
! !
[image:8.595.93.506.112.687.2]! !
Figure 4: Visual comparison of results on the new texture salience dataset. The input images are shown on the left, the ground truth annotations on the right. The other columns, from left to right, show the results of the spectral residual (SR) method [23], of the phase spectrum (MZ) method [19], of the standard VOCUS2 method based on colour [14], and our new texture features used together with VOCUS2. All images are before thresholding them with different threshold values for computing precision-recall curves.
ACCEPTED MANUSCRIPT
method SalGAN [45]. The latter was included toes-tablish the current state of the art on natural datasets but we stress that our primary goal was to measure the in-fluence of texture features and evaluate their usefulness in a salience context.
4.1. Natural image datasets
[image:9.595.307.531.110.297.2]We tested on three standard natural image datasets: MSRA-1000, PASCAL-S, and ECSSD. The datasets consist of images accompanied by ground-truth masks indicating salient objects. Performance is reported as a precision-recall curve calculated on a pixel-wise basis.
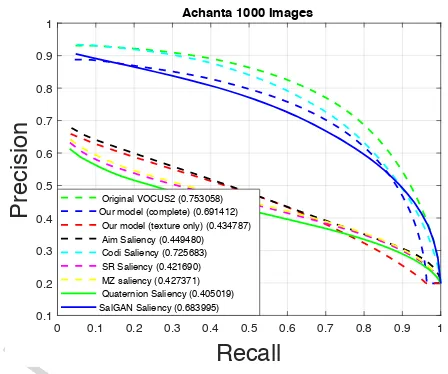
Figure 5 shows the results on the MSRA-1000 dataset by Achanta et al. Texture-based methods all performed poorly on this dataset. Standard colour-based VOCUS2 method outperformed our complete method which com-bines colour and texture, but both of them outperformed the deep learning method SalGAN.
We then tested on two more recent and more chal-lenging datasets: PASCAL-S and ECSSD (Fig. 6). As expected, the deep-learning method did very well here, followed by our complete method which combined tex-ture and colour. On both of these datasets, the addition of texture features boosted the result compared to the standard, colour-only VOCUS2: by 3.2% on ECSSD and by 3.8% on PASCAL-S. This confirms our intu-ition that texture features improve performance on nat-ural images. Codi performed slightly worse than stan-dard VOCUS2, and all texture-only methods performed much worse. This was expected because texture is a weaker attention cue than colour. However, it shows that texture alone carries important information about salience, and that integrating texture features is benefi-cial.
4.2. Texture-based dataset
We then tested the algorithms on a novel dataset. This dataset also consists of 1000 images, but the images were created such that texture is the main driver of at-tention. It consists of three subsets: a synthetic dataset, a mixed dataset, and a modified natural dataset.
The synthetic dataset consists of 300 artificial im-ages filled with artificial textures. The textures exhibit systematic variations in scale, orientation and isotropy. This subset tests the basic behaviour of the algorithms in a controlled manner. For example, see the top two rows of Fig.4.
The second, mixed dataset uses combinations of nat-ural textures and consists of 400 images. Ground-truth annotations were taken from various images of the Achanta dataset, and the foreground and background
0 0.1 0.2 0.3 0.4 0.5 0.6 0.7 0.8 0.9 1
Recall
0.1 0.2 0.3 0.4 0.5 0.6 0.7 0.8 0.9 1
Precision
Achanta 1000 Images
Original VOCUS2 (0.753058) Our model (complete) (0.691412) Our model (texture only) (0.434787) Aim Saliency (0.449480) Codi Saliency (0.725683) SR Saliency (0.421690) MZ saliency (0.427371) Quaternion Saliency (0.405019) SalGAN Saliency (0.683995)
Figure 5: Evaluation on the standard MSRA-1000 salience dataset [1]. Our texture features combined with the VOCUS2 algorithm out-perform the frequency-based methods SR [23] and MZ [19], but do worse than the original VOCUS2 algorithm [14] which is based on colour and intensity. Texture was not found to be a strong cue on this dataset, with texture-based methods doing poorly. The use of texture features failed to improve performance of VOCUS2 on this dataset.
were filled with different natural textures selected from [5]. This subset tests the ability of the features to repre-sent complex, real-world textures.
The third subset consists of 300 modified images from the Achanta set. The images were converted to greyscale in order to remove colour. This subset tests the strength of the features in scenarios where intensity and colour are unreliable cues.
ACCEPTED MANUSCRIPT
0 0.1 0.2 0.3 0.4 0.5 0.6 0.7 0.8 0.9 1
Recall
0.2 0.3 0.4 0.5 0.6 0.7 0.8 0.9
Precision
Pascal Dataset
Original VOCUS2 (0.425973) Our model (complete) (0.442291) Our model (texture only) (0.378034) Aim Saliency (0.389150) Codi Saliency (0.412086) SR Saliency (0.392088) MZ saliency (0.393406) Quaternion Saliency (0.388803) SalGAN Saliency (0.570734)
0 0.1 0.2 0.3 0.4 0.5 0.6 0.7 0.8 0.9 1
Recall
0.2 0.3 0.4 0.5 0.6 0.7 0.8 0.9 1
Precision
Ecssd Dataset
[image:10.595.90.510.112.289.2]Original VOCUS2 (0.479140) Our model (complete) (0.494419) Our model (texture only) (0.397144) Aim Saliency (0.379920) Codi Saliency (0.471850) SR Saliency (0.364929) MZ saliency (0.366383) Quaternion Saliency (0.359021) SalGAN Saliency (0.629580)
Figure 6: Evaluation on the PASCAL-S (left) and ECSSD (right) datasets. The deep learning method does best, but it can be clearly seen that the use of texture features improves the performance of the VOCUS2 algorithm. All texture-based methods perform similarly on the PASCAL-S dataset, but our texture-only algorithm clearly outperforms other texture-based methods on the ECSSD dataset.
0 0.1 0.2 0.3 0.4 0.5 0.6 0.7 0.8 0.9 1
Recall
0.1 0.2 0.3 0.4 0.5 0.6 0.7 0.8 0.9
Precision
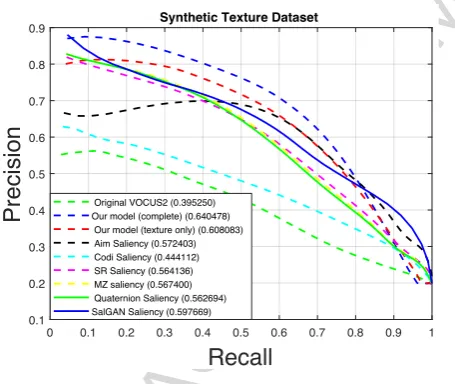
Synthetic Texture Dataset
Original VOCUS2 (0.395250) Our model (complete) (0.640478) Our model (texture only) (0.608083) Aim Saliency (0.572403) Codi Saliency (0.444112) SR Saliency (0.564136) MZ saliency (0.567400) Quaternion Saliency (0.562694) SalGAN Saliency (0.597669)
Figure 7: Comparison on the new texture salience dataset. Here our texture-based features outperform all other tested methods. including VOCUS2 [14], spectral residual (SR) [23], and phase spectrum (MZ) [19]. It can be seen that colour and intensity perform very poorly on this dataset, unlike the proposed texture features. Deep saliency (Sal-GAN) performs well, but not as well as our texture-based approach.
5. Discussion
Our experiments on standard datasets show that tex-ture is clearly not the main driver of salience. This is not surprising, and was to be expected from the success of colour-based methods on natural images. The results, however, strongly suggest that adding tex-ture featex-tures to colour-based featex-tures increases perfor-mance and manages to significantly outperform existing spectrum-based methods. These conclusions are still
premature, because the texture model is extremely sim-ple with only four parameters.
Texture obviously plays a role in human vision, and there are many toy examples where colour-based salience methods fail, so an important part of the puz-zle is still missing from our salience models. Our new dataset was built specifically to test the ability of algo-rithms to detect salient objects primarily defined by tex-ture, and the results clearly show that texture models are needed for this. On this new dataset, colour-based VO-CUS2 did very poorly, although it is consistently among the top-performing algorithms on a wide range of stan-dard salience datasets [14]. The spectral methods of Hou et al. [23] and Guo et al. [19] significantly outper-formed it, although they are not competitive at all on the original natural dataset of Achanta et al. As expected, our features excel in case of texture-driven salience. In-terestingly, the state-of-the-art method based on deep learning performed well on this task, but was still out-performed by our simple texture model.
5.1. Biological plausibility
[image:10.595.66.294.342.534.2]ACCEPTED MANUSCRIPT
first, involving only V1, but 3D shape, figure-groundand object reconstruction are done later, and these re-quire feedback from V4/MT and even inferior-temporal (IT) cortex [34].
Vision is based on the interplay of all parts. V1 may be a high-resolution buffer which holds a precise recon-struction of an object and its position, it has no under-standing of what it holds. In contrast, IT cortex knows what the object is but not where it is. Therefore, vi-sion requires both V1 and IT cortex, and it follows that figure-ground segregation and object recognition are in-tertwined. All available information can be combined for segregation: optical flow and stereo disparity nor-mally apply to entire objects, but colour and texture may be problematic because objects can have differently coloured or textured parts.
Segregation and recognition are also related to at-tention. Early work on Focus-of-Attention (FoA) was based on the idea that some complexity maps, for ex-ample salience maps based on colour contrast, provided peaks for modelling saccadic eye movements with inhi-bition of return to already “visited” peaks (see below). Taking into account that the fusion of colour and dis-parity information often suffices to obtain the contour of an entire object which can then be employed for a first object categorisation [40], in this paper we did not address saccadic eye movements but exogeneous atten-tion to entire objects for object segregaatten-tion. Instead of employing a filling-in process by neural diffusion or Ullman’s “colouring,” see e.g. [34], a process rem-iniscent of boundary-filling in computer graphics, seg-regation is done by building a Gaussian tree such that DoG (Difference-of-Gaussians) filter kernels can be ap-plied. The idea is that the tree can be built in the V1-up hierarchy with increasing kernel size and concurrent loss of spatial localisation, after which feedback down to V1 serves to restore precision. In computer vision, the state-of-the-art VOCUS2 colour salience algorithm already employs blob detection by DoG kernels [14]. Therefore, by using the VOCUS2 algorithm we could focus on texture and easily experiment with colour and texture information.
Figure-ground segregation as outlined above still lacks a process which guides the up and down infor-mation streams and maintains attention until up-down convergence has been achieved and all communications between the levels are muted. There is increasing evi-dence that all cortical areas are connected to the thala-mus, that the thalamus is not only a passive relay station (first-order visual thalamus is also called LGN, lateral geniculate nucleus, which receives input from the reti-nae and forwards this to V1), but that the thalamus must
be seen as an active, volatile blackboard which holds the latest ideas synthesised from multiple cortical sources. The surface layer of the thalamus, the reticular layer or RE thalamus, has a special role: to gate information and to sustain cortical attention. Building on earlier FoA work by Francis Crick and Anne Treisman’s “search-light” metaphor, also taking into account the massive projection from V1 back down to LGN, David Mum-ford [42] speculated that if the thalamus is the gateway to the cortex, then RE thalamus, “smack in the middle of the pathway,” is the guardian of the pathway. Hence, if V1 is a high-resolution buffer and LGN an internal but also high-resolution sketchpad, with higher areas V2 etc. and higher-order thalamic areas forming concurrent hierarchies holding more complex representations with less localisation at the higher levels, then RE thalamus, which is the only layer known to have connections be-tween thalamic areas, can provide the substrate for the guidance process: to sustain attention to specific objects as information continually and concurrently moves up and down.
5.2. Relation to computational models
ACCEPTED MANUSCRIPT
has been shown that an advanced model of grating cellscan be used to detect periodic textures with only one ori-entation, but also that multiple cells tuned to different orientations can be used to detect gratings with diff er-ent symmetries, i.e., rectangular and hexagonal textures [12].
The question is what mechanisms does our visual sys-tem deploy for dealing with all types of textures in our everyday tasks. It is well-known that spatial orientation and frequency play an important role in visual attention [57], but less is known about existence of more com-plex texture models. When developing a texture-based salience model we therefore gave economy a decisive role: the simplest model with only very few parameters on top of existing circuitry, the complex cells. The ra-tionale is that we do not need to model all types of tex-tures; rather, we often need only one parameter which can distinguish an object from its background.
Texture processing in human vision is complex and not yet well understood. It is believed that texture even plays a role in early processing, like segmentation and attention as evidenced by the pop-out effect (Fig. 1). Our features are based directly on complex cells in V1, with relatively simple post-processing. Therefore, the simplicity and good performance of our model might hint at similar early texture coding strategies in biologi-cal systems [34].
The behaviour of V1 cells is quite well understood, and we used a well-established model. The interpreta-tion of the responses as a local power spectrum is a bit more difficult to argue, since it essentially is an engi-neering model which was explored for different texture processing strategies and models [11]. We do not sug-gest that the visual cortex “intends” to calculate a local power spectrum. However, our features can be extracted from responses of complex cells by very simple addi-tions, multiplications and max operations. It is this sim-plicity which suggests that it could be a plausible model for early texture processing. In addition, texture fea-tures can be easily combined with colour feafea-tures, and both require simple blob detection, for example by DoG filter kernels in a Gaussian tree. It becomes more com-plicated when motion and stereo disparity must be inte-grated, because these are processed in higher areas with feedback to area V1. Motion and disparity are primary cues for object segregation because object recognition is not yet required. These cues could actually steer blob detection for texture and colour, (1) with feedback to V1 in order to obtain precise object contours, and (2) in the entire hierarchy from V1 to IT cortex such that IT cortex knows what it is but not where it is, and V1 has a precise picture of it with absolutely no clue as to what
it is [34].
6. Conclusions
In this paper we presented a novel set of features for texture-based salience. To the best of our knowledge, this is the first time that texture features were shown to be a useful salience cue, and the first time that a texture-based model is evaluated on a large dataset. Two other algorithms used (global) spectral image characteristics for salience [23, 19]. In contrast, our proposed features model texture explicitly, the model is about the simplest one that one can conceive, the four parameters have very intuitive interpretations in terms of isotropy and scale.
We also introduced a new dataset which is specifi-cally designed to test the ability of a salience detector to deal with texture. It comprises a mix of synthetic im-ages, of artificial images with natural textures, and of natural images without colour information. The eval-uation shows that the addition of texture features to a centre-surround method yields improved results both on natural images and on a novel texture dataset, suggest-ing that texture can be useful for salience. We believe that this dataset will also be useful to other researchers in this field.
Acknowledgements. This work was supported by the EU under the FP-7 grant ICT-2009.2.1-270247 Neural-Dynamics and by the FCT under the grants LarSYS UID/EEA/50009/2013 and SparseCoding EXPL/ EEI-SII/1982/2013.
References
[1] R. Achanta, F. J. Estrada, P. Wils, and S. S¨usstrunk. Salient region detection and segmentation. InICVS, pages 66–75, 2008. [2] R. Achanta, S. S. Hemami, F. J. Estrada, and S. S¨usstrunk. Frequency-tuned salient region detection. In CVPR, pages 1597–1604, 2009.
[3] A. Ahmadvand and M. R. Daliri. Invariant texture classification using a spatial filter bank in multi-resolution analysis. Image Vision Comput., 45:1–10, 2016.
[4] A. Ahmadvand and M. R. Daliri. Rotation invariant texture classification using extended wavelet channel combining and ll channel filter bank.Knowledge-Based Systems, 97:75–88, 2016. [5] P. Brodatz. Textures: a photographic album for artists and
de-signers. Dover Publications, Inc., New York, 1966.
[6] N. D. B. Bruce and J. K. Tsotsos. Saliency, attention, and visual search: An information theoretic approach. Journal of Vision, 9(5), March 2009.
[7] H-Y Chen and J-J Leou. A new visual attention model using texture and object features. InIEEE CIT Workshops, pages 374– 378, July 2008.
[8] M.-M. Cheng, N. J. Mitra, X. Huang, P. H. S. Torr, and S.-M. Hu. Global contrast based salient region detection. IEEE T-PAMI, 37(3):569–582, March 2015.
ACCEPTED MANUSCRIPT
[9] M-M Cheng, G-X Zhang, N. J. Mitra, X. Huang, and S-M Hu. Global contrast based salient region detection. InCVPR, pages 409–416, 2011.
[10] G. Doretto, A. Chiuso, Y. N. Wu, and S. Soatto. Dynamic tex-tures.Int. J. Comput. Vis., 51, 2003.
[11] J. M. H. du Buf. Abstract processes in texture discrimination.
Spatial Vision, 6:221–242, 1992.
[12] J. M. H. du Buf. Improved grating and bar cell models in cortical area v1 and texture coding.Image Vision Comput., 25:873–882, 2007.
[13] L. Duan, C. Wu, J. Miao, L. Qing, and Y. Fu. Visual saliency detection by spatially weighted dissimilarity. InCVPR, pages 473–480, 2011.
[14] S. Frintrop, T. Werner, and G. Martin-Garcia. Traditional saliency reloaded: A good old model in new shape. InCVPR, 2015.
[15] D. Gao, V. Mahadevan, and N. Vasconcelos. The discriminant center-surround hypothesis for bottom-up saliency. InNIPS, pages 497–504. 2008.
[16] D. Gao and N. Vasconcelos. Bottom-up saliency is a discrimi-nant process. InICCV, pages 1–6, 2007.
[17] S. Goferman, L. Zelnik-Manor, and A. Tal. Context-aware saliency detection. InCVPR, pages 2376–2383, 2010. [18] S. E. Grigorescu, N. Petkov, and P. Kruizinga. Comparison of
texture features based on gabor filters. IEEE Transactions on Image Processing, 11(10):1160–1167, October 2002.
[19] C. Guo, Q. Ma, and L. Zhang. Spatio-temporal saliency detec-tion using phase spectrum of quaternion fourier transform. In
CVPR, 2008.
[20] J. Han, K. N. Ngan, M.J. Li, and H.J. Zhang. Unsupervised ex-traction of visual attention objects in color images.IEEE Trans. Circuits Syst. Video Techn., 16(1):141–145, 2006.
[21] J. Harel, C. Koch, and P. Perona. Graph-based visual saliency. InNIPS, pages 545–552, 2006.
[22] F. Heitger, L. Rosenthaler, R. von der Heydt, E. Peterhans, and O. Kuebler. Simulation of neural contour mechanisms: from simple to end-stopped cells.Vision Res., 32(5):963–981, 1992. [23] X. Hou and L. Zhang. Saliency detection: A spectral residual
approach. InCVPR, 2007.
[24] Y. Hu, X. Xie, W.-Y. Ma, L.-T. Chia, and D. Rajan. Salient re-gion detection using weighted feature maps based on the human visual attention model. InPCM, pages 993–1000, 2004. [25] L. Itti and P. Baldi. Bayesian surprise attracts human attention.
InNIPS, pages 547–554, 2005.
[26] L. Itti and C. Koch. A saliency-based search mechanism for overt and covert shifts of visual attention. Vision Research, 40(10-12):1489–1506, May 2000.
[27] L. Itti, C. Koch, and E. Niebur. A model of saliency-based visual attention for rapid scene analysis. IEEE Trans. Pattern Anal. Mach. Intell., 20(11):1254–1259, 1998.
[28] H. Jiang, J. Wang, Z. Yuan, Y. Wu, and N. Zheng. Salient ob-ject detection: a discriminative regional feature integration ap-proach. InCVPR, 2013.
[29] T. Kalinke, C. Tzomakas, and W. von Seelen. A texture-based object detection and an adaptive model-based classification. In
Proc. IEEE Intelligent Vehicles Symposium, volume 98, pages 341–346, 1998.
[30] D. A. Klein and S. Frintrop. Center-surround divergence of fea-ture statistics for salient object detection. InICCV, 2011. [31] D. A. Klein, G. M. Garc´ıa, and S. Frintrop. A computational
model for saliency detection based on probability distributions. InEuropean Conference on Visual Perception (ECVP), Alghero, September 2012.
[32] A. Kreutzmann, K. Terzi´c, and B. Neumann. Context-aware classification for incremental scene interpretation. In
Work-shop on Use of Context in Vision Processing, Boston, November 2009.
[33] M. S. Landy and J. R. Bergen. Texture segregation and orienta-tion gradient.Vision Research, 31(4):679–691, 1991. [34] T. S. Lee, D. Mumford, R. Romero, and V. A. F. Lamme. The
role of the primary visual cortex in higher level vision. Vision Res., 38:2429–2454, 1998.
[35] Y. Li, X. Hou, C. Koch, J. M. Rehg, and A. L. Yuille. The secrets of salient object segmentation. InCVPR, pages 280–287, 2014. [36] Y. Li, X. Hou, C. Koch, J. M. Rehg, and A. L. Yuille. The secrets of salient object segmentation. InCVPR, pages 280– 287, Washington, DC, USA, 2014.
[37] Z. Li. A saliency map in primary visual cortex. 6(1):9–16, Jan-uary 2002.
[38] T. Liu, J. Sun, N. Zheng, X. Tang, and H.-Y. Shum. Learning to detect a salient object. InCVPR, 2007.
[39] J. Malik and P. Perona. Preattentive texture discrimination with early vision mechanisms. J. Opt. Soc. Am. A, 7(5):923–932, May 1990.
[40] J. A. Martins, J. M. F. Rodrigues, and J. M. H. du Buf. Proto-object categorisation and local gist vision using low-level spatial features.BioSystems, 135:35–49, 2015.
[41] H. Z. Momtaz and M. R. Daliri. Predicting the eye fixation loca-tions in the gray scale imagesin the visual scenes with different semantic contents.Cogn Neurodyn, 10:31–47, 2016.
[42] D. Mumford. On the computational architecture of the neo-cortex. i. the role of the thalamo-cortical loop. Biol. Cybern., 65:135–145, 1991.
[43] B. Neumann and K. Terzi´c. Context-based probabilistic scene interpretation. InIFIP AI, pages 155–164, Sep 2010.
[44] T. Ojala and Pietikinen M. Unsupervised texture segmentation using feature distributions.Pattern Recognition, 32(3):477–486, March 1999.
[45] J. Pan, E. Sayrol, X. Giro i Nieto, C. C. Ferrer, J. Torres, K. McGuinness, and N. O’Connor. Salgan: Visual saliency pre-diction with adversarial networks. InCVPR Scene Understand-ing Workshop (SUNw), July 2017. Accepted.
[46] D. Parkhurst, K. Law, and E. Niebur. Modeling the role of salience in the allocation of overt visual attention. Vision Res., 42(1):107–123, Jan 2002.
[47] X. Qi, L. Shen, G. Zhao, Q. Li, and M. Pietik¨ainen. Globally rotation invariant multi-scale co-occurrence local binary pattern.
Image Vision Comput., 43:16–26, 2015.
[48] T.F Sayeda-Mahmood. Detecting perceptually salient texture regions in images.Computer Vision and Image Understanding, 76(1):93–108, October 1999.
[49] B. Schauerte and R. Stiefelhagen. Quaternion-based spectral saliency detection for eye fixation prediction. InECCV, pages 116–129, 2012.
[50] J. Shi, Q. Yan, L. Xu, and J. Jia. Hierarchical image saliency detection on extended cssd.IEEE TPAMI, 38(4):717–729, April 2016.
[51] K. Terzi´c, L. Hotz, and J. ˇSochman. Interpreting structures in man-made scenes: Combining low-level and high-level struc-ture sources. InInternational Conference on Agents and Artifi-cial Intelligence, Valencia, Spain, Jan 2010.
[52] K. Terzi´c, S. Krishna, and J.M.H. du Buf. A parametric spectral model for texture-based salience. InGCPR, pages 331–342, Aachen, October 2015.
[53] K. Terzi´c, D. Lobato, M. Saleiro, J. Martins, M. Farrajota, J.M.F. Rodrigues, and J.M.H. du Buf. Biological models for active vision: Towards a unified architecture. InICVS 2013, LNCS, volume 7963, pages 113–122, Jul 2013.
ACCEPTED MANUSCRIPT
3376, Melbourne, Sep 2013.
[55] K. Terzi´c, J.M.F. Rodrigues, and J.M.H. du Buf. BIMP: A real-time biological model of multi-scale keypoint detection in V1.
Neurocomputing, 150:227–237, 2015.
[56] Q. Wang, P. Yan, Y. Yuan, and X. Lia. Multi-spectral saliency detection. Pattern Recognition Letters, 34(1):34–41, January 2013.
[57] J. M. Wolfe and T. S. Horowitz. What attributes guide the de-ployment of visual attention and how do they do it? Nature Reviews Neuroscience, 5(6):495–501, 2004.
[58] J. Xie and Y. Fang. Dynamic texture recognition with video set based collaborative representation. Image Vision Comput., 2016. In Press.
[59] Q. Yan, L. Xu, J. Shi, and J. Jia. Hierarchical saliency detection. InCVPR, 2013.
ACCEPTED MANUSCRIPT
Highlights• A novel texture model for visual salience is pro-posed
• A novel texture-based salience dataset is presented
![Figure 4: Visual comparison of results on the new texture salience dataset. The input images are shown on the left, the ground truth annotations![19], of the standard VOCUS2 method based on colour [14], and our new texture features used together with VOCUS](https://thumb-us.123doks.com/thumbv2/123dok_us/9010319.397747/8.595.93.506.112.687/figure-comparison-results-texture-salience-annotations-standard-features.webp)