Improving the Quality of Whole Wheat Bread
by Using Various Plant Origin Materials
Hüseyin Boz
1and Mehmet Murat Karaoğlu
21Food Technology Department, Narman Vocational High School, Narman, Erzurum, Turkey;
2Food Engineering Department, Faculty of agriculture, atatürk university, Erzurum, Turkey
Abstract
Boz H.,Karaoğlu M.M. (2013): Improving the quality of whole wheat bread by using various plant origin materials. Czech J. Food Sci., 31: 457–466.
The effects of various plant origin materials such as defatted Cephalaria syriaca flour (0.5%), rosehip (2.5%), vital gluten (2.5%), and malt flour (2%), and their combination on the quality of whole wheat bread were investigated. The plant origin materials used showed significant effects on the specific volume, acidity, colour, and textural properties of whole wheat bread. In general the acidity, specific volume, cohesiveness, and springiness values of whole wheat bread produced by treatments with plant origin materials were higher than those of the control bread. Treatment 13 (2% malt flour + 0.5% defatted Cephalaria syriaca flour + 2.5% vital gluten) resulted in the highest specific volume and the lowest 1st day crumb firmness. The results showed that the quality of whole wheat bread could be improved
by adding various plant origin materials.
Keywords: bread; textural properties; cephalaria; vital gluten; malt flour
Most consumers prefer products of refined white flour to whole grain products, because they perceive the textural properties of whole grain products as less attractive. Bran characteristics of whole wheat flour have a great negative effect on the quality of whole wheat bread (Noort et al. 2010). To meet consumers’ health requirements, breads with added nutritional compounds are now expanding (Poınot et al. 2009). However, the daily consumption of whole grain and high fibre products is desired to be significantly higher for the health reasons (Shenoy & Prakash 2002; Lasekan
et al. 2011; Sullivan 2011). The consumption
of whole grain products can be stimulated by improving their perceived attractiveness. Hence, the inclusion of some materials such as malt flour, rosehip, cephalaria, and vital gluten in the dough formulation can be considered to improve the quality of whole wheat bread.
How the addition of malt flour (MF) influences the rheological characteristics depends on its dia-static power and flour quality. The addition of MF
increases the gas production in the dough, improves crust colour formation and flavour profile of the product. Malt α-amylase is necessary for optimal yeast growth and gas production (Hrušková et al. 2003). Vital gluten (G) is used to increase the protein content, water absorption of flour and dough tolerance, and to improve the final quality of the product in the bread production (Jood et al.
2001; Day et al. 2009; Ghorbel et al. 2010). The vitality of gluten is generally assessed by its ability of increasing the volume and improving the crumb structure of bread baked from standard flour for-tified with gluten (Esteller et al. 2005). G is the insoluble protein portion of wheat flour that has been separated, washed and dried. Rosehip (rosa
canina –R) is a plant well known for its highest
in order to improve rheological properties of the dough. Growing Cephalaria syriaca is generally encouraged in wheat fields in Turkey. The growth form of cephalaria is different from that of wheat. However, the fruit of cephalaria is similar to a wheat grain in terms of its size and shape. Cephalaria
syriaca has been conventionally used as an additive
which increasing the strength of the weak flour dough used in breadmaking by farmers living in some parts of Turkey. Cephalaria syriaca has a great positive effect on the extensograph charac-teristics of wheat flour (Karaoğlu 2006) and the quality of wheat bran bread (Karaoğlu 2011).
The aim of the present research is to deter-mine the potential use of various materials (MF, R, cephalaria, and G) for increasing the final quality of whole wheat bread. The effects of these materi-als, used alone or in combination, on whole wheat bread were studied.
MATERIAL AND METHODS
Organic whole wheat flour. In order to produce
whole wheat bread, we used two kinds of organic wheat (cvs Bezostaya and Kırik) purchased from organic wheat producers in Erzurum, Turkey. Cultivar Bezostaya is a hard red winter (HRW) wheat and has 12.5% protein content; cv. Kırik is a hard white spring (HWS) wheat and has 11.9% protein content. Organic wheats (cvs Bezostaya and Kırik) were mixed in the ratio of 1:1 (w/w) and were milled in a stone mill to produce organic whole wheat flour (WF).
Defatted Cephalaria syriaca flour. Cephalaria
syriaca seeds were obtained from a seed merchant
in Erzurum, Turkey. Grains were milled in a labo-ratory model vertical grinder (Brabender Type LST7170; Brabender® GmbH & Co. KG, Duisburg,
Germany) with a sieve aperture of 1-mm diameter to produce whole cephalaria flour. Whole cepha-laria flour was freeze dried using a freeze dryer (Hetosicc, CD 2.5; Heto Co., Allerod, Denmark) and extracted in a Soxhlet extractor with petro-leum ether (60–80°C for 12 h) to produce
defat-ted Cephalaria syriaca flour (DCSF). Cephalaria
syriaca oil was extracted from Cephalaria syriaca
groats in order to decrease the probability of the oxidative reactions in the final product. Chemical composition values of the defatted Cephalaria
syriaca (on dry matter basis) were 6.21% moisture,
8.14% ash, 1.19% fat, and 14.29% protein.
Malt flour. MF was produced according to
Odu-modu (2008) with some modifications for this study. Organic wheat (Bezostaya/Kırik, 1:1, w/w) was soaked with tap water in the ratio of 1:4 (v/w). The grains were spread on moist trays in a basket covered with moist cloth and allowed to germinate for 72 h at 30 ± 3°C. The grains were watered in 12 h intervals. The germinated grains were dried at 50°C for 48 h and were subsequently milled in a laboratory model vertical grinder (Brabender Type LST7170) with a sieve aperture of 300 µm mesh screen to produce MF. MF was placed in a jar and stored in a deep freeze (–18°C) for the sub-sequent use. The effect of the malted wheat flour (with diastatic power 220 s) was evaluated by the addition of 2% per the whole wheat flour weight.
Vital gluten. Vital gluten was extracted from
organic wheat flour. Organic wheat flour and water (2:1 w/v) were mixed for 2 min in a Stephan uni-versal mixer (UM 5; Stephan, Erlangen, Germany). After resting for 20 min, the dough was washed gently in running tap water until the waste water appeared to be clear. The wet gluten obtained was cut into small pieces, spread on aluminum trays, and cooled down to –18°C in a deep freeze for 24 hours. Small gluten pieces were freeze dried in a freeze dryer and they were milled in a labo-ratory model vertical grinder (Brabender Type LST7170) to produce vital gluten. The vital gluten produced was stored in a deep freeze (–18°C) until subsequent use.
Rosehip. Rosehips were obtained from near fields
in Erzurum, Turkey. After rosehip pips were taken away, rosehips were cooled down to –18°C in a deep freeze for 48 h and were then freeze dried. Then the dried rosehips were milled in a laboratory model vertical grinder (Brabender Type LST7170). The ascorbic acid content was 850 mg/100 g of milled rosehip. The amount of ascorbic acid in the rosehip was determined according to the methods of AOAC (1984).
The levels and combinations of different materi-als used in this investigation are given in Table 1.
Baking procedure. The whole wheat bread
Sourdough was divided for all treatments and was stored in a deep freeze (–18°C) until subsequent use. All ingredients were put into a mixer (Stephan Um-5; Stephan, Erlangen, Germany) and mixed for 3 min at low speed (1500 rpm). The produced dough was left to rest for 15 min, divided (160 g), and kneaded. Then following a 30 min rest, the dough was degassed and aerated, and then left for resting for further 30 minutes. The pieces of dough were panned and proofed at 30°C and 70% RH for optimal dough development (190 min). The loaves were baked at 230°C for 25 minutes. The produced breads were wrapped up using polyethylene bags and stored at room temperature (20 ± 1°C) for 5 days.
Chemical and physical analyses. pH
measure-ments of the whole wheat breads were taken accord-ing to Elgün et al. (2002) with some modifications. Breads (10 g) were suspended in 100 ml of distilled water and the suspension was homogenised using an Ultra-Turrax TP 18/10 (Janke & Kunkel, IKA Werk, Staufen, Germany) at 2000 rpm for minute. Then pH values were measured using a pH meter (INOLAB pH 720; WTW, Weilheim, Germany). The total titratable acidity (TTA) was determined according to Özkaya and Kahveci (1990). The breads were weighed within 1 h following the baking; bread volumes were measured using rape grains and specific volumes were calculated (Lee et
al. 1982). Colour intensity of the bread crust was determined with the Minolta Colorimeter CR-200 (Minolta Camera Co., Osaka, Japan) (Elgün et al.
2002). All measurements were repeated three times.
Measurements of texture profile. The texture
analysis of whole wheat bread crumb was performed according to method descibed by Carr and Ta-dini (2003) using the texture profile analyser (TPA) (SMS model TA-XT plus; Stable Micro System, Ltd., Godalming, UK) with a 35 mm probe. The applica-tion condiapplica-tions of the TPA method were as follows: pre-test speed 2 mm/s, test speed 5 mm/s, post-test speed 5 mm/s, distance 20 mm, trigger type auto-20 g, and time 5 seconds. The calculation of the texture parameters was described as: firmness – the peak force during the first bite, (N); cohesiveness – area 2/area 1, (dimensionless); springiness – the ratio between the recovered height after the first com-pression and the original sample height; chewiness – firmness cohesiveness springiness (mJ).
Sensory evaluation of whole wheat bread. The
finished whole wheat breads were allowed to cool for 1 h at room temperature and then were evalu-ated using a nine-point hedonic scale as recom-mended by Land and Shepherd (1984), where 9 = like extremely, 5 = neither like nor dislike, and 1 = dislike extremely. Before the sensory testing, the loaves were sliced into 1.4-cm thick slices. The end slices were discarded, 4 × 4 cm squared pieces were taken from each slice and immediately placed into plastic boxes. A three-digit code number was assigned to each box. The sensory evaluation was performed by 30 untrained panelists (15 males and 15 females) who were either graduate students or staff members of the Department of Food Engineer-ing, Atatürk University (Turkey). The panelists were chosen using the following criteria: ages between 20 and 55, non-smokers, without reported cases of food allergies, whole wheat bread consumers. The panelists had some experience in sensory evalua-tion. The tests were performed in an isolated room with good illumination and natural ventilation. The panel members were asked to evaluate each loaf for grain, colour, and texture of the crumb, aroma, and general acceptability. They were also instructed to rinse their mouth with water after each whole wheat bread sample evaluation.
Statistical analysis. All the experiments were
[image:3.595.63.291.99.343.2]carried out in triplicate and in two different trials. Statistical evaluations were performed using the SPSS package (a completely randomised design procedure by SPSS) (SPSS for Windows Version 10.01; SPSS, Table 1. List of treatment combinations
Treatment Combinations in base of flour (%)
T0 100 WF
T1 97.5 WF + 2.5 G
T2 97.5 WF + 2.5 R
T3 99.5 WF + 0.5 DCSF
T4 98 WF + 2 MF
T5 95 WF + 2.5 R + 2.5 G T6 97 WF + 0.5 DCSF + 2.5 G T7 97 WF + 0.5 DCSF + 2.5 R T8 95.5 WF + 2 MF + 2.5 G T9 95.5 WF + 2 MF + 2.5 R T10 97.5 WF + 2 MF + 0.5 DCSF T11 94.5 WF + 0.5 DCSF + 2.5 R + 2.5 G T12 93 WF + 2 MF + 2.5 R + 2.5 G T13 95 WF + 2 MF + 0.5 DCSF + 2.5 G T14 95 WF + 2 MF + 0.5 DCSF + 2.5 R
T15 92.5 WF + 2 MF + 0.5 DCSF + 2.5 R +2.5 G
Chicago, USA). The differences between the data were tested using the Duncan’s range test (P < 0.05).
RESULTS AND DISCUSSION
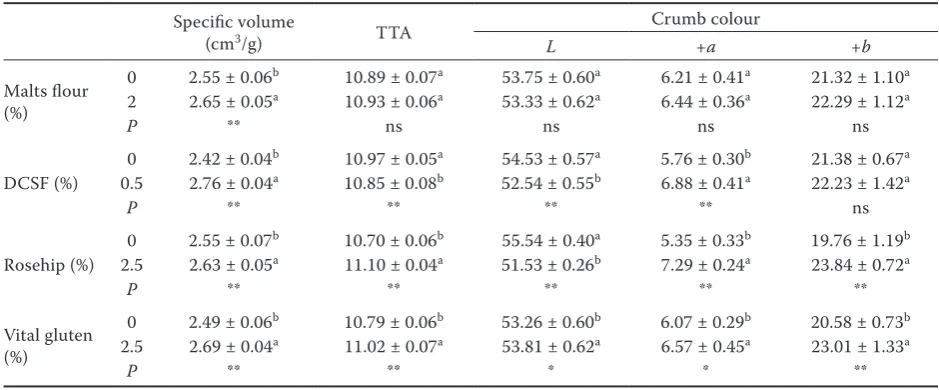
Whole wheat flour containing bran gives whole wheat bread a very low specific volume (Seyer & Gélinas 2009). The specific volume significantly increased with the addition of the plant origin ma-terials. Generally, lightness l values in whole wheat bread decreased with the addition of DCSF, R, and MF. That is, breads containing DCSF, R, and MF were darker than the control group (Table 2). This darkness could be due to the dark colour of the plant origin materials added. +a and +b colour values in-creased with DCSF, R, and G addition in whole wheat bread. The increase in +b value had no significant influence in whole wheat breads containing MF and DCSF. While the TTA values of whole wheat breads increased with the addition of MF, R, and G, they decreased with the addition of DCSF.
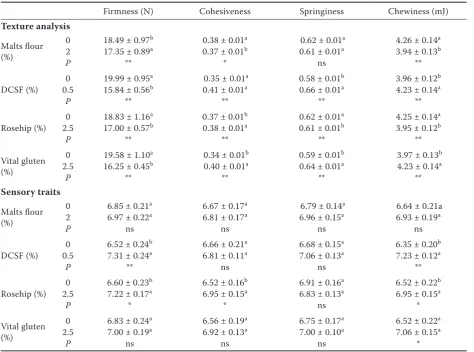
The results of the texture profile analysis (TPA) of whole wheat breads stored for 24 h at room temperature are shown in Table 3. The materials used in this study produced a significant effect on TPA parameters of whole wheat bread. The firmness of the breads decreased with the addition of MF, DCSF, R, and G, and the values obtained were smaller than those of their respective con-trols. The decrease in bread firmness was more
pronounced with DCSF addition. The firmness is an important factor in bakery products since it is strongly correlated with consumers’ perception of bread freshness (Onyango et al. 2010). The results also showed that springiness of whole wheat bread increased with the addition of DCSF and G, and it decreased with the addition of R. In general, high cohesiveness is desirable in bread because bread can form a bolus, rather than disintegrate, during mastication (Onyango et al. 2010). While the addition of MF and R significantly decreased the chewiness values of bread, the latter significantly increased with the addition of DCSF and G.
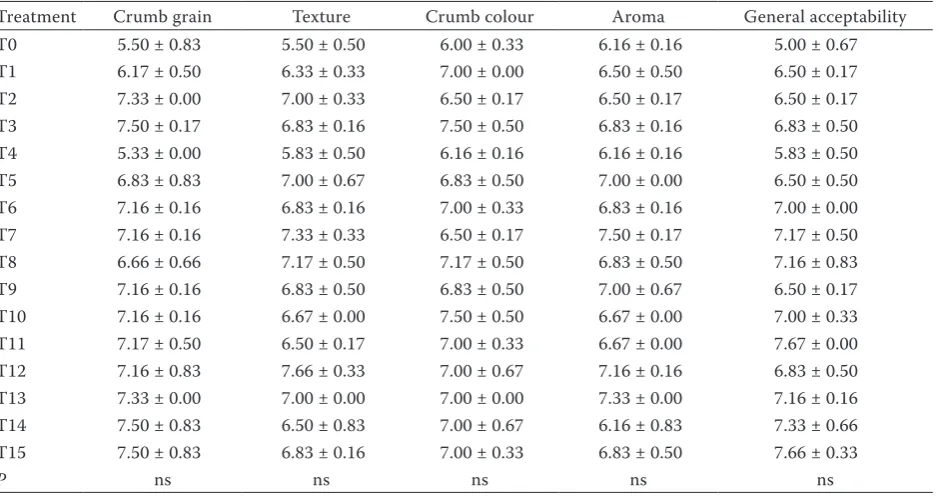
[image:4.595.62.532.531.726.2]In general, no significant differences were ob-served with the sensory attributes between crumb grain, crumb colour, texture, and aroma of whole wheat bread (Table 3). However, the materials added to the whole wheat bread samples were shown to have positive effects on all of the sensory attributes. At least, the materials used in this study did not have a negative effect on the product quality and consumers’ acceptance of whole wheat bread. The lightness l values of bread with the added materials were lower than that of control bread (Table 4). The addition of rosehip and DCSF de-creased crumb l colour value more than did vital gluten and malt flour. Therefore, crumb l colour value was lower in all treatments including rosehip and DCFS. However, the increase in darkness of bread crumb did not make a negative effect on consumers’ acceptability (Table 5). This darkness
Table 2. The general effects of malt, Cephalaria syriaca, rosehip, and vital gluten on the specific volume, total titrat-able acidity (TTA), and crumb colour values of whole wheat bread (mean ± SE)
Specific volume
(cm3/g) TTA l Crumb colour+a +b
Malts flour (%)
0 2.55 ± 0.06b 10.89 ± 0.07a 53.75 ± 0.60a 6.21 ± 0.41a 21.32 ± 1.10a
2 2.65 ± 0.05a 10.93 ± 0.06a 53.33 ± 0.62a 6.44 ± 0.36a 22.29 ± 1.12a
P ** ns ns ns ns
DCSF (%) 0 2.42 ± 0.04
b 10.97 ± 0.05a 54.53 ± 0.57a 5.76 ± 0.30b 21.38 ± 0.67a
0.5 2.76 ± 0.04a 10.85 ± 0.08b 52.54 ± 0.55b 6.88 ± 0.41a 22.23 ± 1.42a
P ** ** ** ** ns
Rosehip (%)
0 2.55 ± 0.07b 10.70 ± 0.06b 55.54 ± 0.40a 5.35 ± 0.33b 19.76 ± 1.19b
2.5 2.63 ± 0.05a 11.10 ± 0.04a 51.53 ± 0.26b 7.29 ± 0.24a 23.84 ± 0.72a
P ** ** ** ** **
Vital gluten (%)
0 2.49 ± 0.06b 10.79 ± 0.06b 53.26 ± 0.60b 6.07 ± 0.29b 20.58 ± 0.73b
2.5 2.69 ± 0.04a 11.02 ± 0.07a 53.81 ± 0.62a 6.57 ± 0.45a 23.01 ± 1.33a
P ** ** * * **
resulting from the addition of rosehip could be due to the dark red colour of rosehip. Also, it was reported that the addition of DCSF to wheat flour significantly decreased the l colour value of flour (Karaoğlu 2006) and bran bread (Karaoğlu 2011). The lowest l value was obtained in T15 treatment containing all of the materials. +a and +b colour values of whole wheat bread with the added materials changed significantly from 4.48 to 9.01 and from 16.62 to 31.74, respectively.
In general, +a and +b colour values of whole wheat bread with the added materials were higher than those of the control group. The highest +a colour value was obtained in T11 (0.5% DCSF + 2.5% R + 2.5% G), while the highest +b colour value was obtained in T13 (2% MF + 0.5% DCSF + 2.5% G).
The results of all sensory attributes evaluated are shown in Table 6. No significant differences were observed between the sensory attributes to crumb colour, crumb grain, texture, aroma, and
general acceptability. Crumb colour scores in-creased with the addition of the materials and the scores changed from 6.00 (T0) to 7.50 (T3, T10) in the treatments. The sensory evaluation scores of the treatments with the added materials were higher than those of the control (T0). While the highest crumb grain scores were determined in T14 and T15, it was the closest to the control in T4. The aroma scores were the lowest in T0, T4 and T14. The highest scores of general acceptability were obtained in T11, T15 and T7, respectively. However, T13 (2% MF + 0.5% DCSF + 2.5% G) had the highest hedonic mean scores in all of the sensory attributes tested.
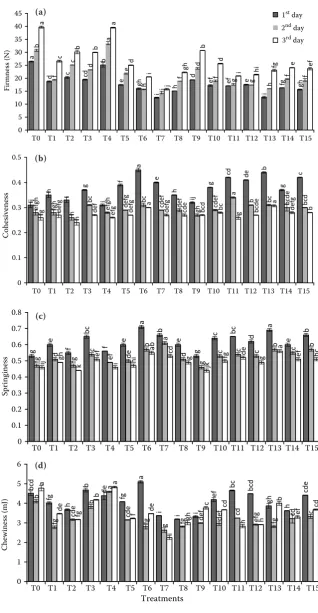
[image:5.595.63.538.113.465.2]Bread crumb firmness values with the addition of the materials changed from 12.50 N to 26.43 N after one day of the storage period (Figure 1a). The firmness values of whole wheat breads stored for one day were lower than those of control in all the treatments containing the plant origin materials. Table 3. The general effects of malt, Cephalaria syriaca, rosehip, and vital gluten on texture analysis values and sensory traits of whole wheat bread (mean ± SE)
Firmness (N) Cohesiveness Springiness Chewiness (mJ)
Texture analysis
Malts flour (%)
0 18.49 ± 0.97b 0.38 ± 0.01a 0.62 ± 0.01a 4.26 ± 0.14a
2 17.35 ± 0.89a 0.37 ± 0.01b 0.61 ± 0.01a 3.94 ± 0.13b
P ** * ns **
DCSF (%) 0 19.99 ± 0.95
a 0.35 ± 0.01a 0.58 ± 0.01b 3.96 ± 0.12b
0.5 15.84 ± 0.56b 0.41 ± 0.01a 0.66 ± 0.01a 4.23 ± 0.14a
P ** ** ** **
Rosehip (%) 0 18.83 ± 1.16
a 0.37 ± 0.01b 0.62 ± 0.01a 4.25 ± 0.14a
2.5 17.00 ± 0.57b 0.38 ± 0.01a 0.61 ± 0.01b 3.95 ± 0.12b
P ** ** ** **
Vital gluten (%)
0 19.58 ± 1.10a 0.34 ± 0.01b 0.59 ± 0.01b 3.97 ± 0.13b
2.5 16.25 ± 0.45b 0.40 ± 0.01a 0.64 ± 0.01a 4.23 ± 0.14a
P ** ** ** **
Sensory traits
Malts flour (%)
0 6.85 ± 0.21a 6.67 ± 0.17a 6.79 ± 0.14a 6.64 ± 0.21a
2 6.97 ± 0.22a 6.81 ± 0.17a 6.96 ± 0.15a 6.93 ± 0.19a
P ns ns ns ns
DCSF (%) 0 6.52 ± 0.24
b 6.66 ± 0.21a 6.68 ± 0.15a 6.35 ± 0.20b
0.5 7.31 ± 0.24a 6.81 ± 0.11a 7.06 ± 0.13a 7.23 ± 0.12a
P ** ns ns **
Rosehip (%) 0 6.60 ± 0.23
b 6.52 ± 0.16b 6.91 ± 0.16a 6.52 ± 0.22b
2.5 7.22 ± 0.17a 6.95 ± 0.15a 6.83 ± 0.13a 6.95 ± 0.15a
P * * ns *
Vital gluten (%)
0 6.83 ± 0.24a 6.56 ± 0.19a 6.75 ± 0.17a 6.52 ± 0.22a
2.5 7.00 ± 0.19a 6.92 ± 0.13a 7.00 ± 0.10a 7.06 ± 0.15a
P ns ns ns *
This finding indicates that the addition of the ma-terials improves the quality of whole wheat bread. As expected, the firmness values of whole wheat bread crumb increased, with increasing time
[image:6.595.64.534.101.362.2]stor-age. However, this increase was generally slower in the treatments containing the additional materials than in that without the materials (T0). While the lowest firmness values were obtained in T6 (0.5% Table 4. Effect of treatments (T) on acidity (TTA) and colour values of whole wheat bread (mean ± SE)
Treatment TTA Crumb colour
l +a +b
T0 10.55 ± 0.05g 57.10 ± 0.08a 4.73 ± 0.01e 18.92 ± 0.02defgh
T1 11.10 ± 0.10bcd 56.35 ± 0.03abc 4.53 ± 0.17 e 18.74 ± 0.31defgh
T2 11.00 ± 0.00cde 52.04 ± 0.09ef 7.27 ± 0.05bc 24.37 ± 0.10bc
T3 10.60 ± 0.00g 54.38 ± 0.53d 5.22 ± 0.19de 17.14 ± 0.12gh
T4 10.80 ± 0.00f 56.64 ± 0.29abc 4.79 ± 0.30e 19.10 ± 1.54defgh
T5 11.25 ± 0.05ab 52.76 ± 0.31e 6.63 ± 0.07cd 23.67 ± 0.55bcd
T6 10.45 ± 0.05g 55.57 ± 0.30bcd 5.26 ± 0.07de 17.31 ± 0.08fgh
T7 10.95 ± 0.05def 50.90 ± 0.82fg 7.00 ± 0.16c 22.28 ± 0.42cdefg
T8 10.85 ± 0.05ef 56.78 ± 0.44ab 4.48 ± 0.17e 18.51 ± 0.31efgh
T9 11.15 ± 0.05bc 51.86 ± 0.55ef 6.97 ± 0.10c 23.82 ± 0.01bcd
T10 10.45 ± 0.05g 52.21 ± 0.18ef 5.12 ± 0.10e 16.62 ± 0.04h
T11 11.25 ± 0.05ab 50.85 ± 0.80fg 9.01 ± 1.72a 28.12 ± 6.09ab
T12 11.05 ± 0.05cd 52.71 ± 0.25ef 6.67 ± 0.13cd 23.88 ± 0.20bcd
T13 10.85 ± 0.05ef 55.30 ± 0.58cd 8.69 ± 0.27ab 31.74 ± 0.44a
T14 10.85 ± 0.05ef 50.92 ± 0.31fg 7.50 ± 0.10bc 22.43 ± 0.26cdef
T15 11.40 ± 0.00a 50.18 ± 0.29g 7.29 ± 0.17bc 22.17 ± 0.11cdefg
P ** ** ** **
TTA is reported as ml NaOH (0.1 N)/10 g bread; means with different letters in the same column are statistically significant; **P < 0.01; n = 2
Table 5. Effect of treatments (T) on sensory traits of whole wheat bread (mean ± SE)
Treatment Crumb grain Texture Crumb colour Aroma General acceptability T0 5.50 ± 0.83 5.50 ± 0.50 6.00 ± 0.33 6.16 ± 0.16 5.00 ± 0.67 T1 6.17 ± 0.50 6.33 ± 0.33 7.00 ± 0.00 6.50 ± 0.50 6.50 ± 0.17 T2 7.33 ± 0.00 7.00 ± 0.33 6.50 ± 0.17 6.50 ± 0.17 6.50 ± 0.17 T3 7.50 ± 0.17 6.83 ± 0.16 7.50 ± 0.50 6.83 ± 0.16 6.83 ± 0.50 T4 5.33 ± 0.00 5.83 ± 0.50 6.16 ± 0.16 6.16 ± 0.16 5.83 ± 0.50 T5 6.83 ± 0.83 7.00 ± 0.67 6.83 ± 0.50 7.00 ± 0.00 6.50 ± 0.50 T6 7.16 ± 0.16 6.83 ± 0.16 7.00 ± 0.33 6.83 ± 0.16 7.00 ± 0.00 T7 7.16 ± 0.16 7.33 ± 0.33 6.50 ± 0.17 7.50 ± 0.17 7.17 ± 0.50 T8 6.66 ± 0.66 7.17 ± 0.50 7.17 ± 0.50 6.83 ± 0.50 7.16 ± 0.83 T9 7.16 ± 0.16 6.83 ± 0.50 6.83 ± 0.50 7.00 ± 0.67 6.50 ± 0.17 T10 7.16 ± 0.16 6.67 ± 0.00 7.50 ± 0.50 6.67 ± 0.00 7.00 ± 0.33 T11 7.17 ± 0.50 6.50 ± 0.17 7.00 ± 0.33 6.67 ± 0.00 7.67 ± 0.00 T12 7.16 ± 0.83 7.66 ± 0.33 7.00 ± 0.67 7.16 ± 0.16 6.83 ± 0.50 T13 7.33 ± 0.00 7.00 ± 0.00 7.00 ± 0.00 7.33 ± 0.00 7.16 ± 0.16 T14 7.50 ± 0.83 6.50 ± 0.83 7.00 ± 0.67 6.16 ± 0.83 7.33 ± 0.66 T15 7.50 ± 0.83 6.83 ± 0.16 7.00 ± 0.33 6.83 ± 0.50 7.66 ± 0.33
P ns ns ns ns ns
[image:6.595.66.536.491.740.2]a
d c cd
b
e gh
i h
d
ef ef e
i fg gh b f c d a e
h i f
d
f g g
h f f a c b b a d i j gh b d
i hi fg e ef
0 5 10 15 20 25 30 35 40 45 Firmness (N)
1st day
3rd day 2nd day
[image:7.595.62.381.77.691.2]T0 T1 T2 T3 T4 T5 T6 T7 T8 T9 T10 T11 T12 T13 T14 T15
Figure 1. Effect of treatments on (a) firmness values, (b) cohesiveness values, (c) springiness values, and (d) chewi-ness values of whole wheat bread
ij
h i g
j f a e h ij g
cd de b
g c ef gh fg h h bc ef
gh defg bc cdef def
gh cd
ef a b bc bcde bcd fg def
g
h de
f
ef
g defg a defg cde bcd bc g bcde a def
g b 0 0.1 0.2 0.3 0.4 0.5
T0 T1 T2 T3 T4 T5 T6 T7 T8 T9 T10 T11 T12 T13 T14 T15
Cohesiveness g e f bc f e a b e g
c bc d a
e b
fg d fg
c
ef de
b a
d
g
c c c b c b
ij gh k ef i hi
ab cd
g
jk
fg de g a ef bc
0 0.1 0.2 0.3 0.4 0.5 0.6 0.7 0.8 Springiness
T0 T1 T2 T3 T4 T5 T6 T7 T8 T9 T10 T11 T12 T13 T14 T15
bc d fg h b de fg a
i i i
ef bc bc
d
gh h cd
e b fg cd e b a cd e
fg g fg de
f
de
f cd
ef
g
fg cd c
a de fg b a f de i gh c cd h h b ef cd 0 1 2 3 4 5 6 Chewiness (mJ)
T0 T1 T2 T3 T4 T5 T6 T7 T8 T9 T10 T11 T12 T13 T14 T15
Treatments (a)
(b)
(c)
(d)
DCSF + 2.5% G), T7 (0.5% DCSF + 2.5% R) and T13 (2% MF + 0.5% DCSF + 2.5% G), the highest values were obtained in T0 (control) and T4 (2% MF). On the other hand, while the highest specific volume was determined in T6, T7, T13, and T14, the
as well as the improvement in the crumb charac-teristics. It was been stated that the increased loaf volume is directly related to the decreased firmness values which is due to an increased probe-to-crust distance as the loaf volume increased (Wanga et al. 2002; Yamsaengsung et al. 2010). Looking at the materials in the treatments, it can be stated that DCSF and vital gluten have positive effects on both the crumb firmness and the loaf volume.
The internal resistance of bread crumb is evalu-ated by cohesiveness which is a characteristic of mastication. Cohesiveness is defined as how well the product withstands a second deformation rela-tive to how it behaved under the first deformation (Wang et al. 2006). In general, cohesiveness in bread samples increased with the addition of the materials (Figure 1b). The cohesiveness values in all treatments containing additional materials were higher than those of the control within 1 day of storage time. The highest 1st day cohesiveness value was obtained in T6 and it was the lowest in T0. Co-hesiveness in whole wheat bread samples decreased at different rates with the increasing storage time. This decrease in cohesiveness indicates increased susceptibility of the bread to fracture or crumble. Springiness is a measurement of how much the bread crumb springs back after being compressed once and it can be defined as the elasticity of the bread crumb; it is also an important parameter to determine the staling degree of bread (Karaoğlu
et al. 2008; Tian et al. 2009). Similar to the results of firmness and cohesiveness, T6 and T13 gave the highest 1st day springiness (Figure 1c). In general, springiness of bread decreased more significantly as the storage time increased from 1 to 3 days. However, when the storage time increased from 3 to 5 days, the decrease in springiness reached a lower extent.
Chewiness is related to the work needed to chew a solid sample such as bread to a steady state of swallowing. The crumb chewiness is a product of the crumb firmness, cohesiveness and springiness. In general, a decreasing tendency in chewiness for 3rd day of the storage time was followed by an increase in 5th day of the storage time (Figure 1d). While the highest chewiness value was determined in T6 (0.5% DCSF + 2.5% G) for 1 day storage, it was the lowest in T8 (0.5% DCSF + 2.5% R). The crumb chewiness of bread produced by differ-ent treatmdiffer-ents changed in differdiffer-ent ways with increasing storage time. Chewiness is one of the texture parameters easily correlated with sensory analyses through the panels (Esteller et al. 2004; Gomez et al. 2007). The chewiness values of bread crumb produced significant negative correlation with sensorial properties in this study (data not shown). Chewiness is a parameter dependent on firmness. Therefore, chewiness values of bread generally followed a similar trend as firmness.
[image:8.595.66.366.84.260.2]Despite the benefits of consuming whole wheat bread, the consumers’ acceptance of this product is limited due to its lower volume, coarser texture, and faster staling compared to refined wheat bread. The bread volume is related to the quantity and quality of gluten (Chloupek et al. 2008; Rosell et al. 2009). Bread volume is measured as one of the most important criteria in evaluating bread quality (Yamsaengsung et al. 2010). Our study showed that the specific volume values of whole wheat bread were increased by the additional materials (Figure 2). While the highest specific volume was determined in T13, it was the lowest in control (T0). The change in specific volume of whole wheat bread was similar to that of firmness. Karaoğlu (2011), who determined an increase effect in specific volume, made similar Figure 2. Effect of treatments on specific volume values of whole wheat bread
k g
i g j g
b b
de h f
d e
a b
c
0.0 0.5 1.0 1.5 2.0 2.5 3.0 3.5
Specific volume (cm
3/g)
T0 T1 T2 T3 T4 T5 T6 T7 T8 T9 T10 T11 T12 T13 T14 T15
observations for DCSF. It is known that bread volume improves due to gas retention ability of vital gluten and the amylolytic activity of malt flour.
CONCLUSION
It could be concluded from the overall results that the addition of different plant origin materials created a positive influence on the product quality and consumers’ acceptance. The firmness decreased with the addition of MF, DCSF, R, and G. After stor-age for 1 day at room temperature, treatment T6 (0.5% DCFS + 2.5% G) gave the highest cohesive-ness, springicohesive-ness, and chewiness values. The highest specific volume value was obtained in the treatment (T13) containing 0.5% DCSF, 2% MF, and 2.5% vital gluten. Whole wheat bread samples produced with the addition of the materials were also considered acceptable by the sensory panel. In addition, the addition of materials showed a positive effect on the general acceptability values of the bread samples. The quality of the final products revealed that the use of plant origin materials as improvement agents is well suited in whole wheat bread making.
References
AOAC (1984): Officials Methods of Analysis. 14th Ed.
As-sociation of Official Analytical Chemist, Arlington. Carr L.G., Tadini C.C. (2003): Influence of yeast and
veg-etable shortening on physical and textural parameters of frozen part baked French bread. LTW-Food Science and Technology., 36: 609–614.
Chloupek O., Both Z., Dostál V., Hrstková P., Středa T., Betsche T., Hrušková M., Horáková V. (2008): Better bread from vigorous grain? Czech Journal of Food Sciences, 26: 402–412.
Day L., Augustin L.A., R. Pearce J.P., Batey I.L., Wrig-ley C.W. (2009): Enhancement of gluten quality combined with reduced lipid content through a new salt-washing process. Journal of Food Engineering, 95:365–372 Elgün A., Ertugay Z., Certel M., Kotancilar H.G.
(2002): Pp.245.Guide book for analytical quality control and laboratory for cereal and cereal products. Publication No. 335. Atatürk University, Erzurum.
Ercisli S. (2007): Chemical composition of fruits in some rose (rosa spp.) species. Food Chemistry, 104: 1379–1384. Esteller M.S., Pitombo R.N.M., Lannes S.C.S. (2005):
Effect of freeze-dried gluten addition on texture of ham-burger buns. Journal of Cereal Science,41: 19–21.
Ghorbel R.E., Kamoun A., Neifar M., Chaabouni S.E. (2010): Optimization of new flour improver mixing for-mula by surface response methodology. Journal of Food Process Engineering, 33: 234–256.
Gómez M., Ronda F., Caballero P.A, Blanco C.A., Ro-sell C.M. (2007): Functionality of different hydrocolloids on the quality and shelf-life of yellow layer cakes. Food Hydrocolloids, 21: 167–173.
Hrušková M., Švec I., Kučerová I. (2003): Effect of malt flour addition on the rheological properties of wheat fermented dough. Czech Journal of Food Sciences, 21: 210–218.
Jood S., Schofield D., Tsiami A., Bollecker S. (2001): Effect of glutenin subfractions on bread-making qual-ity of bread. International Journal of Food Science and Technology, 36: 573–584.
Karaoğlu M.M. (2006): Cephalaria syriaca addition to wheat flour dough and effect on rheological properties. International Journal of Food Science and Technology,
41: 37–46.
Karaoğlu M.M. (2011): Influence of Cephalaria syriaca
addition on physical and sensorial properties of wheat bran bread. Journal of Food Properties, 14: 124–133. Karaoğlu M.M. Kotancilar H.G., Gerçekaslan K.E.
(2008): The effect of par-baking and frozen storage time on the quality of cup cake. International Journal of Food Science and Technology, 43: 1778–1785.
Land D.G., Shepherd R. (1984): Scaling and ranking meth-ods. In: Piggott J.R.(ed.): Sensory Analysis of Food. Elsevier Applied Science, London: 141–177.
Lasekan O., Chiemela C., Ossai B., Adzahan N.M. (2011): Effect of different pineapple juice (ananas co-mosus l.) Preparations on the microstructure, staling and textural properties of wheat bread. Journal of Food Process Engineering, 34: 1449–1463.
Lee C.C., Hoseney R.C., Varriona-Martson E. (1982): Development of a laboratory-scale single-stage cake mix. Cereal Chemistry, 59: 389–392.
Noort M.W.J, Haaster D., Hemery Y., Schols H.A., Hamer R.J. (2010): The effect of particle size of wheat bran fractions on bread quality – Evidence for fibre-protein interactions. Journal of Cereal Science, 52: 59–64. Odumodu C.U. (2008): Effects of malt addition and fer-mentation on sensory characteristics of formulated cereal based complementary food. Pakistan Journal of Nutrition,
7: 321–324.
Onyango C., Mutungi C., Unbehend G., Meinolf G., Lindhauer M.G. (2010): Rheological and baking char-acteristics of batter and bread prepared from pregelati-nised cassava starch and sorghum and modified using microbial transglutaminase. Journal of Food Engineering,
Corresponding author:
Dr Hüseyin Boz, Narman Vocational High School, Food Technology Department, 25300, Narman⁄Erzurum, Turkey; E-mail: [email protected]
Özkaya H., Kahveci B. (1990): Analyses Methods in Cereal and Cereal Product. Association Publications of Food Technology, No. 14. Ankara: 152..
Poinot P., Arvisenet G., Grua-Priol J., Fillonneau C., Mezaize S., Delam Ballerie M., Le-Bail A., Prost C. (2009): Advances in the understanding of the chemical reactions responsible for bread flavour quality.Czech Journal of Food Sciences, 27 (Special Issue): S54–S57. Rosell C.M., Santos E., Penella J.M.S., Haros M.
(2009). Wholemeal wheat bread: A comparison of differ-ent bread making processes and fungal phytase addition. Journal of Cereal Science, 50: 272–277.
Seyer M.E, Gélinasy P. (2009): Bran characteristics and wheat performance in whole wheat bread. International Journal of Food Science and Technology, 44: 688–693. Shenoy H.A., Prakash J. (2002): Wheat Bran (Triticum
aestivum): Composition, functionality and incorporation in unleavened bread. Journal of Food Quality, 25: 197–211.
Sullivan P., O’Flaherty J., Brunton N., Arendt E., Gallagher G. (2011): The utilisation of barley middlings to add value and health benefits to white breads. Journal of Food Engineering, 105: 493–502.
Tian Y.Q., Li Y., Jin Z.Y., Xu X.M., Wang J.P., Jiao A.Q., Yu B., Talba T. (2009): β-cyclodextrin (β-CD): A new ap-proach in bread staling. Thermochimica Acta,489: 22–26. Wang R., Zhou W., Yu H.H., Chow W.F. (2006): Effects
of gren tea extract on the quality of bread made from unfrozen and frozen dough process. Journal of the Sci-ence of Food and Agriculture, 86: 857–864.
Wanga J., Rosella C.M., Barbera C.B. (2002): Effect of the addition of different fibres on wheat dough perfor-mance and bread quality. Food Chemistry, 79: 221–226. Yamsaengsung R., Schoenlechner R., Berghofer E.
(2010): The effects of chickpea on the functional proper-ties of white and whole wheat bread. International Journal of Food Science and Technology, 45: 610–620.