University of Warwick institutional repository:
http://go.warwick.ac.uk/wrap
A Thesis Submitted for the Degree of PhD at the University of Warwick
http://go.warwick.ac.uk/wrap/50195
This thesis is made available online and is protected by original copyright.
Please scroll down to view the document itself.
Development and characterisation of traceable force
measurement for nanotechnology
by
Christopher Weir Jones MSci (Hons) ARCS
Thesis
Submitted to the University of Warwick
in partial fulfilment of the requirements
for admission to the degree of
Doctor of Philosophy
School of Engineering
July 2012
Contents
List of Tables
List of Figures
Acknowledgments
Declarations
Abstract
Abbreviations
List of publications by the author
Chapter 1 Introduction and context of low force metrology
1 .1 Overview and motivation
1.2 Objectives . . .
1 .3 Outline of thesis
Chapter 2 Background
2.1 Context and motivation for a low force facility
v
vii
xviii
xix
xx
xxi
xxii
1
2
3
5 5 2.2 A brief history of low force measurement at the National Physical Laboratory. 7
2.3 A direction for traceable low force metrology at NPL . 17
2.4 Precedent for the NPL low force facility 19
Chapter 3 The NPL Low Force Balance
3.1 The design of the Low Force Balance
39
40 3.2 AC modulation of the LFB drive signal to mitigate surface charging effects 44 3.3 Development of a fringe counter for the z interferometer. 47
3.4 Vibration isolation of LFB . . . 50
3.5 Capacitance gradient determination 53
3.6 Voltage measurement approach 55
3.7 Indentation mode LFB operation 56
3.8 LFB platen and effective LFB stiffness 58
3.9 Performance verification by comparison with mass standards . 60 3.10 Performance verification by international comparison with low force standards
at other NMls . . . 64
3.11 Summary of development 81
Chapter 4 Requirements for a successful low force transfer artefact 84
4.1 Calibration of artefacts on LFB . . . 85 4.2 Calibration of stiff target instruments using a compliant transfer artefact 86 4.3 Calibration of compliant target instruments using a compliant transfer artefact 88
4.4 Calibration of stiff artefacts on LFB 90
4.5 Other general constraints 91
4.6 Summary. . . 95
Chapter 5 Review of the state-of-the-art in transfer artefact design 96
5.1 Flexure design . . . 97 5.2 Force (or strain) detection and actuation mechanisms . 106
5.3 Summary of useful artefact fabrication techniques. 125
Chapter 6 Optimisation of transfer artefact flexure design by modelling 131
6.1 Overview of chapter . . . 131
6.2 Development of models for the triskelion . 133
6.3 Prototype artefact development 144
6.4 Prototype artefact evaluation . 171
6.5 Conclusions . . . 182
Chapter 7 Optimisation of instrumentation and control for the artefacts 185
7.1 Overview of chapter 185
7.2 Background theory . 186
7.3 Sensor circuit development. 189
7.4 Verification experiments 214
7.5 Conclusions . . . 221
Chapter 8 Conclusions 223
8.1 Achievement of objectives 223
8.2 Overall conclusions. 227
8.3 Recommendations . 228
Chapter 9 Recommendations for a future working low force transfer artefact 229
9.1 Overview of recommended design 229
9.2 Flexure fabrication . . . 229
9.3 Flexure dimensions and related performance 230
9.4 Piezoresistive sensors and control electronics . 232
9.5 Interpretation of signals 232
9.6 Packaging . . . 233
9.7 External motion stage requirements 234
9.8 Uncertainty in operation 235
Appendix A Summary of surface interaction forces 238
Appendix B Analytical model of triskelion flexure mechanics: MATLAB code 240
Bibliography 247
List of Tables
3.1 Summary of drive signals for the LFB under AC operation. . . .. 45
3.2 Material properties required for Hertzian compression model of LFB-artefact contact. . . .. 60
3.3 Manufacturer specification for the FMT-400 sensor. (*) Calculated with as-sumptive deflection of 10% and the lowest force constant. (t) Dependent on the bias voltage (Vbridge) that is applied to the series resistance of sensor and reference. . . .. 67
3.4 Combined uncertainty in measurements of ZK. The uncertainty in Znano is do-minated by the closed loop repeatability ..
3.5 Combined uncertainty in estimate of kK .
3.6 Combined uncertainty in estimate of SK.
3.7 Summary of results and uncertainties in the NPL estimates of the stiffness 73
78
81
and force sensitivity of the Kleindiek cantilever artefact #3. . . .. 82
5.1 Summary of methods for determining a cantilever spring constant: dimensio-nal methods (adapted from [1,2]) . . . .. 99
5.2 Summary of methods for determining a cantilever spring constant: static ex-perimental methods (adapted from [1,2]) . . . 100
5.3 Summary of methods for determining a cantilever spring constant: dynamic
experimental methods (adapted from [1,2]) 101
5.4 Summary of findings of review. . . 127
6.2 Summary of result of application of the previously described finite element and analytical models to the parameter sets in table 6.1. Note that the analytical model would produce meaningless values for model "I" identical to those for model "A", due to the identical beam geometry. As the arms are no longer rigid for this structure, the analytical model would clearly break down. . . . . 156
6.3 Comparative analysis of vertical stiffnesses from the two models, and corres-ponding relative dimensional values as multiples of Artefact A's A, Land T values (SA, SL and ST respectively).. . . 157
6.4 Comparative analysis of lateral stiffness derived from FE and analytical mo-delling techniques. . . 165
6.5 Summary of defects to artefacts considered in chapter 6 173
6.6 Difference in thickness between specified and actually fabricated devices. 174
6.7 Exemplary calculation of uncertainty in measurement of artefact spring constant, for artefact B. . . .. 180
6.8 Summary of spring constant estimates for all mechanically-tested artefacts 181
6.9 Comparison of modelled and experimentally obtained spring constant esti-mates for three artefacts. Ratios are defined to simplify comparison. . . 182
7.1 The spread of maximum resonance amplitudes acheived for the set of sensors and actuators. Since all use the same flexure, the results indicate the quality of each sensor and actuator. . . 192
7.2 Overview of initial experiments undertaken on artefact D to evaluate the sta-bility of the displacement sensitivity. . . 216
7.3 Summary of experiments to determine the dependence of artefact sensitivity upon rate of vertical deflection. . . 220
List of Figures
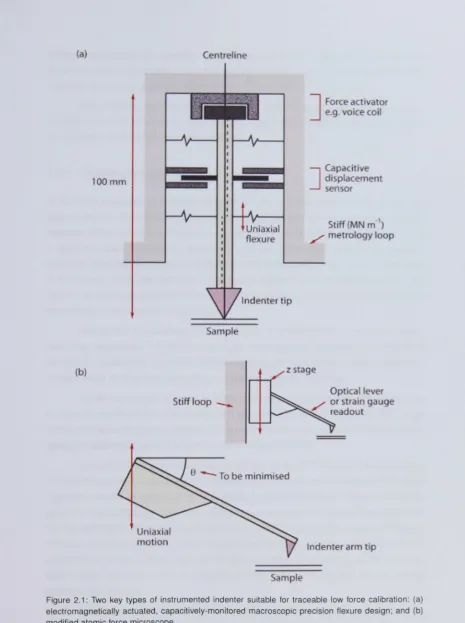
2.1 Two key types of instrumented indenter suitable for traceable low force cali-bration: (a) electromagnetically actuated, capacitively-monitored macroscopic precision flexure design; and (b) modified atomic force microscope.
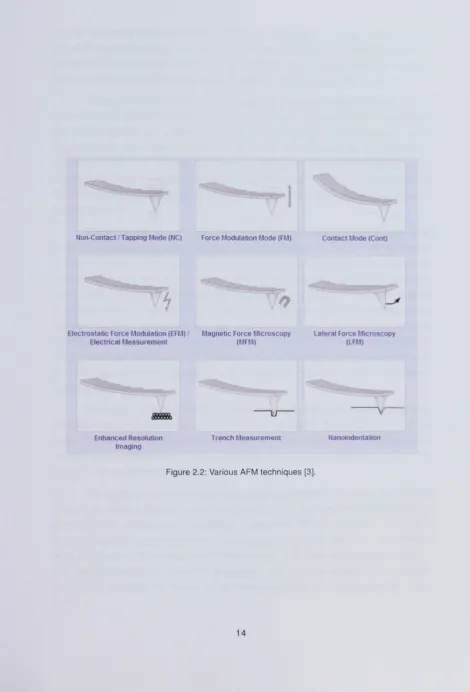
2.2 Various AFM techniques [3). . . .
12
14 2.3 Schema of NPL microprobe and an image of a fully assembled device (from [4)) 17
2.4 Traceability of the newton to fundamental constants of nature, in terms of practical realisations in which base units may be dependent on derived units. 21
2.5 Schematic diagram of the NIST EFB, from [5). Labelled components are as follows: Schematic of balance components: (1) parallelogram balance, (2) dif-ferential plane mirror interferometer, (3) main inner electrode (cross-section), (4) main outer electrode (cross-section), (5) vacuum chamber, (6) optical table, (7) granite foundation block, (8) heterodyne laser light source, (9) mass lift and (10) counterweight. . . 23
2.6 Comparator mass balance schematic diagram (from [6)) 25
2.7 Schematic overview of the mass comparator primary force balance concept.. 26
2.8 Computer model of the NPL electrical nanobalance device. The area shown is 980 ~m x 560 ~m. Dimensions perpendicular to the plane have been ex-panded by a factor of twenty for clarity. Taken from [7). . . . 30
2.9 NPL LEN for lateral force calibration, from [8). Inset in the expanded view is a side-on view of the 1 0 ~m thick structure of the device. . . .. 31
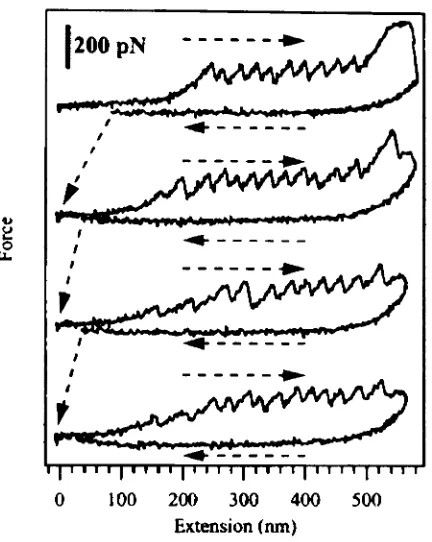
2.11 Four consecutive extension-force curves on a single titin molecule using a 'small' (length - 10 11m) cantilever. All extension curves were acquired at a pulling rate of 30 mms-1 to 39 mms-1, which is an order of magnitude faster than previously performed with conventional cantilevers. System was left at rest for thirty seconds between pulls to allow protein to refold (from [10]). . 35
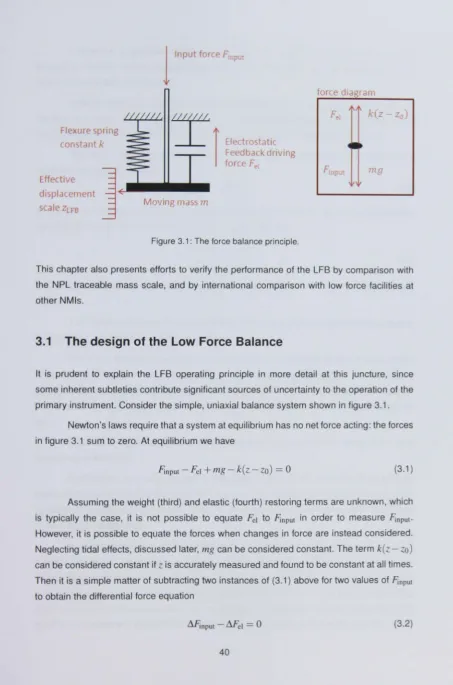
3.1 The force balance principle. . . 40
3.2 Schematic diagram of the LFB. . 42
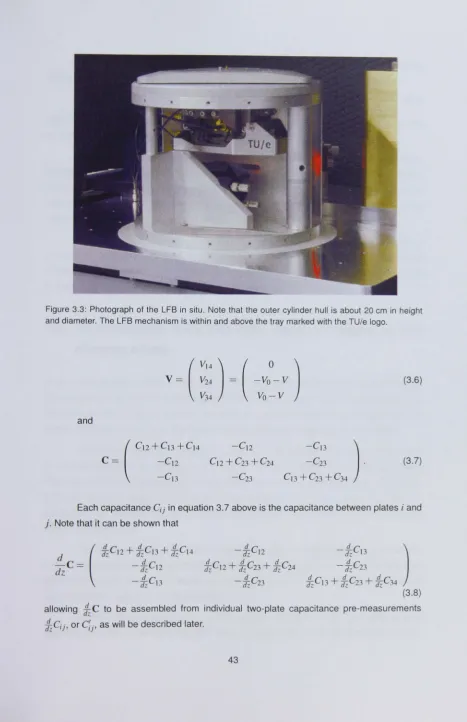
3.3 Photograph of the LFB in situ. Note that the outer cylinder hull is about 20 cm in height and diameter. The LFB mechanism is within and above the tray mar-ked with the TUle logo. . . 43
3.4 Sign convention used in the work with phase-locked AC signals 45
3.5 Schematic diagram of capacitor plate numbering system. . . 45
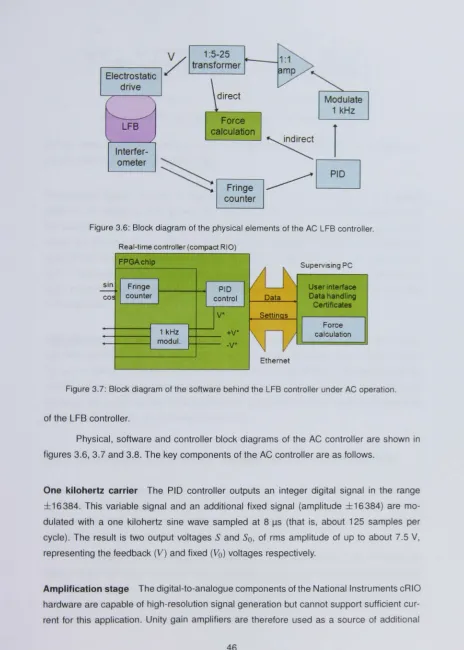
3.6 Block diagram of the physical elements of the AC LFB controller. 46 3.7 Block diagram of the software behind the LFB controller under AC operation. 46 3.8 Control diagram of the LFB controller under AC operation. . . . 47
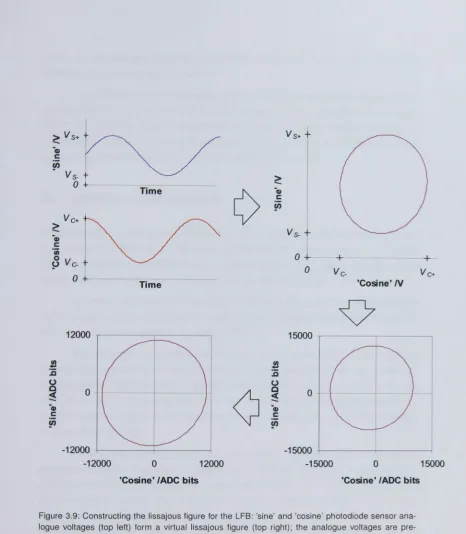
3.9 Constructing the lissajous figure for the LFB: 'sine' and 'cosine' photodiode sensor analogue voltages (top left) form a virtual lissajous figure (top right); the analogue voltages are pre-amplified, normalised using an intensity refe-rence, offset and read using ADCs. The software signals are offset to recentre the final ellipse. The deviation from circular, resulting from interfometer sensor misalignment, produces a periodic error in the final displacement signal. . .. 49
3.10 Oualitative comparison of raw data for different vibration isolation unit (AI) and acoustic chamber (AC) state under the 'quiet background' (OB) condition. The OB reference assumes constant noise amplitudes from nosie sources in the laboratory, primarily the environmental handling system. Interferometer noise is given in terms of lissajous figure phase, where 0.1 rad is approximately 2.5 nm balance displacement. . . . . 51
3.11 A modified arrangement of the LFB system components to mitigate heating within the acoustic enclosure. . . . 52
3.12 Non-linearities in C~-l after simple linear fit. The vertical axis is in attofarads; the horizontal axis in micrometres, in software engineering notation. . . . .. 55
3.14 Details of the platen used for the comparison: (a) ruby sphere attached to brass collar - note the slight assymmetric setting due to the W-section centre ring; (b) a size comparison between the Kleindiek cantilever (approximated) and various sphere sizes; and (c) an early concept of the sphere platen, with V-section and dimensions not optimised for fabrication and handling. Also shown to approximate scale in (c) is a sketch of the mass platen used in section 3.9. . . .. 59
3.15 Results of experiments to determine the weight of a 2.91 mg mass artefact using the LFB: (top) absolute forces readings on the ±361lN LFB force scale, with setpoint changes, and (bottom) the measured weight over time, ignoring off-scale outliers... . . .. 65
3.16 Comparison of artefact weight estimates via mass/gravity and electrostatic force (LFB) routes. The uncertainty in the mass estimate is too small to show clearly on this scale. . . .. 66
3.17 The Kleindiek FMT-400 Sensor, a commercial cantilever-format piezoresistive force sensor. (from [11]) . . . .. 67
3.18 Schema of mechanical arrangement for calibration of the Kleindiek cantilever. 69
3.19 Overview of information flow in mass-traceable calibration of the Kleindiek cantilever. . . .. 70
3.20 Residuals to linear fit of LFB interferometer fit to Nanocube target position over a range of target positions. . . .. 72
3.21 Raw Kleindiek calibration data: LFB force output versus Nanocube target po-sition. . . .. 74
3.22 Raw Kleindiek calibration data: cantilever output signal versus Nanocube tar-get position. . . . 75
3.23 Raw Kleindiek calibration data: cantilever output signal versus LFB force output. 75
3.24 Force drift as zeroth order term in linear fit of LFB force to nanocube position. 76
3.25 Cantilever stiffness estimates as first order term in linear fit of LFB force to nanocube position. . . 77 3.26 Residuals in linear fit of LFB force to (change in) nanocube position. 77 3.27 Collated plot of cantilever sensor output versus applied force, for all 15 runs. 79
3.29 Cantilever force sensitivity estimates as first order term in linear fit of artefact sensor output signal to LFB force. . . .. 80
4.1 Schema of calibration of compliant artefact on LFB. 86
4.2 Cartoon of measurement loop deflection. . . 87
4.3 Schematic diagram of use of transfer artefact to calibrate a stiff target instru-ment. . . .. 87
4.4 Schema of calibration of a compliant target with a passive transfer artefact of
similar stiffness. 89
4.5 Schema of calibration of a compliant target with an active (pushing) transfer artefact of similar stiffness. . . 89
4.6 Schematic of stiff artefact calibration on LFB using secondary flexure 91
5.1 Experimental prototype reference cantilever array - plan view (from [12]) . . . 103
5.2 Commercially available AFM 'calibration' cantilevers from Bruker, formerly Veeco Probes: photograph of the three cantilevers, with quoted nominal spring constants of 0.157 N m-1, 1.3 N m-1 and 10.4 N m-1 (left) and a side view of one canti-lever (right) (from [13]). . . 103
5.3 The NPL triskelion form, with nomenclature used in this and related docu-ments. The hub and arms are nominally non-compliant (achieved through ex-tra thickness on these portions) concenex-trating deflection in the outer beams.. 105
5.4 A MARS. Above the spiral spring is the more massive poly-crystalline silicon platform, suitable for AFM contact. A scale bar of 1 00 ~m has been overlaid
on this optical micrograph (from [7)). . . 107
5.5 General form of the Wheatstone bridge.
5.6 Tortonese et al.'s early piezoresistive AFM cantilever: schematic diagram of piezoresistive detection scheme (top); SEM photograph (centre) and plane
108
view drawing (bottom). Images from [14]. . . . 109
5.7 Images of the NPL C-MARS device, with detail of its fiducial markings; the 1 0 ~m oxide squares form a binary numbering system along the axis of sym-metry (adapted from [15]). . . 111
5.9 The NIST piezoresistive cantilever (from [17]; see also (18)). . . . . 113
5.10 SEM micrograph of integrated cantilevers and CMOS circuits in an intermole-cular force detection device developed at CNM-IMB, Spain (from [19]). . . 114
5.11 The 'blocking force' concept: Piezoelectric element free end displacement as a function of applied force and voltage. . . . 115
5.12 A commercially available stacked piezoelectric force actuator [20]. 116
5.13 The capacitor comb for linear sensing and actuation. . . 118
5.14 Capacitative force sensor and the study of fruit flies: (top) schematic diagram of probe showing axial force direction; (centre) block diagram of associated control circuitry; and (c) the sensor in action. From electronic version of [21].. 120
5.15 A commercially available capacitor-based force sensor (from (22)). The device is accompanied by a controller unit, the cable from which connects to the green pin headers shown. . . 121
5.16 (left) schematic diagram of a resonance string sensor; (right) example of ac-tual experimental set-up showing shear piezo for tension adjustment and ma-gnet for actuation of Lorentz oscillations (from (23)) . . . 122
5.17 Schematic diagram of a double-ended tuning fork resonance force sensor (from (24)). . . 123
5.18 Illustration of resonance force sensing AFM tip presented by Harley et al. (from [25)) . . . .
6.1 The NPL triskelion form, with nomenclature used in this and related docu-ments. The hub and arms are nominally non-compliant, that is, much stiffer than the beams. This stiffness difference is achieved through extra thickness on the arms and hub, and results in concentration of deflection in the outer
125
beams . . . 132
6.2 Schematic of general model, showing the five key geometry variables for the artefact concept. The shape of the inner arm and hub section is fairly flexible to suit fabrication constraints; the key is that it be much stiffer than the outer beams. Dashed lines show the effective radius of each beam end from the hub centre. The beams are rotated 1200
from these lines ..
6.3 Microprobe geometry used in this discussion
6.4 Dimensions of the rectangular outer beams
133
135
6.5 Effect of a small rotation about x on the vertical position of the arm ends . . . 137 6.6 Schema of FEA model corresponding to simplest analytical model. This has
been chosen as the basis for the shape of the prototype transfer artefact set. Shown are the in-plane geometry variables with their working values at the time this figure was created. The 'chain' and 'sum' signs indicate links to constant and derived parameters respectively. The quantity w-2 is a deri-ved parameter equal to W/2. The measured gap 01 is shown at its smallest value of 17 11m, corresponding to the smallest value of A in the artefact set, 0.6 mm. . . . . 142
6.7 A comparison of the alignment sensitivity of a cantilever and a triskelion: (a) the physical comparison; and (b) a simple model of the triskelion flexure. . . . 143
6.8 Representative results for comparative alignment sensitivity of triskelion and simple cantilever, with common nominal spring constant of 20 N m -1. Mo-delled triskelion arm length: 1 mm. MoMo-delled cantilever nominal axial contact point: 5 mm. . . . 144
6.9 Wafer layout options: (a) existing layout with twelve 13 mm
x
13 mm chips, as used successfully in microprobe project; (b) proposed higher density layout using 12 mmx 12 mm chips to maximise prototype population. Half-die, shown
within the red dotted squares, were not present on the microprobe wafers but are to be added to further increase functionality; see 'partial chip' discussion below . . . 1466.10 Schematic diagrams of the proposed sensor/actuator design adapted from previous drawings by Cranfield, not to scale: (a) top-down (from substrate side) view of sensor/actuator electrode layout over PZT and nickel layers; (b) expected cross-section of proposed beam showing PZT layer somewhat wider than the nickel flexure. . . 148
6.11 Simple cantilevers C1 to C3 equivalent to portions of beams on full artefacts A and
D;
these cantilevers allow investigation of sensor dimensional require-ments in a simplified system. The cantilevers have common thickness nickel thickness 5 11m (circa 9.5 11m with PZT) equal to the beam thicknesses on full artefacts A, D. . . . 1 526.13 Schema highlighting the possibility for reuse of at least four, if not eight of the full chip solder contact pads on the partial chips. Note that the current ground pad position also remains viable. The pink square and red quadrilate-ral indicate the expected edge locations of the proposed full and partial chips respectively; the blue dotted square indicates the previous 13 mm chip edge. Adapted from mask drawings from Cranfield University. . . 155
6.14 Placement of proposed chips on the wafer such that duplicate chips are spa-tially separated. The numbers refer to the chip 10 ('#') column in table 6.1. Letters refer to the partial chips; A, B are the simple cantilever; C, 0 are the two-legged cantilevers. . . 156
6.15 Total displacement (left) and strain (right) plots of artefact A under a ten micro-newton vertical (z) load at the hub centre. View is in the -z direction. Other views clarify that the total displacement is effectively entirely vertical in the hub centre. . . 159
6.16 Total displacement (left) and strain (right) plots of artefact I under a ten micro-newton vertical (z) load at the hub centre. View is in the -z direction. . . 160
6.17 Total displacement (left) and strain (right) plots of artefact F under a ten mi-cronewton vertical (z) load at the hub centre. View is in the -z direction. . . . 161
6.18 Total deflection of chip A under lateral (+x) force: (top) view along +x-axis; (bottom) view along -z-axis with +x direction towards this caption. Deflection at the hub centre is entirely along the +x-axis. The deflections in each axis are to scale but greatly magnified. Lateral deflections dominate. . . . 162
6.19 Comparative analysis of results from FEA and Analytical models of the eight comparable artefact types. The stiffness ratio kx.FEA/ kx.Anal. maps to the right-hand secondary axis; the other raw and descaled FE stiffness plots map to the left-hand axis.
6.20 The apparent linear relationship between the relative geometry factor and the analytical lateral stiffness results. The trend line is a linear least-squares fit to the data. The horizontally groups points share common Land T values but
166
different A values. . . . 167 6.21 A 'simple' cantilever from partial chips A, B (a) and its displacement (b) and
stress (c) distributions under a 5 IlN vertical load. The cantilever shown is C1. 168
6.23 Fabrication defects on artefact A, obtained using a digital optical microscope. 172
6.24 The workaround two-step prototype artefact spring constant measurement process.
. . .
1766.25 Parallel-flexure reference cantilever employed to measure prototype artefact spring constants: (top) schematic diagram; (bottom) actual implementation. . 177
6.26 Raw data from the measurement of the reference cantilever spring constant.. 179
6.27 Processed data from the measurement of the reference cantilever spring constant.179
6.28 Per-cycle approach and retract stiffness estimates from least-squares linear fits.180
6.29 Displacement-displacement curve for the use of the reference cantilever to measure the spring constant of artefact B. . . 181
7.1 The piezoelectric effect in quartz: (A) unstressed unit cell; (B) unit cell under compression produces a dipole; (e) under tension, the sign of the dipole is reversed (from [26]). . . 186
7.2 An electronic model of the sensor, charge amplifier system (from [27]) 188
7.3 An unsuccessful early interaction experiment that produced a ficticious sensor signal, due to electric fields from the PI Nanocube nanopositioner system: (top) the physical arrangement; (bottom) example results. . . 190
7.4 A typical frequency response characteristic for the triskelion obtained from a laser Doppler vibrometer using a software tool developed by others at NPL. This plot was obtained from energising actuator '3Am' on artefact D. The first mode corresponds to the vertical oscillation mode; the higher pair of peaks show the two plane-tilt modes and if fabricated perfectly would overlap. The small low-frequency notches are assumed to correspond to resonant modes of the metrology frame. . . 191
7.5 The tuning fork actuator system. The fork is placed across the centre of this image and secured with bolts through the handle out of shot. The coil is glued to the fork, and the magnet to the square-section rigid aluminium bar along the top of the image. On the opposite fork, approximately coaxial to the coil, a wire stylus is attached to contact the artefact. The system was rigidly mounted to a 5 mm high-resolution motion stage of the kind used elsewhere in this work.193
7.7 Sensor reponse to abrupt coil power connection state changes. . . . 195
7.8 Sensor reponse to abrupt coil removal of driving signal from function generator. 196
7.9 Sensor response using charge amplifier with high-pass filter of 2.3 kHz. Time and frequency are in units of seconds and hertz respectively. . . 198
7.10 Circuit diagram for noise reduction through subtraction of a nearby noise re-ference. . . 199
7.11 Sensor circuit output voltage using noise subtraction circuit, using the LF412CN amplifier. Time and frequency are in units of seconds and hertz respectively. . 200
7.12 Sensor circuit output voltage using the noise subtraction circuit based on the LMC6082 amplifier. Time and frequency are in units of seconds and hertz respectively. . . . 201
7.13 Observed reduction in noise in the sensor circuit output due to optimisation of feedback resistor. Time and frequency are in units of seconds and hertz respectively. . . . 202
7.14 The manual mechanical oscillator system: (a) detail of artefact interaction; (b) schematic overview of physical arrangement of cam oscillator; (c) overview photograph showing noise enclosure and pull-cord system bottom-right. . . . 205
7.15 Sensor circuit output response to repeated bursts of excitation at around 5 Hz using the cam oscillator system. . . 206
7.16 Sensor circuit output response for a steady manual oscillation input in the range 0.5 1 Hz. Time and frequency axes have units of seconds and hertz
respectively. . . . 207
7.17 The nanopositioner actuation system. 208
7.18 Sensor response using section 7.3.6 circuit under square wave input. One volt supplied to the nanopositioner will command a ten micrometre move in closed-loop operation. . . 209
7.19 Sensor response using section 7.3.6 circuit under stepped input. 209
7.20 Response of initial circuit to square (left) and triangle (right) wave input dis-placements.
7.21 Sensor-charge amplifier response to a sinusoidal mechanical input, showing effect of use of the feedback capacitor reset button. The top plot shows detail
209
7.22 Evaluation of the long-term behaviour of the charge amplifier circuit. One day equates to about 82 ks. The simplicity of the lower plot, taken from the upper plot, emphaSises the danger of assumptions about long-term behaviour. . . . 211
7.23 Driving signal and sensor response signals in response to 1 Hz motion com-mands with intended amplitudes 500 nm, 300 nm, 200 nm and 100 nm res-pectively from left to right. . . 212
7.24 Results of initial experiments undertaken on artefact D to evaluate the stability of the displacement sensitivity. The input movement is the commanded nano-positioner displacement step calculated from the change in command voltage; it was not independently verified. . . 215
7.25 Displacement-sensor voltage plot for collection of initial experiments. . 216
7.26 Example gradient linear fit data for 5 11m amplitude, 1 0 11m s -1 artefact deflec-tion experiment, artefact D . . . 218
7.27 Summary of calculated sensitivity as a function of artefact displacement am-plitude. Error bars are the standard error in the mean of all gradient estimates for the direction of motion for a given amplitude. . . 219
7.28 Summary of experiment series S1, S2 and S3 to determine the dependence of displacement sensitivity upon rate of artefact deflection. Data for increasing and decreasing artefact deflection are shown separately. Series are connec-ted for readability and not necessarily to infer a trend. . . 220
7.29 Summary of experiment series S4 to determine the dependence of displa-cement sensitivity upon rate of artefact G deflection. Data for increasing and decreasing artefact deflection are shown separately. Series are connected for readability and not necessarily to infer a trend. . . . 221
9.1 A rapid-prototyped artefact demonstrator designed by the author and produ-ced by the University of Nottingham showing a likely packaging format for the low force artefact. The dimensions are 10 mm
x
7 mmx
1 mm. . . 233A.1 Comparative plot of described surface interaction forces, based on the follo-wing values: R = 211m; U = 0.5 V; Y= 72 mJm-2; H = 10-18 J; e = r = 100 nm. Physical constants take their standard values:
Eo
= 8.854x
10-12 C2 N-1 m-1;
Acknowledgments
A thesis is a metaphor for academic endeavour as a whole, being something novel crafted from the groundwork laid by others. There are a number of people I must thank for their 'groundwork' to my education, my career and this thesis.
First of all, many thanks to my supervisors Derek Chetwynd and Richard Leach for their patient guidance and support over the past years, not least for detailed comments and sage advice at the eleventh hour.
My thanks to my examiners and thesis committee for taking time to consider my pro-gress and final manuscript; to NPL, for funding 1 and operational support; to my colleagues in the mass and dimensional area at NPL, too many to fairly name, but the ready help of whom is greatly appreciated; to my various student assistants; to the international low/small force NMI community for lively discussions, especially to Dr Jon Pratt at NIST for his insight and the opportunity to second to Gaithersburg; and to Chris Shaw et al. at Cranfield University for artefact production.
To those who have supported and encouraged me throughout my education and career: I extend hearty thanks; to those who tried to hold me back: a raspberry to you!
I dedicate this thesis to my family. To Mum and Dad, thank you for setting me on the right path and tirelessly supporting me and encouraging me along it. To my wife, Winnie, thank you for being an unending source of patience, and for finding sense in the muddle for ten years!
To the future! I wonder what's next?
Declarations
The majority of the work presented in this thesis is the work of the author alone. The
contri-butions of others to the reported work are noted here.
This thesis concerns critical contributions for the continuing long-term development
of the traceable low force facility at NPL. As such, it inevitably both builds on the earlier
contributions of several colleagues and benefits from their present work in related areas. The
thesis presented is the work solely of the author except where explicitly stated otherwise and
cited in the main text.
Significant contributions of others are as follows. The triskelion artefact holder (see
figure 7.17) was developed with James Claverley, who also provided the laser Doppler
vibro-meter testing procedure described in section 7.3.2. The fabrication of the prototype artefacts
(section 6.3) was formulated and undertaken by Cranfield University to meet specifications
provided by the author.
Detailed testing, minor design and some artwork were undertaken by masters
stu-dents under the direct supervision of the author. Specifically, Jewan Singh [28] contributed
Abstract
Traceable low force metrology should be an essential tool for nanotechnology. Tra-ceable measurement of micro- and nanonewton forces would allow independent measure-ment and comparison on material properties, MEMS behaviour and nanodimensional mea-surement uncertainties. Yet the current traceability infrastructure in the UK is incomplete. This thesis describes the incremental development of the low force facility at the National Physical Laboratory (NPL).
Abbreviations
ADC analogue-to-ditigal convertor, an electronic component
BIPM International Bureau of Weights and Measures, after the French name
CIPM International Comittee for Weights and Measures, after the French name
CMS-ITRI Centre for Measurement Standards (Industrial Technology Research Institute), the Taiwanese NMI
DAC digital-to-analogue convertor, an electronic component
GUM Guide to the Uncertainty in Measurement
KRISS Korea Research Institute of Standards and Science, the South Korean NMI
LFB Low Force Balance, the primary traceable nanonewton balance at NPL
LNE Laboratoire national de metrologie et d'essais, the French NMI
MEMS micro-electromechanical system
MPE maximum permissable error
NIST National Institute of Standards and Technology, the American NMI
NMI national metrology institute
NMO National Measurement Office
NPL National Physical Laboratory, the British NMI
PTB Physikalisch Technische Bundesanstalt, the German NMI
List of publications by the author
The following publications were authored or co-authored by the present author during the period of registration and relate to low force metrology.
Review of low force transfer artefact technologies Published (31) as an NPL Report in 2008 (primary author), this review report contributed to chapters 2 through 5 of this thesis.
Adding a dynamic aspect to amplitude-wavelength space Published (32) in Measure-ment Science and Technology in 2012 (primary author), this paper relates to the need for low force metrology for stylus surface topography instruments (see chapter 2).
Comparison of NIST SI force scale to NPL SI mass scale Published (33) in the Procee-dings of 2008 ASPE Annual Meeting, Portland, Oregon, (primary author) to accompany an oral presentation by the author, this paper relates to section 3.9.
Report on the first international comparison of small force facilities: A pilot study at the micronewton level Published [34) in Metrologia in 2012 (co-author), the author contributed details of NPt.:s participation (see section 3.10).
Concept and modelling of a novel active triskelion low force transfer artefact Pre-sented [35) at the 11 th Int. Cont. of the Euspen, Como, Italy (primary author), this poster relates to the work described in section 6.4.
Chapter 1
Introduction and context of low force
metrology
1.1
Overview and motivation
Progress in UK nanometrology and in other areas of nanotechnology has been constrained by an incomplete traceability chain for micro- to nanonewton force measurement. The gene-ral aim of the work described in this thesis was to complete a facility at the National Physical Laboratory (NPL) to disseminate traceability for such low forces.
A lack of suitable traceable transfer artefacts has kept the primary realisation of the nanonewton unavailable to industry and academia, and hence to dependent applications. Traceability is an essential prerequisite for the quantitative comparison of independent pro-cesses and for meaningful estimates of forces acting on real micro- and nanotechnology applications.
This thesis describes key development steps towards the completion of the NPL Low Force Facility, intended to provide the source of traceable micro- to nanonewton force measurement in the UK. The described work has three key strands.
1. Upgrades, commissioning and verification of the NPL Low Force Balance (LFB), rea-lising traceable force measurement in the 10 nN to 30 IJN range.
2. Development of an improved transfer artefact flexure design based on the triskelion concept.
1.2 Objectives
The specific objectives of the work reported in this thesis can be listed as follows. The list incorporates objectives defined at the outset of the project and additional objectives set or redefined during the course of the project.
Objective 1.1 Establish a new LFB controller to mitigate surface charging effects in the mechanism whilst respecting the electrostatic force balance principle.
Objective 1.2 Develop full continuous fringe-counting operation on the LFB z interferometer.
Objective 1.3 Establish effective vibration isolation for the LFB.
Objective 1.4 Establish techniques or procedures for measurement of capacitance gradient and plate voltages.
Objective 1.5 Verify LFB performance via comparison with small calibrated masses.
Objective 1.6 Verify LFB performance via international comparison with low force stan-dards at other National Metrology Institutes.
Objective 2.1 Review the state-of-the-art in flexure design and fabrication techniques, as relevant for transfer artefact design.
Objective 2.2 Establish a concept for the flexure design for a novel transfer artefact for low force traceability.
Objective 2.3 Develop an analytical model of the flexure sufficient to allow the behaviour of a prototype implementing the concept to be predicted.
Objective 2.4 Develop a finite element model to complement and improve confidence in the analytical model.
Objective 2.5 Design, and have fabricated, a suite of prototype artefacts suitable for expe-rimental confirmation of the developed models.
Objective 2.6 Experimentally evaluate the performance of the fabricated artefacts and com-pare with model-predicted behaviour.
Objective 3.1 Review the state-of-the-art in on-board strain sensing in microfabricated flexures, as relevant for transfer artefact design.
Objective 3.3 Experimentally evaluate the suitability of the piezoelectric effect for strain ge-neration and strain sensing on a traceable low force transfer artefact, given the asso-ciated requirements.
Objective 3.4 Establish recommendations for the future use of the piezoelectric effect in the traceable low force measurement context.
1.3 Outline of thesis
This thesis is arranged in a manner that reflects the undertaking of the project, and can be summarised as follows. Chapter two elaborates on the background to the project, the motivation, and the context for the work in terms of activity at NPL and at equivalent institutes worldwide. The status of the NPL Low Force facility at the outset of the reported work is also clarified.
Chapter three describes the function and operation of the LFB and reports on the first strand of the project, that is, efforts to meet objectives 1.1 through 1.6 to make the LFB ready for use with artefacts. This strand of the project expanded in scope throughout the project as challenges and opportunities arose.
Chapter four initiates the second and third strands of the project, defining the require-ments for a successful low force transfer artefact for use with the LFB based on the author's metrology experience and discussions with leading low force experts. The calibration of the transfer artefacts and their use to calibrate both stiff and compliant targets is discussed. The requirements in this chapter inform the direction and discussion of the subsequent chapters.
Chapter five contains a review of the state-of-the-art in low force transfer artefact technology, considering both flexure design and fabrication and relevant strain sensing tech-nologies (objectives 2.1 and 3.1). The development, optimisation and evaluation of models to understand and predict the electromechanical behaviour of the basic concept are consi-dered. Based on consideration of the requirements set down by users and the specifications demanded from the artefacts, a suite of test artefacts was fabricated as a realisation of the concept and to verity the models developed. Stiffness measurements were undertaken using the prototype artefacts to consider the suitability of the developed mathematical models, as will be discussed.
performance of the transfer artefact prototypes. The best-case observed artefact sensor performance for quasi static force measurement is presented and the viability of the approach evaluated. This development included significant prototyping work undertaken using the test artefacts.
Chapter 2
Background
It is clear that the ability to measure nanonewton-scale forces has wide appeal across all fields of research and application of micro- and nanotechnology. However, the prior and on-going experience of the National Physical Laboratory, in addition to the precedent set by others, has influenced the formation of a low force facility for the UK.
This chapter sets out the context for the development of the low force facility, consi-dering prior experience and local applications at NPL, as well as equivalent and potential facilities at other institutions. Also presented are the starting point and direction of develop-ment from the point of view of this thesis.
2.1
Context and motivation for a low force facility
The past twenty years have seen an increasing move towards quantitative understanding, fabrication and manipulation of processes and objects, for which behaviour on the micro-and nano-scale is key to function. Function on this sub-micro scale is typically governed by forces on the micro- to nanonewton scale. As such nanometrology applications mature and there is greater and greater need for integration and independent quantitative comparison of those sub-micro processes, traceability to the definition of the newton for small forces is becoming essential.
The mature measurement capabilities that exist to characterise and predict the per-formance of function of objects on the macro-scale must be miniaturised to produce analo-gous measurement capabilities on the micro- to nanoscale. In some cases this is 'merely' a question of more precise manufacturing capabilities to reduce the size of some mechanical gauge whose function remains effectively the same.
However, typically this reduction in working scale necessitates a complete reformu-lation of measurement strategy to avoid increasingly overwhelming measurement uncertain-ties. Force measurement is a good example of measurement uncertainty barrier.
Traceably calibrated deadweights, derived from the first standardised merchant scales from antiquity, have been, and continue to be used extensively to provide traceable force, mass and torque measurements from tens of meganewtons down to a millinewton. For smal-ler forces the measurement uncertainties encountered render the calibrated deadweight im-practical, and a replacement force calibration artefact and traceability route is required.
As might be expected, developments in industries concerned with micro- and nanos-cale processes have led to methods of 'calibrating' force measurement to meet the requi-rements of those industries. However, those low force measurement standards are typically comparative in nature, relying on repeatability and assumed linearity of instrument scale; the standards are typically highly industry specific and often proprietary intellectual property, and lack the rigorousness of design and the open, verified traceability of standards developed at the world's national metrology institutes (NMls).
The National Physical Laboratory (NPL) is one such NMI that has undertaken to develop a facility for low force measurement1. This development was undertaken within the 2008 to 2011 National Measurement Office (NMO) Engineering Measurement programme, funded the UK taxpayer, and supports a more general strategy within the European metro-logy community [37].
The NPL facility complements comparable small force facilities developed at other major global NMls including NIST, KRISS, PTS and eMS-ITRI, which will be reviewed in this thesis. The facility aims to provide a route to traceability in the most technically challenging part of the force range with immediate application and relevance for UK industry, namely the 1 0 ~N down to 1 nN regime.
A facility representing a primary traceability route such as in this case is typically made up of two components: primary instrument or realisation; and transfer artefacts.
The primary instrument traceably realises the basic quantity, embodying some base underlying principle. This primary instrument is optimised for best possible (lowest)
tainty in the primary instrument and is typically unsuitable for direct, efficient interaction with instruments or processes to be calibrated.
The link between the primary instrument and those instrument or processes is made using specialised transfer artefacts - typically suites thereof - that are optimised for the requirements and rigours of transfer of calibration. For example, a calibrated metre rule is a transfer artefact for the primary, optical realisation of the metre; similarly a commercially available kilogram artefact is a transfer artefact for the international prototype kilogram,
.It
[38].In addition to the requirement to make a traceable low force facility available to UK industry, as discussed above, there are several local projects at NPL that would directly benefit from the development of such a facility. A traceable low force measurement capabi-lity directly supports the quantitative understanding and modelling of surfaces and surface texture, which are often critical to function and yet poorly defined on the micro-to nanos-cale. In micro-coordinate metrology, for example, a consistent and traceable definition of the threshold of force interaction defining contact is essential for measurement standards. Such a low force capability would also help to make traceable the extensive body of work undertaken in the materials sector through the calibration of nanoindenters and atomic force microscopes.
At the commencement of this project, previous NMO funded work had resulted in the development, and very early-stage testing, of the NPL Low Force Balance, as the primary instrument in the NPL low force measurement facility. The appropriate next step, therefore, was to develop a transfer artefact concept to transfer low force calibrations from the LFB to users in industry.
2.2 A brief history of low force measurement at the National
Physical Laboratory
2.2.1
The National Physical Laboratory
Specific responsibilities include the maintenance and development of the UK's pri-mary definitions of the base units (metre, kilogram, etc.), as well as maintaining equivalence of those units to other countries' definitions under the stewardship of the International Bu-reau of Weights and Measures (BIPM).
NPL also has a responsibility to ensure that its measurement capability is available to all sectors and members of UK industry, in some case subsidising access to calibrations and advice for small- to medium sized enterprises (SMEs).
This dual responsibility to develop world leading metrology capabilities and to ensure that traceable measurement is accessible to industry can lead to conflicting requirements that must be overcome for each area of measurement. Specifically, the instrument or tech-nique developed as the primary realisation of the relevant unit is usually much too expensive or impractical to be directly used by an end-user. This is certainly the case for low force measurement, as will be discussed. The solution is to maintain a complete dissemination chain ranging from primary standards and definitions to physical calibration artefacts and good practice guides for direct use on the factory floor. Some of this dissemination respon-sibility may be delegated officially or unofficially to appropriate intermediate bodies such as calibration laboratories and instrument manufacturers.
The work described in this thesis was funded by the NMO Engineering Measurement Programme 2008 - 2011 and its preceding equivalents. NPLS low force capability develops upon established local capability for force, displacement and electrical measurements.
2.2.2
TraceabilityWhen measurements are made in the world around us, the measurement scale or instrument used, whether a metre rule, mass balance or thermometer, is often assumed to be infallible by the user. If the measurement is not 'faulty', then its readout is 'accurate', at least to the resolution provided.
This assumption is naive, and usually wrong. The relationship between the measu-red and actual value of the quantity under observation is complicated and often varies with time. Changes in environment such as temperature, pressure or external forces may change the quantity being measured, and distort the reference scale.
Many of these uncertainties may be provided in some form by the instrument ma-nufacturer, and originated (we hope) from calibrations at the factory, which had their own associated uncertainties. If everyone has done their job, there should be an unbroken chain of calibrations, and uncertainty estimates, back to one or more primary standards or length, mass and so on, maintained by national metrology institutes (NMls) such as NPL. This is the principle of traceability. Traceability is formally defined [39] as follows:
Traceability is ''the property of a measurement or the value of a standard whe-reby it can be related to stated references, usually national or international stan-dards, through an unbroken chain of comparisons all having stated uncertain-ties".
Thus it is the implicit chain of uncertainty, if it exists, that makes a measurement traceable. If a traceable measurement of mass is found to be 25.3 kg±0.6 kg (k = 2) then one can be 95 % certain that the actual mass value falls within 0.6 kg of 25.3 times the mass of the international prototype kilogram.
The concept of traceability and propagation of uncertainty is discussed in the Guide to the Uncertainty in Measurement (GUM), originally published in 1995 [40] and later amen-ded and supplemented [41, 42]. The GUM introduces methods to estimate the uncertainty in a measurement and hence continue the chain of traceability. A familiarity with the GUM is highly recommended and will aid the understanding of discussions presented later in this thesis.
2.2.3 Macro- to mesoscale force calibration
Standard 'weights' (reference masses) and comparator balance techniques stretch back into antiquity due to their value in commerce, and the kilogram (or rather, the gram) was an essential component from the outset of the metric system and its successor, the International System of Units (SI) [43].
of 0.001 % [47]. Forces up to 30 MN are accessible via a hydraulic secondary standard, with increased uncertainties.
Since force traceability is derived from comparison with the weight of the kilogram, the lowest relative uncertainties in traceable force measurement can be found at around 10 N [48]. The kilogram has a relatively low surface-area to volume ratio, reducing the effects of contamination; it is of practical size to be manipulated, and yet small enough to be easily enclosed within an environmentally-stabilised chamber. Calibrated masses in the gram to kilogram range are routinely used in research and industry, and the OIML specifies multiple grades of standardised masses for this purpose [49].
The limit of usefulness of this technique is reached when uncertainties and practical considerations due to contamination and handling grow too great and too problematic for cost-effective use. It is at this level where a transition to the force measurement techniques considered in this thesis become preferable. At the lower end of the practical deadweight scale, small masses are nevertheless used at NMls to produce force, torque and density standards, to calibrate mass balances, and so on. Since the challenges in small mass ca-libration are dominated by contamination and the time penalty of appropriate handling, but otherwise produce highly repeatable results, they remain in use at NMls, in which the clean operating environment and tolerance of time-consuming procedures in place are conducive to their use.
2.2.4 Direct force measurement applications
For 'real' applications of force measurement in industry and academia, what is needed is a calibrated force sensor capable of measuring a force from an arbitrary direction, and with an arbitrary (and variable) magnitude on a continuous force scale, amongst other requirements. These requirements, and others, which are described in more detail in chapter 4, necessitate a force measuring solution other than deadweights.
2.2.5 Material property research
In the advanced materials team at NPL, complementary capabilities incorporating force mea-surement have been developed to assist directly with the characterisation of material pro-perties.
Aside from atomic force microscopy, covered in the next section, the area of interest of most significance for the development of sub-newton force metrology is instrumented indentation, for which NPL has a long-established capability [53, 54).
Much can be learnt about a material by producing an indent in a sample though the application of a known force with a tip of known shape [55). Traditionally, the tip was removed, and the indent dimensions measured optically. Instrumented indenters differ somewhat from this traditional approach, in that the vertical position of the tip is continuously measured as a calibrated force actuator pushes the tip into the surface.
This approach offers clear advantages in terms of continuous measurement, higher resolution and repeatability, to the general benefit of advanced materials understanding.
The range of force and motion supported by each type instrumented indenter varies, and these ranges are somewhat arbitrarily demarcated into indenters, microindenters and nanoindenters. Typical commercial suppliers of nanoindenters include Agilent Technologies, Asylum Research, Bruker AXS, Hysitron and MTS Systems [56, 57, 58, 59, 60). In addition, the mechanism by which the indenter force is produced and the displacement measured varies, in accordance with the expected operating range. One option (see figure 2.1) is to use a large flexure guide, electromagnetic coil force drive and capacitive displacement sensor; an alternative employs a modified AFM arrangement to achieve the indentation.
Regardless of the technique employed in the indenter, the result is a system aiming to apply a known force through a tip of known vertical displacement. To do this, the indenter must be calibrated. One option is to indent samples of well-characterised materials, and back-calculate the applied force from the observed indent, having previously calibrated the displacement scale with a step-height standard. Such an approach is not very repeatable and leads to a necessarily 'discrete' calibration curve. It would be better if the force could be calibrated directly using a calibrated reference sensor, such as a low force artefact. The vertical spring constant of each indenter mechanism is chosen for compatibility with the force and displacement ranges of the instrument itself, which are in turn optimised for the expected surface contact stiffness values to be encountered. Commercially available indenters provide exemplary values for spring constant in the range 1 kN m-1 to 10 kN m-1
(a)
(b)
100mm
Untaxi I
motion
Centreline
Sample
Stiff loop __
o
-
To be mimmlsedSample ]
Force activator
e.g
voice coil]
Capacitive
displacement
s
nsorStiff (MN
m
-
')
/ " m trology loopOp icallever
/ " or strain gauge readout
Indenter arm tip
[image:36.488.8.474.32.656.2]typical nanoindenters (for example, 10 mN for the MTS NanoindenterXP [60], with 1 nN resolution) extend significantly above the low force range, but one could imagine a low force capability augmenting a cheaper millinewton-scale calibration system.
Nanoindenters are therefore an extremely relevant target instrument sector for a traceable low force facility and support of related local effort at NPL directly contributed to the motivation for the effort described in this report.
2.2.6 Atomic force microscopy
A significant proportion of Materials research at NPL, and indeed other fields at NPL and beyond, involves the use of atomic force microscopy (AFM) and other scanning probe mi-croscopy (SPM) techniques. There are many different types of SPM but all involve scanning a stylus-equipped spring (almost exclusively cantilevers) over a test surface, and using in-formation about the instantaneous deflection of the AFM spring to deduce the topography of the surface. This facile description does not do justice to the sophistication of the AFM techniques developed since the invention of AFM by Binnig et al. in 1986 [61]; some of these techniques are summarised in figure 2.2.
Vacoot et al. [62] summarise the development of AFM from the dimensional nano-metrology perspective. The authors note both the widespread appreciation of SPM for a diversity of applications, and the continued challenges in traceably calibrating such instru-ments to meet, for example, increasingly stringent quality control criteria.
There are multiple components to the calibration of an AFM. First, one must know to some degree where the tip is located over the sample surface in
{xyz}.
The AFM stage scales must be calibrated using special reference samples, or the location measured directly using traceable metrology in the form of a metrological AFM [62].Second, it is necessary to know the stiffness of the AFM cantilever. It is becoming increasing essential to understand, quantitatively, the force imparted by an AFM probe under operation, even for so-called non-contact techniques that are nominally force-nulled. A force applied to the surface will change the surface to some extent, introducing uncertainties to the measured data. For non-contact techniques, to track the surface the probe must interact with that surface in some way. Peak forces during the cycle can be sufficient to perma-nently deform softer materials such as biological samples, advanced foams and aerogels. Only through adequate choice and calibration of the AFM probe stiffness can this risk be appropriately mitigated.
Non-Conlact I Tapping Mode (/lC)
Electrostatic Force Modulation (EFM) • Electncal Measurement
Enhrmced Resolution Imaging
1
Force Modulation Mode (FU)
Magnetic Force Microscopy
(fI.1F~')
Trench Measurement
Conlact r.lode (Cont)
Lateral Force Microscopy (lFM)
[image:38.488.4.474.54.746.2]Nanoindentation
may be sufficient to verity the long-term stability of the deflection analogue, perhaps as part of a wider characterisation of the instrument's mechanical stability. For contact-mode AFM, the deflection output would need to be fully calibrated against some traceable reference. Common deflection sensors include optical levers and piezoresistive strain gauges.
To use an AFM as a force sensor, or otherwise to understand the force being applied to a scanned surface, one can either combine the calibration of the deflection metrology with that of the cantilever spring constant, or calibrate the deflection analogue directly in terms of applied force rather than induced deflection: force sensitivity, in place of displacement sensitivity. An example of a pure force measurement would be the manipulation of CNTs with a fixed AFM tip, or the manipulation of proteins (see section 2.4.1.5). If the applied force can be measured traceably, a significant barrier to traceability of measured material property value is removed.
Without access to a traceable low force facility, the calibration of the force scale of an AFM typically proceeds as follows. The user purchases a set of AFM tips from a probe manufacturer to install. The tips carry a manufacturer-specified stiffness value with some measure of uncertainty over the expected range of operation. Typically this value has some obscure claim of traceability, or the manufacturer states that the value is estimated from the geometry (see section 5.1.2.1). With the tip installed, a calibrated step height may be used to calibrate the internal deflection metrology of the AFM head. From Hooke's law, and the displacement signal, the applied force can be calculated. Since the spring constant uncertainty of typically 10 % to 20 % dominates, the key focus of traceability improvements for SPM users, and NMls such as NPL, has been to develop ways to traceably calibrate spring constants.
Regardless of the internal force or deflection metrology, or the mode of operation, the probe of an SPM is essentially a uniaxial flexure, a cantilever. The spring constant of this flexure can vary significantly depending on the application. A brief review of commercially-available AFM cantilevers, for example, reveals a spring contant range from 0.1 N m-1 to 100 N m -1 for standard applications.
2.2.7 Dimensional measurement
The measurement of force is also extremely important for the development of traceable, low uncertainty dimensional measurement on the 1 00 ~m range, 1 nm resolution scale. The
NPL low force facility explicitly supports advances in surface metrology and micro-coordinate metrology within engineering nanometrology.
Significant uncertainties associated with the operation of high-end stylus surface texture measuring instruments, such as NPL:s Nanosurf 4 (the primary profile measuring instrument) [63] and the Areal instrument (the primary areal surface topography measuring instrument) [64] originate in the continuous nature of the various interaction force fields that define, on the nanoscale, surfaces that appear discrete on the macroscale. See appendix A for a discussion of these forces. These force fields provide the mechanism of ideal operation of non-contact measuring techniques, in which proximity of the probe to the surface induces a detectable change in, typically, the resonant characteristic of the probe.
NPL has developed [4] a micro-coordinate metrology probe based on a patented non-contact vibrating sensor, to augment the resolution and application of micrometre-scale coordinate measuring machines such as the Zeiss F25 [65]. The F25 uses a touch probe equipped with a 300 ~m diameter sapphire sphere to measure the dimensions of small com-ponents to 250 nm MPE within a volume of 100 mm x 100 mm x 100 mm. This versatile instrument nevertheless applies significant forces (up to 300 ~N) to the sample and damage is sustained in many samples. NPL:s probe is, in contrast, designed to impart negligible pro-bing forces under vibrating non-contact operation. The NPL Low Force Facility will be used to verify this quantitatively. The non-contact operation will also assist in the avoidance of 'snap-in' adhesion by the approaching probe, an effect that not only affects obtained measu-rement data but can, in some circumstances, prove catastrophic for the probe tip or sample on the subsequent 'snap-out' transition.
Non-contact operation of this probe implies some sort of finite, fixed standoff main-tained over the course of the measurement by feedback control. Both the effective tip radius created by this non-contact operation, combined with the definition and stability of the sur-face arrival threshold involved, imply the need for accurate, traceable force metrology.
Floxur"
PIT "n. .... ~
-Figure 2.3: Schema of NPL microprobe and an image of a fully assembled device (from [4])
Based on the weight of local applications alone, as summarised above, the moti
-vation for the development of a traceable low-force measurement capability was clear. The
initial development of this capability, prior to the direct involvement of this author, will be
discussed in the following section.
2.3 A direction for traceable low force metrology at NPL
When developing a primary standard with the lowest possible uncertainties, the key to suc
-cess is usually simplicity. A simple operating principle implies a simple propagation of un
-certainties - and a limited set of sources in the first instance - and a more well-defined (and
hence lower) total uncertainty in the realisation of the unit associated with the instrument's
purpose.
The simplest realisation of a unit of force, at least on the macroscale, is the weight of
a known mass. Since local gravitational acceleration may be determined very accurately (see
section 2.4.1.3). a constant mass can produce a very constant reference force in the form of
weight. For very small forces however, below 1 0 ~N, contamination causes the assumption of constant mass in a mass artefact to break down significantly. Furthermore, the weight of
small masses is tied to the orientation of gravity and such artefacts offer no advantages over
other more sophisticated microscale force sensors in terms of ease of handling. Indeed, the
need to completely disengage from a mass artefact to realise its calibrated weight, as well
as to calibrate that weight, necessitates many repeat measurements and statistical analysis
to minimise the effects of force spikes that occur during on-off contact transitions. Finally,
small mass artefacts necessarily produce a set of discrete, fixed force values, limiting their
application in continuous force sensing applications.
based on some other continuous principle. Practical considerations have resulted in the use of either electrostatics (bespoke instrument) or electromagnetism (commercial mass balance) to generate a force to balance the input test force. A control system is used to maintain dynamic force equilibrium and enable traceable comparison.
The range of force, range of application and range of user requirements for traceable low force measurement are broad. In general, higher instrument or sensor performance has an associated cost in terms of practical usage of that instrument. NPL undertook to produce a low force facility with performance and uncertainties approaching that of the NIST vacuum-operated facility (as will be discussed in section 2.4.1), but with the more rugged nature and accessibility of the then-fledgling PTB facility. In this way NPL would be best placed to meet the requirements of internal users and wider UK industry.
The proposed strategy was therefore to develop an air-operated electrostatic force balance, after the NIST precedent, operating down to one nanonewton, and further to pro-duce practical, high-performance, affordable artefacts to transfer traceability to users. Fur-ther, NPL would design its artefacts in order to overcome key uncertainties associated with precedent artefacts, and ultimately offer a step-change in performance for the same level of useability. The implementation of this strategy will become clear in the remainder of this thesis.
2.3.1 Status of the NPL low force facility at the outset of this project
At this juncture it is appropriate to define the start-point for this thesis in terms of develop-ment of the low force facility. Broadly speaking, the NPL low force facility has two intended components: the LFB, and a collection of transfer artefacts to facilitate the link between the LFB and potential users of a calibrated low force facility.
At the outset of this project, the mechanism of the LFB had been designed and produced, in collaboration with a key industry partner, and initial characterisation work un-dertaken. Initial consideration of vibration isolation was underway but no formal steps had been undertaken other than to site the LFB in an environment with low mechanical and acoustic noise, and to install an acrylic draught shield around the LFB.
![Figure 2.9: NPL LEN for lateral force calibration, from [8]view of the . Inset in the expanded view is a side-on 10 jJm thick structure of the device](https://thumb-us.123doks.com/thumbv2/123dok_us/9649139.467009/55.488.5.472.20.736/figure-lateral-force-calibration-inset-expanded-structure-device.webp)
![Figure 2.10: preceding are Force extension curves obtained by stretching titin proteins show periodic features that consistent with their modular construction (from [9])](https://thumb-us.123doks.com/thumbv2/123dok_us/9649139.467009/58.488.73.412.75.280/preceding-extension-obtained-stretching-proteins-periodic-consistent-construction.webp)