warwick.ac.uk/lib-publications
Original citation:
Alkan, Bugra, Vera, Daniel, Ahmad, Mussawar, Ahmad, Bilal and Harrison, Robert (2016)
Design evaluation of automated manufacturing processes based on complexity of control
logic. In: 26th CIRP Design Conference, Stockholm, Sweden, 15-17 Jun 2016. Published in:
Procedia CIRP
Permanent WRAP URL:
http://wrap.warwick.ac.uk/78854/
Copyright and reuse:
The Warwick Research Archive Portal (WRAP) makes this work by researchers of the
University of Warwick available open access under the following conditions. Copyright ©
and all moral rights to the version of the paper presented here belong to the individual
author(s) and/or other copyright owners. To the extent reasonable and practicable the
material made available in WRAP has been checked for eligibility before being made
available.
Copies of full items can be used for personal research or study, educational, or not-for-profit
purposes without prior permission or charge. Provided that the authors, title and full
bibliographic details are credited, a hyperlink and/or URL is given for the original metadata
page and the content is not changed in any way.
Publisher’s statement:
© 2016 The Authors. Published by Elsevier B.V. Licensed under the Creative Commons
Attribution-NonCommercial-NoDerivatives 4.0 International
http://creativecommons.org/licenses/by-nc-nd/4.0/
A note on versions:
The version presented here may differ from the published version or, version of record, if
you wish to cite this item you are advised to consult the publisher’s version. Please see the
‘permanent WRAP url’ above for details on accessing the published version and note that
access may require a subscription.
ScienceDirect
Procedia CIRP 00 (2016) 000–000 www.elsevier.com/locate/procedia
2212-8271 © 2016 The Authors. Published by Elsevier B.V.
Selection and peer-review under responsibility of Professor Lihui Wang.
26th CIRP Design Conference
Design evaluation of automated manufacturing processes based on
complexity of control logic
Bugra Alkan*, Daniel Vera, Mussawar Ahmad, Bilal Ahmad, Robert Harrison
Automation Systems Group, WMG, University of Warwick, CV4 7AL, Coventry, West Midlands, UK
* Corresponding author. Tel.: +44 (0)7786360026. E-mail address: [email protected]
Abstract
Complexity continues to be a challenge in manufacturing systems, resulting in ever-inflating costs, operational issues and increased lead times to product realisation. Assessing complexity realizes the reduction and management of complexity sources which contributes to lowering associated engineering costs and time, improves productivity and increases profitability. This paper proposes an approach for evaluating the design of automated manufacturing processes based on the structural complexity of the control logic. Six complexity indices are introduced and formulated: Coupling, Restrictiveness, Diameter, Branching, Centralization, and Uncertainty. An overall Logical Complexity Index (CL) which combines all
of these indices is developed and demonstrated using a simple pick and place automation process. The results indicate that the proposed approach can help design automation logics with the least complexity and compare alternatives that meet the requirements during initial design stages.
© 2016 The Authors. Published by Elsevier B.V.
Selection and peer-review under responsibility of Professor Lihui Wang.
Keywords: Process modelling; design efficiency; complexity indicator; complexity management.
1.Introduction
Manufacturing enterprises are challenged to constantly improve their production systems in terms of flexibility, reliability and responsiveness to satisfy customer demands for products with better features, unique functions and shorten product lifecycles [1]. To meet production targets of complex products with higher quality requirements and reduced time to market, the manufacturing industry is commissioning highly automated production systems, numerous sub-systems of various nature, including machining and processing systems, material handling devices and material storage and retrieval units [2] as well as more agile and responsive methods and strategies. According to ElMaraghy et al. [3], these changes have increased the complexity of manufacturing enterprises, all the way down to the shop floors.
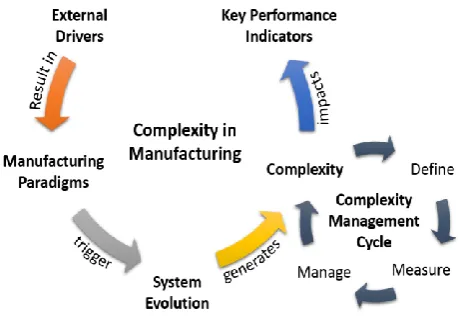
An increase in complexity was reported to negatively impact all aspects of manufacturing, in terms of: production quality, reliability, throughput and production time at both operation, maintenance and organisational levels [3]. Although a significant number of academic studies have focused on analysing complexity of manufacturing processes and systems, there is still a crucial lack of understanding of both the nature
and sources of complexity as well as the correlation between complexity and performance parameters, such as: productivity, flexibility and responsiveness [4]. A diagram summarizing the complexity issue within the manufacturing is illustrated in Figure 1.
Manufacturing processes become significantly complex as the product variety and the required functionality increase [5]. Complex automation processes are difficult to modify, change and maintain. In order to improve the quality of the automation processes, complexity should be minimized without losing the required functionality. In this paper, control logic of automated manufacturing processes is modelled as a component-based network in which a set of components cooperates together to achieve the common objective. A quantitative approach is proposed which produces measurable complexity indices based on the structural properties of the control logic. These indices are used to evaluate structural complexity of design alternatives and identify potential bottlenecks at an initial stage.
2.Literature review
2 Author name / Procedia CIRP 00 (2016) 000–000
changes in initial conditions may lead to significant variations of the system’s response, thus, complex systems may be very problematic to operate, control and maintain, and prediction of the behaviour of such systems are often impractical [2]. In the literature, complexity in manufacturing is defined within two domains: i.e. physical and functional [6]. Complexity in physical domain can be classified as static and dynamic [7]. Static (or structural) complexity represents internal and time independent characteristics of a system and focuses on interconnectivity between sub-systems or sub-modules [8]. The characterisation of dynamic (or operational) complexity focuses on operational characteristics of the system and its unpredictability over a time interval [9]. In a similar vein to the physical domain, Suh promoted an original approach to describe complexity in the functional domain, which can also be classified into two sub-groups, namely: time independent and time dependent [10]. According to this, complexity is used to represent emerged ambiguity while system is performing predetermined tasks under functional requirements.
In the last two decades, several approaches in measuring complexity of both manufacturing systems and processes have been offered. In this paper, approaches for complexity assessment have been categorized into four main groups (i.e. information theoretic measures, chaos and non-linear dynamics theory, heuristics/indices based metrics and hybrid measures). Information theoretic approaches offer an objective measure to identify and assess cause effect relationships. These measures have an ability to integrate systemic characteristics in a single measure and offer numerous advantages such as: adaptability to different types of systems, flexibility and ability to compare systems [11]. Nevertheless, information theoretic complexity measures can be seen as lack of, or insufficiently detailed practical methodology for applying into real case studies. Issues to be addressed include the impact of imperfect information, cost of the measurements, or conversion of the results into informative data and recommendations for generic and specific issues on system design and management.
Chaos theory provides a robust theoretical framework for understanding non-linearity, uncertainty and instability, and it is considered as a well-established science.However, some limitations bound back this approach. As highlighted in [12], existence of chaos in manufacturing has not been completely verified yet. In addition to this, manufacturing systems may
exhibit stochastic events as well as chaotic behaviours. However, tools and methods developed based on theory of chaos and non-linear dynamics are not able to capture such events [13]. Furthermore, methods used for accurate estimation of the Lyapunov exponents require huge data sets and they are highly sensitive to variations in the input parameters [13].
Heuristic/indices based metrics are experience based methods which are used because of their effort saving characteristics when the true solution of a problem is impractical and/or time consuming to reach or converge. The heuristics based assessment approaches generally are used to find solutions for a specific focus or type of system (e.g. flexible manufacturing systems). These approaches can be considered a valuable tool to compare initial designs with possible alternatives. Although heuristics based measures are often used due to their ease of use, it is debatable as to whether these measures reflect overall system complexity accurately [3]. Also, the applicability of heuristics based approaches over different types of systems is often limited. Drawn from the limitations described above, a hybrid complexity model is proposed to assess structural complexity of automation control logics.
3.Modelling of an automation process control logic
In this paper, a method that combines finite state machines (FSM) and petri nets approaches, to model the control logic of automated manufacturing processes is introduced. In this approach, each automation field device has an abstract definition of its generic behavior represented by a state-transition diagram (STD) composed of constant number of states and transitions. These abstract definitions are not tied-in any specific application [14]. In STDs, states are connected to each other through transitions governed by sequence interlock conditions [15]. Instead of decomposing a given automation process from top to down, a process can be synthesised from bottom to up by designing STDs for individual system’s components (e.g. sensors, actuators) and then connecting them in a way that enables them to cooperate and to achieve a common objective [16]. The connection between components is often called as interlocking or logically coupling the distributed STDs together to generate the system behaviours. In this approach, a system can be expressed mathematically as follows;
𝑠𝑦𝑠𝑡𝑒𝑚 = {𝑆, 𝑆𝑖, 𝑇, 𝐶} (1)
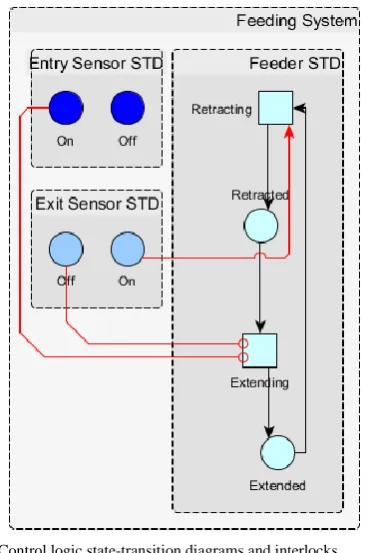
where: S is the set of all possible states in the STD, T is the set of all possible transitions in the STD, Si is the initial state of each component’s STD and C is the set of conditions that triggers the transitions. As an example, a STD describing the control behaviour of a simple feeding system control logic is given in Figure 2. This system includes three components. The feeder component can only exist in either one of two states
(“RETRACTED” and “EXTENDED”) connected by transitions
(“RETRACTING” and “EXTENDING”). The directed black
[image:3.595.44.276.73.233.2]links represents the internal conditions. External conditions associated with a STD can be defined as the logical combinations (logical “AND” and “OR”) of states of other
components. The external conditions are represented by red links and marked with an arrow or circle depends on the logical combination. Arrows represent the “AND” condition, whereas circles represent the “OR” condition. During execution, each component evaluates the transitions associated with the current state to determine whether the external conditions are satisfied for it to proceed to the next state [16]. As an example, the feeder proceeds from “RETRACTED” state to “EXTENDED” state via firing the “EXTENDING” transition which requires at least one of the two states (Entry Sensor=ON or Exit Sensor=OFF) satisfied.
4.Assessing complexity of an automation control logic
Structural complexity of automation control logic affects overall performance of the system. Highly complex automation logics often require a time-consuming programming phase, longer state checking times and relatively high computing power. Moreover, increased complexity in automation logic makes processes harder to diagnose and maintain. In this section, the Logical Complexity Index (CL) composed of six indices is introduced to be able to objectively evaluate structural complexity of control logic and compare differences among alternative structures. Overall CL score is calculated by Eq. 2.
𝐶𝐿= [∑𝑛𝑖=1(𝑐𝑖∗)2]/𝑛 (2)
where: ci * is the normalized value of each complexity index and n is the number of total complexity indices. Complexity indices used in the CL are described in the following sections.
4.1.Coupling Index, cc*
The coupling index chiefly developed by [17] focuses on two essential components of a typical connected structure (i.e.
number of elements and the interrelation between these elements). The coupling index is calculated by Eq. 3.
𝑐𝑐∗= 1 −∑ 𝑁𝑁
𝑖 𝑖=𝑁 𝑖=1
(3)
where: N is the total number of states and transitions and Ni is the total number of states and transitions directly connected to the state or transition “i”. Higher scores of coupling index is indicative of a more complex logic.
4.2.Restrictiveness Index, cr*
Restrictiveness estimator developed by [18] represents the ratio between number of existing direct and indirect precedence relations and the theoretical maximum number of direct and indirect relations. Restrictiveness index is calculated by Eq. 4.
𝑐𝑟∗=
2 ∑ 𝑟𝑖𝑗−6(𝑁−1)
(𝑁−2)(𝑁−3) (4)
where: rij is a reachability indicator, such that:
𝑟𝑖𝑗 = {10 𝑖𝑓 𝑡ℎ𝑒𝑟𝑒 𝑖𝑠 𝑛𝑜𝑡 𝑎 𝑝𝑎𝑡ℎ 𝑓𝑟𝑜𝑚 𝑒𝑙𝑒𝑚𝑒𝑛𝑡 𝑖 𝑡𝑜 𝑗𝑖𝑓 𝑡ℎ𝑒𝑟𝑒 𝑖𝑠 𝑎 𝑝𝑎𝑡ℎ 𝑓𝑟𝑜𝑚 𝑒𝑙𝑒𝑚𝑒𝑛𝑡 𝑖 𝑡𝑜 𝑗 (5)
Restrictiveness index varies between zero and one. High values represent serial operations, whereas low values indicates parallelism.
4.3. Diameter Index, cd*
Diameter index proposed by [19] is the longest shortest path between inputs and outputs of an automation sequence. That is, if the length of the shortest path between input i and output j is Dij, then the diameter index of the automation sequence can be calculated by Eq. 6.
𝑐𝑑∗ = 1 −𝑒0.05 (𝑚𝑎𝑥𝑖𝑗(𝐷𝑖𝑗))1 (6)
In this paper, diameter index is referred as the operation size, higher scores mean longer operations.
4.4.Branching Index, cx*
Branching in an automation sequence is measured by means of cyclomatic number developed by [20]. Cyclomatic number is a widely used software metric to analyse complexity of control flows. In this paper, this metric is used to analyse decisional complexity of an automation sequence. Branching index is calculated by Eq. 7.
𝑐𝑥∗= 1 −𝑒0.05 (|𝑁𝐿|−|𝑁𝑆|−|𝑁𝑇|+2)1 (7)
where; NS is the total number of states, NT is the total number of transitions and NL is the total number of internal and external conditions.
4.5. Centralization Index, cs*
[image:4.595.74.259.73.350.2]As the process becomes centralized, changing or modifying its structure becomes difficult. Therefore, centralization index developed by [19] is used to capture the degree of centralization
4 Author name / Procedia CIRP 00 (2016) 000–000
for a given sequence of operation. Centralization index is calculated by Eq. 8.
𝑐𝑠∗=(𝑁−1)(𝑉(𝑘)−1)1 ∑𝑁𝑖=1(𝑉(𝑘) − 𝑉(𝑖)) (8)
where: V(i) is the total number of input and output links of the ith element and V(k) is the maximum value of V(i) in the sequence. cs* can obtain two limited values: i.e. cs* =1 in case that the structure is centralized to the maximum degree, cs*=0 in case that the structure is decentralized to the maximum degree.
4.6.Uncertainty Index, cu*
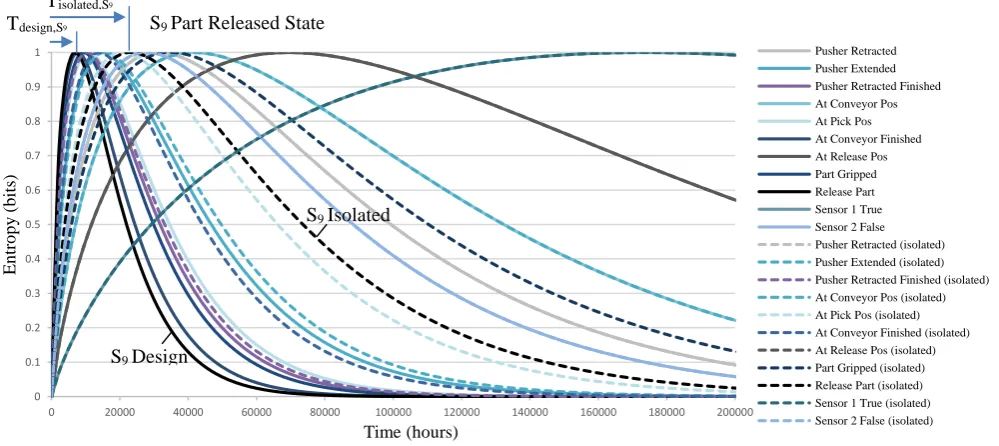
Uncertainty index investigates the probability of completion of an automation cycle. Operational characteristics of an automated system are heavily influenced by structural properties of its logic. Automations with a complex logic (e.g. highly connected) are more fragile to input fluctuations (e.g. functionality changes, modifications, etc.). Uncertainty index relates structural complexity of a given sequence to its operational uncertainty caused by internal disturbances such as component failures. The proposed index calculates the difference in time to reach the theoretical maximum uncertainty between states with and without external component conditions. It is hypothesised that if the time required to reach the maximum entropy for a state deviates from its isolated form, the state is suffering from the structural complexity. Thus the efficiency of the design should be penalized. Uncertainty Index cu* is calculated by Eq. 9.
𝑐𝑢∗ =
∑ (1− 𝑇𝑑𝑒𝑠𝑖𝑔𝑛,𝑖
𝑇𝑖𝑠𝑜𝑙𝑎𝑡𝑒𝑑,𝑖 𝑁𝑠
1 )
𝑁𝑠 (9)
where: Ns is the total number of states (not including transitions), Tisolated,i is a theoretical time to reach the maximum uncertainty for component state i as it is isolated from external conditions and Tdesign,i is a theoretical time to reach the maximum uncertainty for component state i as it is interlocked with other components in a logical order.
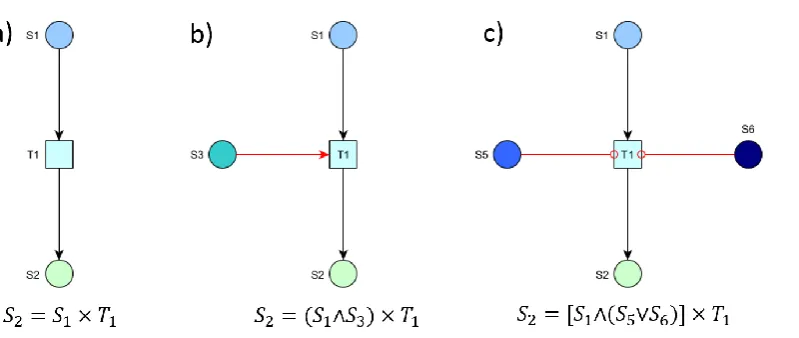
In order to calculate the theoretical time, the probability to reaching a state in an automation cycle is modelled using an algebraic representation. In this representation, interlock conditions are represented by binary operators ∧ (AND) and ∨ (OR) and transitions between successive states are denoted by
a multiplication operator (×). It is assumed that each state and transition event can be either completed or not completed. Hence, the probability of completion of a state is described as a function of the probability of completion of predecessor transition and probability of completion of the conditions that need to trigger that transition. Figure 3 shows three transitions having different execution conditions. In Figure 3a, the probability of completion of State 2 (S2) depends on the
probability of completion of State 1 (S1) and the probability of
completion of Transition 1 (T1). Therefore, probabilities of
completion of this state is calculated by multiplying the probability of completion of condition and transition, as follows (Eq. 10);
𝑆2= 𝑆1× 𝑇1= 𝑆1𝑇1 (10)
Figure 3b describes a state transition that requires an external condition (AND) to proceed. In such cases, the condition that has the lowest probability of completion among all conditions linked with “AND” logic, is multiplied with the success rate of the associated transition in order to calculate the probability of completion of successive states. The function of the binary operator ∧ (AND) is described by Eq. 11.
𝑆2= (𝑆1∧ 𝑆3) × 𝑇1= [min (𝑆1, 𝑆3)] 𝑇1 (11)
In cases where the transitions is executed with OR logic, the condition with the maximum probability of completion is selected. For example, the probability of occurrence of State 2 in Figure 3c is calculated as follows;
𝑆2= [(𝑆1∧ (𝑆5∨𝑆6)] × 𝑇1= [min (𝑆1, max(𝑆5, 𝑆6))] 𝑇1 (12)
Once the whole system is described by the proposed algebraic representation, the probability of completion of each state with respect to the conditions of its predecessor conditions can be found. In this research, the probability of completion of all system inputs and all transitions are assumed to be independent from other system activities and equal to the corresponding component’s reliability. They are calculated as follows;
𝑆𝑖𝑛𝑖𝑡𝑖𝑎𝑙,𝑘= 𝑇𝑖,𝑘= 𝑒
−𝑡𝑘
𝑀𝑇𝐵𝐹𝑘 (13)
[image:5.595.103.503.65.234.2]where: Sinitial,kis the input state of component k (only valid if the state does not have any predecessor state and is an input state for the system), Ti,k is the ith transition of component k, tk
is the kthcomponent service time, and MTBFk is the mean time between failure of component k. Hence, time-dependent uncertainty of a component state Hk, can be computed using Shannon’s information entropy formulation [21] described as follows;
𝐻𝑘= − ∑2𝑖=1𝑆𝑖𝑙𝑜𝑔𝑆𝑖 (14)
where: Si is the probability of completion of the component state and i is the events i.e. completed or not completed. The inflection point of time-dependent uncertainty of a component state with respect to its service time is the maximum uncertainty point, and the time required to reach this point are Tdesign,i and Tisolated,i for non-isolated and isolated components, respectively. The proposed uncertainty index has a range between 0 and 1. To reduce unpredictability of a process due to its complexity, interdependency between components should be minimized and critical components should have high reliability.
5.Use case
The developed Logical Complexity Index (CL) is applied to
an automatic pick and place process to assess its logical complexity. A Festo table size test system (Fig. 4) was modelled in a virtual process planning and simulation environment. The part of the system used as case study consists of three actuators and two sensors. The STD describing the control logic is composed of a total of eleven states, six transitions and seven sequence interlock conditions. Only the automated (auto-mode) sequence was considered in the calculations (i.e. no re-initialization or manual sequence). The process consists in picking small cylinders from pusher magazine and placing them onto a conveyor using a pick and place swivel arm and suction. The process consists of following steps;
Sensor 1 checks the status of the magazine (i.e. empty or full),
Pusher pushes a cylinder part to the picking location,
Sensor 2 detects part presence at pick location,
Swivel arm moves to picking location,
Vacuum gripper mounted on the swivel arm picks the part,
Sensor 2 checks the status of picking location (i.e. empty or full),
Pusher moves to home position,
Swivel arm moves to conveyor location and,
Vacuum gripper releases the part on the conveyor.
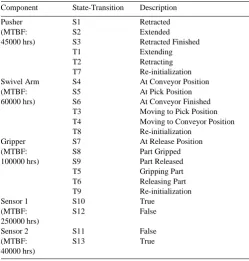
[image:6.595.44.552.73.299.2]Table 1 shows the states and transitions, and the assumed mean time between failures rates of each component used in the process.
Table 1. Component’s state-transition information and MTBF values Component State-Transition Description
Pusher (MTBF: 45000 hrs)
S1 Retracted S2 Extended S3 Retracted Finished T1 Extending T2 Retracting T7 Re-initialization Swivel Arm
(MTBF: 60000 hrs)
S4 At Conveyor Position S5 At Pick Position S6 At Conveyor Finished T3 Moving to Pick Position T4 Moving to Conveyor Position T8 Re-initialization
Gripper (MTBF: 100000 hrs)
S7 At Release Position S8 Part Gripped S9 Part Released T5 Gripping Part T6 Releasing Part T9 Re-initialization Sensor 1
(MTBF: 250000 hrs)
S10 True S12 False Sensor 2
(MTBF: 40000 hrs)
S11 False S13 True
[image:6.595.310.560.505.767.2]6 Author name / Procedia CIRP 00 (2016) 000–000
According to the results, a CL score is recorded as 0.1354
which indicates the control logic is simple and design is valid. The individual complexity indices are recorded as: coupling: 0.0808, restrictiveness: 0.5619, diameter: 0.3296, branching: 0.1392, centralization: 0.5625 and uncertainty: 0.2149. This result aligns with the engineering intuition i.e. a simple process executed by a few simple components. Accordingly, the process reaches the theoretical maximum uncertainty averagely 21.49% faster due to its logical coupling. Moreover, logical dependencies of each component are found as follows: Gripper (47.82%), Swivel arm (30.85%), Pusher (0.13%), Sensor 1 (0.0%), and Sensor 2 (0.0%). Time-dependent entropy scores for each state is illustrated in Figure 5.
6.Conclusion
In this paper, an objective approach for evaluation of automated manufacturing process designs based on structural complexity of the automation control logic was developed. Six complexity indices which capture structural properties of the logic were defined and formulated. The introduced indices are useful at the early design stages when designing the automation logic, and reducing coupling and redundancies. The individual complexity indices are combined into a single complexity Logical Complexity Index (CL). The developed model aims at
providing support for automation systems’ engineers in the earliest possible phases of the system design and engineering. Future work will focus on implementing design support functionalities based on the presented model, which will be integrated in a virtual process planning and simulation solution, namely the vueOne virtual developed by WMG, university of Warwick and used in this research to model the process of the system used as case study.
Acknowledgment
The authors gratefully acknowledge the support for this work from UK EPSRC, through the Knowledge-Driven Configurable Manufacturing (KDCM) research project.
References
[1] Zhang T, Efstathiou J. The complexity of mass customization systems under different inventory strategies. Int J Comput Integr Manuf 2006;19:423–33.
[2] Cho S, Alamoudi R, Asfour S. Interaction-based complexity measure of manufacturing systems using information entropy. Int J Comput Integr Manuf 2009;22:909–22.
[3] Elmaraghy W, Elmaraghy H, Tomiyama T, Monostori L. Complexity in engineering design and manufacturing. CIRP Ann - Manuf Technol 2012;61:793–814.
[4] Efstathiou J, Calinescu A, Blackburn G. A web-based expert system to assess the complexity of manufacturing organizations. Robot Comput Integr Manuf 2002;18:305–11.
[5] Modrak V, Marton D. Configuration complexity assessment of convergent supply chain systems. Int J Gen Syst 2014:37–41. [6] Chryssolouris G, Efthymiou K, Papakostas N, Mourtzis D,
Pagoropoulos A. Flexibility and complexity: is it a trade-off? Int J Prod Res 2013;51:6788–802.
[7] Frizelle G, Woodcock E. Measuring complexity as an aid to developing operational strategy. Int J Oper Prod Manag 1995;15:26–39.
[8] Deshmukh A V, Talavage JJ, Barash MM. Complexity in Manufacturing Systems Part 1 : Analysis of Static Complexity 1 Introduction. IIE Trans 1998;30:645–55.
[9] Espinoza V, ElMaraghy H, AlGeddawy T, Samy SN. Assessing the structural complexity of manufacturing systems layout. Proc 4th CIRP Conf Assem Technol Syst 2012:65–70.
[10] Suh N. Complexity: theory and applications 2005.
[11] Calinescu A. Manufacturing Complexity : An Integrative Information-Theoretic Approach 2002.
[12] Efthymiou K, Pagoropoulos a., Papakostas N, Mourtzis D, Chryssolouris G. Manufacturing systems complexity review: Challenges and outlook. Procedia CIRP 2012;3:644–9.
[13] Efthymiou K. On the assessment of manufacturing systems complexity. University of Patras, 2013.
[14] Harrison R, Lee SM, West AA. Lifecycle engineering of modular automated machines. 2nd IEEE Int Conf Ind Informatics, INDIN’04 2004:501–6.
[15] Lee SM, Harrison R, West a a. A component-based control system for agile manufacturing. Proc Inst Mech Eng Part B J Eng Manuf 2005;219:123–35.
[16] Harrison, R., Lee, S. M., Ong, M. H., & West AA. Distributed engineering of modular reconfigurable automation systems. Inf Control Probl Manuf 2006;12:553–8.
[17] Maksimović R, Petrović S. Complexity of production structures. Facta Univ Mech Eng 2009;7:119–36.
[18] Mastor A a. An Experimental Investigation and Comparative Evaluation of Production Line Balancing Techniques. Manage Sci 1970;16:728– 46.
[19] Modrak V. Business Process Improvement through Optimization of its Structural Properties. Work Handb 2005:75–90.
[20] McCabe TJ. A Complexity Measure. IEEE Trans Softw Eng 1976;SE-2.
[image:7.595.46.546.62.285.2][21] Shannon CE. A mathematical theory of communication. ACM SIGMOBILE Mob Comput Commun Rev 2001;5:3.
Fig. 5. Uncertainty index calculation
0 0.1 0.2 0.3 0.4 0.5 0.6 0.7 0.8 0.9 1
0 20000 40000 60000 80000 100000 120000 140000 160000 180000 200000
En tro p y (b it s) Time (hours) Pusher Retracted Pusher Extended Pusher Retracted Finished At Conveyor Pos At Pick Pos At Conveyor Finished At Release Pos Part Gripped Release Part Sensor 1 True Sensor 2 False Pusher Retracted (isolated) Pusher Extended (isolated) Pusher Retracted Finished (isolated) At Conveyor Pos (isolated) At Pick Pos (isolated) At Conveyor Finished (isolated) At Release Pos (isolated) Part Gripped (isolated) Release Part (isolated) Sensor 1 True (isolated) Sensor 2 False (isolated)
S9 Isolated
S9 Design
S9 Part Released State