University of Warwick institutional repository: http://go.warwick.ac.uk/wrap
This paper is made available online in accordance with publisher policies. Please scroll down to view the document itself. Please refer to the repository record for this item and our policy information available from the repository home page for further information.
To see the final version of this paper please visit the publisher’s website. Access to the published version may require a subscription.
Author(s): B.H. Nielsen, P.T. Thomsen, L.E. Green, J. Kaler Article Title: A study of the dynamics of digital dermatitis in 742 lactating dairy cows
Year of publication: 2011 Link to published article:
http://dx.doi.org/10.1016/j.prevetmed.2011.10.002
A study of the dynamics of digital dermatitis in 742 lactating dairy cows 1
B.H. Nielsena*, P. T. Thomsena, L.E. Greenb & J. Kalerbc 2
3
a
Section of Epidemiology and Management, Department of Animal Science, Aarhus University, 4
Blichers Allé 20, DK-8830 Tjele, Denmark 5
b
School of Life Sciences, University of Warwick, Coventry CV4 7AL, UK 6
c
Jasmeet Kaler’s current address, The School of Veterinary Medicine and Science, The University 7
of Nottingham, Sutton Bonington Campus, Sutton Bonington, Leicestershire LE12 5RD, UK 8
9
Summary 10
Digital dermatitis (DD) is a contagious disease of cattle affecting the skin of the claw. The disease 11
presents with a range of severities and can be associated with lameness. Information about the 12
disease dynamics of DD is scarce. Parity and lactation stage have been identified as risk factors for 13
DD and studies have also indicated that not all cows are equal regarding their risk of recurrent 14
disease and prospects for cure from DD. The aim of this study was to investigate host heterogeneity 15
to DD and to identify disease patterns of DD and factors associated with the development and 16
resolution of lesions. In three commercial dairy herds, 742 lactating cows were observed for DD 17
lesions weekly for 11 or 12 weeks. The effects of parity, lactation stage and duration of preceding 18
episode on the hazard of transitions between healthy and lesion states were analysed using a 19
multilevel multistate discrete-time model. One or more DD lesions were observed in 460 cows and 20
lesions were observed in 2426 out of 10585 observations. In total, 1755 uncensored episodes with 21
DD lesions were observed. Early lactation was associated with a reduced risk of developing lesions 22
compared with mid and late lactation. Lesions that developed in late lactation had a greater 23
reduced risk of lesions developing in parity 3 compared with parity 1 cows, but an increased risk of 25
lesions developing in parity 2 compared with parity 1 cows. In the present study, the mean duration 26
of uncensored DD episodes was 1.7 weeks indicating that the duration of the majority of DD lesions 27
might be shorter than the 42 days reported previously. The transitions between disease states 28
suggest that DD is a dynamic disease, and that the early stage lesions are more transient than 29
expected from previous studies. We conclude that studies with shorter observation intervals than 30
one week are needed to fully understand and describe the individual and group dynamics of DD. 31
32
Key words: Digital dermatitis, Dairy cow, Multistate multilevel discrete-time model, Disease 33
dynamics 34
35
Introduction 36
Digital dermatitis (DD) is a contagious disease of cows affecting the skin of the claw. Lesions are 37
painful and can be a cause of lameness. DD lesions are present in 70-95% of dairy herds in the USA 38
and Denmark (Capion et al., 2008; Cramer et al., 2008) with a within herd prevalence of 20-30% in 39
Europe and the USA (Holzhauer et al., 2006; Capion et al., 2008; Cramer et al., 2008; Barker et al., 40
2009). Diseases associated with lameness in dairy cows can reduce milk yield and have a negative 41
economic impact (Enting et al., 1997; Green et al., 2002; Bicalho et al., 2008; Ettema et al., 2010). 42
Although DD is sometimes associated with reduced yield (de Jesus Argaez-Rodriguez et al., 1997) 43
this is not always the case (Amory et al., 2008; Tadich et al., 2010). The financial costs due to 44
single cases of DD are not as high as those for sole ulcer or white line disease (Ettema et al., 2007), 45
but because of the high prevalence of DD, there is a high cost in terms of time spent treating DD 46
lesions (Bruijnis et al., 2010) and cow welfare is compromised. 47
Digital dermatitis appears to be caused by several species of bacteria and certain Treponema species 49
play a crucial role (Yano et al., 2010; Klitgaard et al., 2008; Demirkan et al., 1998, Döpfer et al., 50
1997). An increased risk of DD has been associated with the early stages of lactation and first and 51
second parity cows (Somers et al., 2005a; Holzhauer et al., 2006; Barker et al., 2009). Holzhauer et 52
al. (2008a) reported that cows in their first or second parity were at greater risk of persistent or 53
recurrent disease compared with cows in parity three or more. Poor hygiene in the cows’ 54
environment has been associated with a higher risk of disease (Barker et al., 2009; Somers et al., 55
2005a; Rodriguez-Lainz et al., 1999; Nowrouzian & Radgohar, 2011). 56
57
There is a range of stages of DD lesions which are reflected in different DD scoring systems 58
(Döpfer et al., 1997; Manske et al., 2002). Döpfer et al. (1997) described four disease classes based 59
on gross as well as histological evaluation: early lesions, classical ulcerations, healing lesions and 60
lesions of suspected DD. Manske et al. (2002) described five disease stages on a nominal scale from 61
1-5 based on a gross examination of lesions. Scores 1 and 2 are early lesions with an intact 62
epidermis, score 3 is an ulcerative lesion with no signs of healing and scores 4 and 5 are late lesions 63
in the process of healing. 64
65
It has been suggested that cows could be grouped according to their ‘DD history’ by having no 66
lesions, single lesions or recurring lesions (Dopfer et al., 2004; Holzhauer et al., 2008a) thereby 67
indicating that not all individuals are equal regarding their risk of recurrent infections and prospect 68
of cure from DD. In many studies, DD lesions are considered to be persistent. Nielsen et al. (2009) 69
reported durations of clinical, topically treated DD lesions of approximately 40 days and other 70
studies have reported that ulcerative lesions persist for months (Dopfer et al., 1997; Somers et al., 71
stages were frequent, occurring in 39-67% of cases. This indicates that studies with frequent 73
observations are needed to describe disease dynamics in details. 74
75
Recent advances in analytical tools include multistate models where the transition between states 76
can be modelled jointly allowing for correlations between states to allow for unobserved host 77
heterogeneity and testing whether the effects of predictor variables are state specific. Multilevel 78
multistate discrete-time models are composed of simultaneous equations for transitions between 79
diseased and healthy states, where each equation defines a discrete-time hazard. It was first 80
described by Steele et al. (2004). The discrete-time approach is used when observations are made at 81
intervals and it is therefore natural to specify a model that assumes measurements in discrete time. 82
Standard methods for analysing discrete response data apply to this type of data and existing 83
estimation procedures can be used to fit even complex event-history models (Steele et al., 2005). 84
When events can occur more than once to an individual, unobserved individual-specific risk factors 85
can be present affecting the occurrence of each event and so the occurrence and/or durations 86
between events within same individual might be correlated. This possible dependence between 87
event times within individuals can be investigated with a hierarchical structure, with events nested 88
within individuals and allowing for correlation between random effects for different events. 89
90
The hypothesis of the present study was that cows are heterogeneous in their probability of DD 91
disease occurrence, duration and resolution. The aim of this study was to investigate host 92
heterogeneity to DD and to identify disease patterns of DD and factors associated with the 93
development and resolution of lesions that might direct future research or inform advisors and 94
farmers. 95
Materials and methods 97
Source of data 98
The data were sourced from three commercial Danish dairy herds that were among eight farms in a 99
clinical trial conducted to evaluate the effects of automatic hoof washing on prevention and cure of 100
DD. In all three herds, the cows were housed in loose housing systems with mattress or mat bedded 101
cubicles. Herds A and B had slatted floors, whereas herd C had a solid concrete floor; all floors 102
were scraped by automatic scrapers. None of herds used pasture grazing and none of the cows had 103
access to outdoor areas. All three had a milking carrousel, which provided good conditions for 104
scoring DD lesions during milking. Information about individual cows was obtained from the 105
Danish Cattle Database. The dominant breed in all three herds was Danish Holstein (DH). 106
107
All three herds were in a clinical trial and as a consequence each herd had an automatic hoof 108
washing machine that washed the left feet of each lactating cow after every milking; the right feet 109
were left unwashed. For the weekly examinations, conducted in the present study, both hind legs 110
were washed manually with a water hose in order to evaluate the skin in the heel region for DD 111
lesions. During the study period, DD lesions could be individually treated by the owners using their 112
normal routine (there was no specific protocol) typically bandages containing salicylic acid. All 113
cows’ feet in the three herds were examined in a hoof trimming chute shortly before the study 114
started and once during the study period and their feet were trimmed if necessary. 115
116
Observations 117
Observations of DD lesions were made during milking as described by Thomsen et al. (2008). DD 118
lesions were recorded on 12 occasions in two herds and on 11 occasions in one herd with a mean 119
using an ordinal scale described by Manske et al. (2002) (Table 2). Only lesions in the skin in the 121
heel region of the hind feet were scored and if more than one lesion was present the most 122
predominant lesion on a foot was recorded. Observations were done by BHN, PTT or a trained 123
research technician from Aarhus University. All observers were highly trained and experienced in 124
the use of the scoring system presented by Manske et al. (2002). Before starting the observations, 125
the three observers were calibrated by looking at pictures of DD lesions and discussing the DD 126
scoring system in order to obtain a high degree of agreement. 127
128
Statistical analysis 129
Missing observations at the beginning and end of the observation period were excluded from the 130
analysis and when data were missing from the middle of the observation period (for example when 131
a cow was away during the dry period) only the longest uninterrupted sequence of observations 132
from each individual was used. Only data from cows with more than one observation were kept. 133
Frequency distributions and measures of central tendency and dispersion were done in SAS version 134
9.1 (SAS Inst., Inc., Cary; NC, USA). The number of cows and feet that had, or developed, DD and 135
the cases of DD by lesion score for each week were calculated. Occurrence of DD lesions was 136
defined as a change from no lesion to a lesion of any lesion score from one observation to next. 137
Likewise, resolution of DD lesions was defined as change from any lesion score to no lesion at the 138
next observation. The number of lesion occurrences and resolutions as well as transitions between 139
disease states was explored. The incident lesions per weekly observation were calculated with the 140
denominator excluding those feet with a lesion at the previous observation. The mean number of 141
incident lesions per affected cow and the mean duration of lesion episodes were calculated. 142
A multivariable multistate discrete time model was run in MLwiN 2.18 (Rasbash et al., 2004). For 144
the multistate model two states were defined 0 = healthy (no DD lesion), 1 = diseased (DD score > 145
0). Data were censored at the end of the study. An episode was a continuous period of time 146
(measured in discrete-time intervals) one foot spent in one state until a transition or censoring 147
occurred. For each episode j for foot k for cow l the duration spent in state i was categorised into 148
discrete-time intervals of week where tij = 1, 2,…, n with n being the maximum duration of an 149
episode and an outcome event at the end of the discrete-time interval, y, depicting whether a 150
transition occurred (y = 0 if no change of state; y = 1 if change from healthy to diseased (= 151
occurrence) or from diseased to healthy (= resolution)). Each leg could experience multiple 152
transitions between states over time and thus have multiple episodes. 153
154
Model setup 155
If we denote by h (ri)tijklthe hazard of transition from origin state i to transition state ri during 156
discrete-time interval t of episode j for foot k for cow l, and h (0)tijkl denotes the hazard of no 157
transition, a multilevel, multistate discrete-time model may be written as 158
159
log (h (ri)tijkl / h (0)tijkl) = 160
β(ri)
0 + β (ri)iz(ri)tijkl+β(ri)iDIM(ri)tijkl +β(ri)iParity(ri)tijkl+ β(ri)iLeg(ri)tijkl+ μ(ri)il 161
ri = 0, 1; i = 0, 1. 162
163
where β(ri)0 is the state-specific intercept, β (ri)iz(ri)tijkl represents the effect of duration which in this 164
case takes a piece-wise constant step function of time with duration intervals of 1, 2, 3-6 and 7+ 165
weeks. The covariates days in milk (DIM,) parity and foot are defined at cow-level. Unobserved 166
are assumed to follow a multivariate Normal distribution with covariance structure Ωμ and non zero 168
correlation between random effects. 169
170
Covariates 171
The model included the following fixed effects: Days in milk (DIM) (categorical; 1 = 0-90 DIM / 2 172
= 91-180 DIM / 3 = >180 DIM), parity (categorical; 1 / 2 / ≥3), herd (categorical; A / B / C) and 173
foot (binary; left (washed) / right (unwashed)). DIM was fixed at the first discrete time interval of 174
an episode. 175
176
The parameter estimates from the model was fitted with Monte Carlo Markov chain (MCMC) 177
estimation for 500,000 iterations with a burn in of 5000. Chain mixing and stability were evaluated 178
visually. The model was rerun excluding left feet. 179
180
Results 181
Descriptive results 182
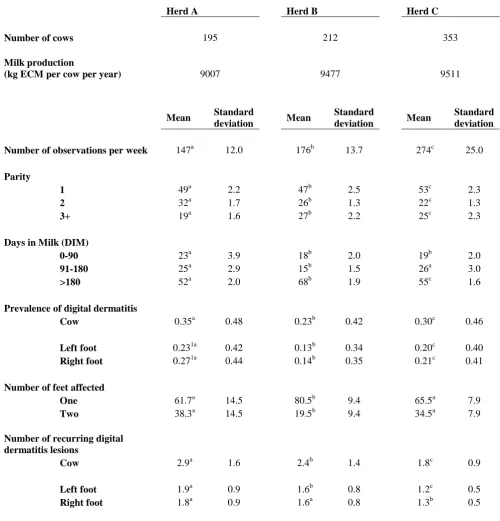
The characteristics of the three herds regarding size, milk production, number of observations from 183
each herd, distribution of cows in parity groups and lactation stages (DIM) and prevalence of DD 184
lesions are presented in Table 1. The prevalence and incidence of lesions varied by farm. 185
186
In total, 14051 observations were made on 760 cows. Of these, 3466 (25%) observations (18 – 31% 187
per herd) were excluded for reasons stated in the methods. The final data set contained 5300 188
observations from the left leg (739 cows) and 5285 from the right leg (738 cows); in total there 189
were 10585 observations on 742 cows. The mean number of observations from the left leg was 7.2 190
which had no lesions during the study period. DD lesions were observed on 460/742 (62%) cows on 192
at least one occasion. At the recordings, 407 cows presented with a lesion on one foot only and 246 193
cows had lesions on both feet on at least one occasion. Furthermore, 250 cows had a DD lesion 194
present at their first observation and 390 incident cases (new cases in feet at risk) were observed, 195
corresponding to each affected cow having a median of 2 (inter quartile range (IQR) = 1-3) 196
occurrences of lesions. 197
198
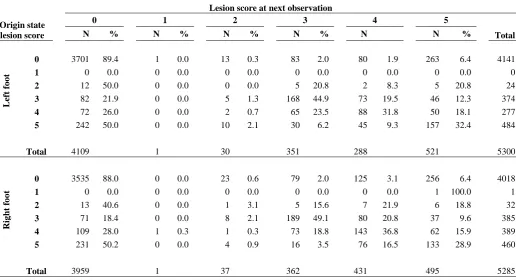
Only a few cases of lesion scores 1 or 2 were observed; the majority were scores 3 – 5 (Table 2). 199
The majority of healthy episodes remained healthy at the next observation (Table 3). Transitions 200
between states occurred in both directions. The most common transition in both feet was from 201
healthy to DD lesion score 5 (60% and 53% of transitions on left and right foot respectively). In the 202
left leg, resolution were seen in 50% of score 2, 22% of score 3, 26% of score 4 and 50% of score 5 203
lesions. A similar pattern was seen in the right foot (Table 3). Approximately 50% of score 3 204
lesions persisted at score 3, whilst approximately 30% of score 4 and 5 lesions remained at the same 205
lesion score from one observation to the next. 206
207
There were 1755 uncensored episodes: 848 were on the left foot (440 occurrences + 408 208
resolutions) and 907 were on the right foot (483 occurrences + 424 resolutions) (Table 4). The 209
number of transitions by explanatory variables is presented in Table 5. Lesions developed in 11% 210
(923/8159) of healthy episodes and resolution was observed in 34% of diseased episodes 211
(832/2426) (Table 4). There was no significant difference in the number or direction of transitions 212
between left and right foot (Table 4). 213
The prevalence of incident cases over time stratified by herd is illustrated in Figure 1. The mean 215
prevalence of incident lesions per observation was 12.6 / 100 feet (SD: 9.8; Median: 7.5; IQR = 6.0-216
19.2). Of the censored episodes, 1363 had no lesion and 730 had lesions at the time of censoring. 217
There were 64% (535/832) of recoveries in the first time interval, 46% (138/297) of those still 218
affected recovered in the second time interval and 95% (151/159) of those still affected recovered 219
during the third to sixth time interval. The pattern of resolutions was similar in each foot (results not 220
shown). The mean duration of uncensored DD episodes was 1.7 weeks (SD = 1.2; median = 1; IQR 221
= 1-2), 54% (603/1118) of episodes had a duration of 1 week (Table 6). 222
223
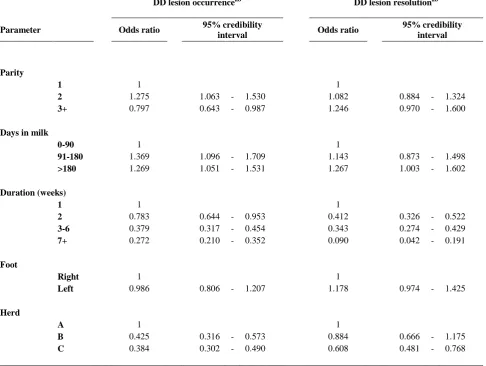
Multilevel multistate model 224
Results from the parameter estimation are presented as odds ratios (OR) with 95% credibility 225
intervals (CI) in Table 7. 226
227
Second parity cows were more likely to develop lesions than first parity cows (OR = 1.28; CI = 228
1.06-1.53), whereas cows of parity 3 or more were less likely to develop lesions (OR = 0.80; CI = 229
0.64-0.99). Cows in early lactation were less likely to develop a lesion than cows in mid (OR = 230
1.37; CI 1.10-1.71) or late (OR = 1.27; CI = 1.05-1.53) lactation, whereas resolution was more 231
likely when lesions developed in late lactation (OR = 1.27; CI = 1.00-1.60) compared with early 232
lactation. The duration of an episode had a significant effect on the risk of occurrence and 233
resolution. The longer a period without a lesion the less likely a transition to a lesion was to occur. 234
Also, resolution was more likely the shorter the lesion episode. Although not significant, the 235
probability of resolution tended to be higher in the left, washed foot than in the right, unwashed foot 236
(OR=1.18; 95% CI: 0.97-1.43). 237
When fitting a basic model only including duration effects (estimates not shown), the estimated 239
random effects (footnote to Table 7) showed evidence of unobserved heterogeneity between cows 240
in their hazard of particularly lesion occurrence (p-value < 0.05; confidence interval (CI) = 0.25-241
0.75), but also resolution (p-value < 0.05; CI = 0.03-0.17). After including covariates there was no 242
evidence of any unexplained random variability between cows in any states. There was non 243
significant correlation between random effects. The model converged visually with stable chain 244
mixing. The model with right feet only gave the same results (direction and magnitude) except that 245
confidence intervals were wider because there was less power in the study (data not shown). 246
247
Discussion 248
The objective of the present study was to investigate the occurrence and patterns of DD in cattle 249
observed each week for 12 weeks and to investigate host heterogeneity to DD. This study is the first 250
study exploring the dynamics between diseases states in cattle observed each week using a 251
multilevel multistate discrete-time model; this model has been recently used to investigate the 252
factors associated with transition between lameness states in sheep (Kaler et al., 2010). 253
254
Existing studies on DD describe DD as a prevalent and rather persisting disease (Dopfer et al., 255
1997; Capion et al., 2008; Holzhauer et al., 2006; Nielsen et al., 2009). The majority of studies have 256
observed DD on a monthly basis, which seems plausible given the assumption that a lesion lasts 257
approximately 50 days. However, as shown by Holzhauer et al. (2008b) weekly transitions between 258
disease stages are common and based on this, we decided that weekly observations would be 259
appropriate to elucidate patterns of transition between disease states. Nevertheless, few observations 260
of early disease stages (scores 1 and 2) were made in the present study, indicating that these 261
occurred within two weeks. The rapid resolution of DD lesions was unexpected given previous 263
research. By observing more than once a week, more information might have been gained on these 264
rapid transitions. Therefore, results from this study suggest that it would be beneficial to decrease 265
observation intervals in future studies aiming at learning more about changes in DD disease states. 266
However, as lesions can only be evaluated after washing more frequent observation also means 267
more frequent washing. This could possibly have an effect on the prevalence (by reducing 268
persistence) of lesions. It might be that one month intervals (as used in many previous studies) are 269
sufficiently long to fail to observe resolution and reoccurrence with a second episode of disease 270
(those cows affected in the current study have a median of 2 occurrences of disease in 12 weeks, so 271
monthly recording might have indicated persistent disease of 8 or 12 weeks). A larger study would 272
have been useful because even with >700 cows with weekly observations there were insufficient 273
data to analyse transitions between different lesion scores of DD lesions in the multistate model. 274
275
The nearest similar study to the current paper was by Holzhauer et al. (2008b) who studied 138 276
cows for 4 weeks, examining each cow each week. The cows were grouped into different 277
management categories including dry cows and cows that had recently been on pasture, both factors 278
previously reported as protective factors for DD (Dopfer et al., 2008; Somers et al., 2005a), which 279
might have led to different infection pressures and dynamics in Holzhauer et al.’s (2008b) study 280
compared with the present study, where cows were housed permanently. Despite the differences 281
some useful information can be gleaned from comparing the two studies. Holzhauer et al. (2008b) 282
reported that 31% (62/202) of healthy feet developed a lesion within the 4-week study, whereas in 283
the present study approximately 49% of healthy feet developed a lesion during the 11-12 week 284
observation period, a lower incidence per week. Possible explanations for this difference might be 285
lactation, parity production level and other factors concerning the claw-health management (like 287
foot baths). Holzhauer et al. (2008b) reported that 25% (35/142) of early lesions and 14% (28/194) 288
of old lesions resolved within 4 weeks. In the present study, resolution was observed in 34% of 289
lesions. Holzhauer et al. (2008b) did not report the duration of lesions and it could be argued that 290
the low resolution rate, especially in old lesions, was because they lasted longer than the four weeks 291
of observation. In the present study, the majority of recoveries occurred within the first two weeks 292
of a disease event, but approximately 20% of disease episodes in which no resolution was observed 293
lasted at least three weeks. Also, the mean duration of censored disease events in the present study 294
indicates that some lesions might last for weeks even though the mean duration of uncensored 295
disease events was shorter, this also indicates that certain cows had lesions that persisted. 296
297
The fact that the majority of resolutions occurred within the first two weeks of a disease event 298
might indicate that the duration of DD lesions might be shorter than that reported in previous 299
studies (Dopfer et al., 1997; Somers et al., 2005b; Nielsen et al., 2009). The fact that the majority 300
(78%) of all transitions occurring in healthy feet were recorded directly to presumed late lesions 301
(score 4 or 5) also indicates a possible shorter duration of early disease states than expected: the 302
very low number of early lesions (score 1 & 2) suggest that these states might be very transient and 303
therefore more difficult to detect with weekly observations. Furthermore, these lesions are typically 304
small and thus easier to miss during observation. 305
306
There was between cow heterogeneity with some cows never affected and other cows with 307
persisting lesions. The duration of the episode affected the hazard of a transition with the longer the 308
episode the less likely a transition. This applied to occurrence as well as resolution of lesions. This 309
where three types of individual dynamics were defined: unaffected cattle, single lesion cattle and 311
the cattle with repeated, persisting lesions. 312
313
Studies on host differences are needed to identify factors that might affect these individual 314
dynamics. In the present study some host factors were studied. Parity 2 cows seemed to be more 315
likely to recover from lesions than parity 1 cows, and parity 3 cows had a reduced hazard of 316
developing, and tended to have a higher likelihood of resolution from lesions compared with parity 317
1 cows. This is in agreement with earlier studies reporting that younger cows were more susceptible 318
to DD than older cows (Barker et al., 2009; Holzhauer et al., 2008b; Somers et al., 2005b). 319
Holzhauer et al., (2008a) reported that parity 1 and 2 cows were more likely to develop persistent 320
lesions than older cows. This is supported by the higher probability of resolution in older cows 321
compared with parity 1 cows in the present study. In the present study, cows in early lactation were 322
less likely to develop lesions than cows in mid or late lactation. This is in contrast to earlier studies 323
that report late lactation as protective for the risk of developing DD (Somers et al., 2005a; 324
Holzhauer et al., 2008b; Barker et al., 2009). However, in the current study the duration of lesions 325
in late lactation was shorter than in those in early lactation, so previous studies might have missed 326
lesion occurrence because of the time between observations (Somers et al., 2005b) or because cows 327
recovered before they needed treatment (Barker et al., 2009), thereby leading to the impression that 328
lesions developed less frequently. 329
330
There was no significant effect on lesion occurrence or resolution from washing the left feet of the 331
cows although washing tended to have a positive effect on resolution. It can be speculated that 332
washing the feet might have reduced the infection pressure in the herd overall. If this is the case, the 333
335
One explanation for some of the different risks in the current study to those reported in earlier 336
studies is that several scoring systems have been used. In addition, in the current study only lesions 337
on the plantar skin bordering the interdigital space (the heel region) was assessed, whereas other 338
studies also recorded lesions at other sites (Dopfer et al., 2008; Holzhauer et al., 2008b). However, 339
in most studies the plantar skin is the most common site for DD lesions. Finally, the current study 340
reports the risks for transition from no lesion to a lesion and vice versa all within one model rather 341
than separate models, providing a novel angle on previous research. 342
343
In the present study, left feet were washed and right feet were not. This difference in management 344
between the legs could have biased the results. However, there were no significant differences 345
between feet with foot included as a fixed effect and results were similar when left feet were 346
excluded from the analysis. We therefore do not think that the automatic hoof washing had any 347
substantial effect on the duration of lesions or disease states. For a thorough examination of the skin 348
in the heel region both hind legs had to be washed manually at each recording. This meant that the 349
right feet were washed once weekly during the study period, while the left feet were washed 15 350
times a week (twice daily in the automatic washing machine plus one manual washing). With a 351
potential effect of weekly washing on the transitions between lesion scores and/or duration of DD 352
lesions this might mean that effects of washing in the present study were underestimated. 353
354
Three trained observers took part in this study. This might have influenced the results from the 355
study if a high degree of agreement between observers was not obtained. Thomsen et al. (2008) 356
evaluated the sensitivity and specificity of scoring DD lesions during milking compared with 357
observer agreement of the DD scoring system used in the present study has not been formally 359
tested. However, it has been shown that training and calibration improves the reliability of scoring 360
systems where some degree of subjectivity is present (Kristensen et al., 2006). In the present study, 361
the observers were experienced in using the DD scoring system and were trained before 362
observations started, and we thus feel confident, that a good calibration and an acceptable degree of 363
agreement was obtained. 364
365
In the present study, the dynamics of DD lesions were evaluated under normal conditions in three 366
commercial Danish dairy herds. There were only three farms studied and farm B had lower levels of 367
disease. No management factors were investigated so it is not possible to explain why the force of 368
infection might have been lower on this farm, however, all analyses were done controlling for farm 369
differences. The patterns of association between DD and the cow effects were consistent across all 370
farms even if the absolute baseline value per farm varied. The herds had similar housing systems 371
(although two had slatted and one had solid concrete floors) and in none of them the cows had 372
access to outdoor areas. As part of the protocol of the clinical trial all cows were examined in a hoof 373
trimming chute every six weeks and trimmed when needed and the three herds in the present study 374
therefore had a hoof trimming shortly before and one hoof trimming (or examination) during the 375
study period. We therefore expect that the state of the hooves was comparable between the farms. 376
DD lesions could be treated by the farmer using their usual routine and the decision on when and 377
how to treat DD lesions could therefore differ between herds. This might have influenced the 378
duration of lesions. However, by including herd as a fixed effect in the model we control for 379
treatment differences as well as other differences between herds. 380
Some consideration also has to be given the power of some estimates from the present study 382
because there in some categories only were a small number of episodes. For example, only eight 383
disease episodes ending in resolution lasted more than six weeks, which means that the parameter 384
estimate of the effect of long duration on this particular transition is less robust than estimates based 385
on more observations. 386
387
Conclusions 388
We conclude that cows are heterogeneous in their probability of occurrence and resolution of DD 389
lesions in hind legs. The occurrence and resolution of DD lesions was also influenced by stage of 390
lactation and parity. The majority of transitions between disease states occurred within two weeks, 391
indicating that DD under the circumstances in the present study was a very dynamic disease and 392
that the duration of the majority of DD lesions was shorter than the 42 days previously reported. 393
Further studies with shorter observation intervals are needed to confirm this. The multilevel 394
multistate discrete-time model was an appropriate method to evaluate the hazard of occurrence and 395
resolution from DD lesions. With more data available, this methodology could also be suited to 396
investigate the dynamics of the transitions between different disease states and heterogeneity 397
between cows. The strength of multistate models is that multiple transitions from multiple original 398
states, even with complex data with hierarchical structures, can be modelled simultaneously. 399
400
Acknowledgements 401
We thank the farmers for participating, the Knowledge Centre for Agriculture, Aarhus, Denmark for 402
providing data on herds and cows and The Department of Biological Sciences, University of 403
Warwick (now The School of Life Sciences) for hosting BHN. The study was partly funded by the 404
406
407
Competing interests 408
The authors declare that they have no competing interests 409
410
Authors’ contribution 411
BHN carried out the majority of the clinical examinations, participated in the design of the study, 412
participated in the statistical analysis and drafted the manuscript. LEG and JK participated in the 413
statistical analysis and helped to draft the manuscript. PTT participated in the design of the study, 414
did part of the clinical examinations and also helped to draft the manuscript. All authors have read 415
and approved the final manuscript. 416
Table 1: Herd characteristics in a study of digital dermatitis in 742 lactating cows in three 418
commercial dairy herds: cows, milk production, mean number of cows per observation, mean 419
distribution of cows in parity groups and lactation states and mean DD prevalence during the 420
observation period 421
Herd A Herd B Herd C
Number of cows 195 212 353
Milk production
(kg ECM per cow per year) 9007 9477 9511
Mean Standard
deviation Mean
Standard
deviation Mean
Standard deviation
Number of observations per week 147a 12.0 176b 13.7 274c 25.0
Parity
1 49a 2.2 47b 2.5 53c 2.3
2 32a 1.7 26b 1.3 22c 1.3
3+ 19a 1.6 27b 2.2 25c 2.3
Days in Milk (DIM)
0-90 23a 3.9 18b 2.0 19b 2.0
91-180 25a 2.9 15b 1.5 26a 3.0
>180 52a 2.0 68b 1.9 55c 1.6
Prevalence of digital dermatitis
Cow 0.35a 0.48 0.23b 0.42 0.30c 0.46
Left foot 0.231a 0.42 0.13b 0.34 0.20c 0.40
Right foot 0.271a 0.44 0.14b 0.35 0.21c 0.41
Number of feet affected
One 61.7a 14.5 80.5b 9.4 65.5a 7.9
Two 38.3a 14.5 19.5b 9.4 34.5a 7.9
Number of recurring digital dermatitis lesions
Cow 2.9a 1.6 2.4b 1.4 1.8c 0.9
Left foot 1.9a 0.9 1.6b 0.8 1.2c 0.5
Right foot 1.8a 0.9 1.6a 0.8 1.3b 0.5
Means within a row having different superscript letters differ (p<0.05) 422
1: DD prevalence between treated and non-treated feet differ (p<0.05) 423
[image:20.595.58.559.159.681.2]Table 2: Lesion scoring of digital dermatitis lesions according to Manske et al. (2002) and 425
categorisation of groups for the multistate model 426
427
Score Original description
Regrouping for multistate
model outcome
Number of observations
by score (Ntotal = 10585)
0 No lesion State 0 = No lesion 8159
1 Hyperaemic area with erected pili
State 1 = Lesion
1
2
Moist, exudative and hyperaemic
area, with intact epidermis
56
3
Exudative area, exposed corium, with
no signs of healing
759
4
Exposed corium but in process of
healing, dried-up lesion
666
5
Dark brown scab, completely or
almost completely healed lesion
944
Table 3: Number of observations (N = Count; % = Percent of total number of observations) of 431
persistence or transitions between disease states by next observation by lesion score in a study of 432
digital dermatitis in 742 lactating cows in three commercial dairy herds. 433
Lesion score at next observation
Origin state lesion score
0 1 2 3 4 5
N % N % N % N % N N % Total
Le
ft
fo
o
t
0 3701 89.4 1 0.0 13 0.3 83 2.0 80 1.9 263 6.4 4141
1 0 0.0 0 0.0 0 0.0 0 0.0 0 0.0 0 0.0 0
2 12 50.0 0 0.0 0 0.0 5 20.8 2 8.3 5 20.8 24
3 82 21.9 0 0.0 5 1.3 168 44.9 73 19.5 46 12.3 374
4 72 26.0 0 0.0 2 0.7 65 23.5 88 31.8 50 18.1 277
5 242 50.0 0 0.0 10 2.1 30 6.2 45 9.3 157 32.4 484
Total 4109 1 30 351 288 521 5300
Rig
h
t
fo
o
t
0 3535 88.0 0 0.0 23 0.6 79 2.0 125 3.1 256 6.4 4018
1 0 0.0 0 0.0 0 0.0 0 0.0 0 0.0 1 100.0 1
2 13 40.6 0 0.0 1 3.1 5 15.6 7 21.9 6 18.8 32
3 71 18.4 0 0.0 8 2.1 189 49.1 80 20.8 37 9.6 385
4 109 28.0 1 0.3 1 0.3 73 18.8 143 36.8 62 15.9 389
5 231 50.2 0 0.0 4 0.9 16 3.5 76 16.5 133 28.9 460
Total 3959 1 37 362 431 495 5285
[image:22.595.47.564.140.420.2]Table 4: Number of transitions between healthy and diseased states (uncensored episodes) in a 436
study of digital dermatitis in 742 lactating cows in three commercial dairy herds. 437
Transition state
Origin state No lesion Lesion Sum
Left foot
No lesion 3701 440 4141
Lesion 408 751 1159
Sum 4109 1191
Right foot
No lesion 3535 483 4018
Lesion 424 843 1267
Sum 3959 1326
[image:23.595.54.359.127.298.2]
Table 5: Number of types of transitions in the different categories of the explanatory variables from 440
a multilevel, multistate model used in a study of digital dermatitis in 742 lactating cows in three 441
commercial dairy herds 442
Transition type
Occurrence Resolution Sum
Days in milk (DIM) at start of state
0-90 252 221 473
91-180 308 284 592
>180 363 327 690
Parity
1 458 417 875
2 294 256 550
3+ 171 159 330
Duration of state (weeks)
1 366 535 901
2 215 138 353
3-6 255 151 406
7+ 87 8 95
Foot
Left hind 483 424 907
Right hind 440 408 848
Herd
A 403 345 748
B 262 208 470
C 258 279 537
Table 6: Mean and median duration in weeks (stratified by herd) of 832 uncensored and 286 censored episodes in a 444
study of digital dermatitis in 742 lactating cows in three commercial dairy herds. 445
Episode type Herd N obs Mean
duration SD
Median duration
Uncensored A 345 1.6 1.1 1
Resolution observed B 208 1.7 1.4 1
C 279 1.9 1.3 1
Censored A 106 3.0 2.4 2
No resolution
observed B
66
2.8 2.1 2
C 114 4.4 2.8 4
[image:25.595.58.541.127.280.2]Table 7: Results from the multilevel, multistate model used in a study of digital dermatitis in 742 448
lactating cows in three commercial dairy herds: Effects of parity, DIM, uncensored episode 449
duration, foot and herd on the risk of transition from healthy to diseased state (occurrence) and from 450
diseased to healthy state (resolution). 451
DD lesion occurrenceab
DD lesion resolutionab
Parameter Odds ratio 95% credibility
interval Odds ratio
95% credibility interval
Parity
1 1 1
2 1.275 1.063 - 1.530 1.082 0.884 - 1.324
3+ 0.797 0.643 - 0.987 1.246 0.970 - 1.600
Days in milk
0-90 1 1
91-180 1.369 1.096 - 1.709 1.143 0.873 - 1.498
>180 1.269 1.051 - 1.531 1.267 1.003 - 1.602
Duration (weeks)
1 1 1
2 0.783 0.644 - 0.953 0.412 0.326 - 0.522
3-6 0.379 0.317 - 0.454 0.343 0.274 - 0.429
7+ 0.272 0.210 - 0.352 0.090 0.042 - 0.191
Foot
Right 1 1
Left 0.986 0.806 - 1.207 1.178 0.974 - 1.425
Herd
A 1 1
B 0.425 0.316 - 0.573 0.884 0.666 - 1.175
C 0.384 0.302 - 0.490 0.608 0.481 - 0.768
a: Estimated random effects (Standard Error) - Model with duration effects only: 452
Intercept (occurrence) = -1.677 (0.102); Intercept (resolution) = -0.238 (0.070) 453
Random variability between cows: Lesion occurrence = 0.44 (0.11); lesion resolution = 0.065 (0.032) 454
b: Estimated random effects - Final model with covariates: 455
Intercept (occurrence) = -1.074 (0.163), Intercept (resolution) = -0.278 (0.184) 456
Random variability between cows: Lesion occurrence = 0.07 (0.04); lesion resolution = 0.06 (0.05) 457
Figure 1: Percent incident lesions (lesions in feet not affected the previous week) per observation week stratified by 459
herd. (Herd C was only observed for 11 weeks). 460
• • • • • •
0 10 20 30 40
2 3 4 5 6 7 8 9 10 11
Observation number
P
e
r
c
e
n
t
n
e
w
l
e
si
o
n
s
Herd A Herd B Herd C 461
[image:27.595.61.421.123.332.2]References 463
Amory, J.R., Barker, Z.E., Wright, J.L., Mason, S.A., Blowey, R.W., Green, L.E., 2008. 464
Associations between sole ulcer, white line disease and digital dermatitis and the milk yield of 1824 465
dairy cows on 30 dairy cow farms in England and Wales from February 2003-November 2004. 466
Prev. Vet. Med. 83, 381-391. 467
468
Barker, Z.E., Amory, J.R., Wright, J.L., Mason, S.A., Blowey, R.W., Green, L.E., 2009. Risk 469
factors for increased rates of sole ulcers, white line disease, and digital dermatitis in dairy cattle 470
from twenty-seven farms in England and Wales. J. Dairy Sci. 92, 1971-1978. 471
472
Bicalho, R.C., Warnick, L.D., Guard, C.L., 2008. Strategies to Analyze Milk Losses Caused by 473
Diseases with Potential Incidence Throughout the Lactation: A Lameness Example. J. Dairy Sci. 474
91, 2653-2661. 475
476
Bruijnis, M.R.N., Hogeveen, H., Stassen, E.N., 2010. Assessing economic consequences of foot 477
disorders in dairy cattle using a dynamic stochastic simulation model. J. Dairy Sci. 93, 2419-2432. 478
479
Capion, N., Thamsborg, S.M., Enevoldsen, C., 2008. Prevalence of foot lesions in Danish Holstein 480
cows. Vet. Rec. 163, 80-85. 481
482
Cramer, G., Lissemore, K.D., Guard, C.L., Leslie, K.E., Kelton, D.F., 2008. Herd- and Cow-Level 483
Prevalence of Foot Lesions in Ontario Dairy Cattle. J. Dairy Sci. 91, 3888-3895. 484
de Jesus Argaez-Rodriguez, F., Hird, D.W., de Anda, J.H., Read, D.H., Rodriguez-Lainz, A., 1997. 486
Papillomatous digital dermatitis on a commercial dairy farm in Mexicali, Mexico: Incidence and 487
effect on reproduction and milk production. Prev. Vet. Med. 32, 275-286. 488
489
Demirkan, I., Carter, S.D., Murray, R.D., Blowey, R.W., Woodward, M.J., 1998. The frequent 490
detection of a treponeme in bovine digital dermatitis by immunocytochemistry and polymerase 491
chain reaction. Vet. Microbiol. 60, 285-292. 492
493
Dopfer, D., Bennett, T.B., Cook, N.B., 2008. Dynamics of Digital Dermatitis Infection Spread in a 494
Large Freestall Housed Wisconsin Dairy Herd. Proceeding from The 15th International Symposium 495
& the 7th Conference on Lameness in Ruminants, Kuopio, Finland, 9-13 June, 2008. 496
497
Dopfer, D., ter Huurne, A.A.H.M., Cornelisse, J.L., van Asten, A.J.A.M., Koopmans, A., Meijer, 498
F.A., Schukken, Y.H., Szakall, I., Klee, W., Bosma, R.B., 1997. Histological and bacteriological 499
evaluation of digital dermatitis in cattle, with special reference to spirochaetes and Campylobacter 500
faecalis. Vet. Rec. 140, 620-623. 501
502
Dopfer, D., van Boven, M.R., de Jong, M.C.M., 2004. A mathematical model for the dynamics of 503
digital dermatitis in groups of cattle to study the effecacy of group-based therapy and prevention 504
strategies. In: Joshi, N.P., Herdt, T.H. (Eds.), Proceedings of the 12th International Conference for 505
Production Diseases in Farm Animals, p. 138. 506
507
Enting, H., Kooij, D., Dijkhuizen, A.A., Huirne, R.B.M., Noordhuizen-Stassen, E.N., 1997. 508
510
Ettema, J., Østergaard, S.R., Kristensen, A.R., 2010. Modelling the economic impact of three 511
lameness causing diseases using herd and cow level evidence. Prev. Vet. Med. 95, 64-73. 512
513
Ettema, J.F., Capion, N., Hill, A.E., 2007. The association of hoof lesions at claw trimming with 514
test-day milk yield in Danish Holsteins. Prev. Vet. Med. 79, 224-243. 515
516
Green, L.E., Hedges, V.J., Schukken, Y.H., Blowey, R.W., Packington, A.J., 2002. The Impact of 517
Clinical Lameness on the Milk Yield of Dairy Cows. J. Dairy Sci. 85, 2250-2256. 518
519
Holzhauer, M., Dopfer, D., de Boer, J., van Schaik, G., 2008a. Effects of different intervention 520
strategies on the incidence of papillomatous digital dermatitis in dairy cows. Vet. Rec. 162, 41-46. 521
522
Holzhauer, M., Hardenberg, C., Bartels, C.J.M., Frankena, K., 2006. Herd- and Cow-Level 523
Prevalence of Digital Dermatitis in The Netherlands and Associated Risk Factors. J. Dairy Sci. 89, 524
580-588. 525
526
Holzhauer, M., Bartels, C.J.M., Dopfer, D., van Schaik, G., 2008b. Clinical course of digital 527
dermatitis lesions in an endemically infected herd without preventive herd strategies. Vet. J. 177, 528
222-230. 529
530
Kaler, J., Medley, G.F., Grogono-Thomas, R., Wellington, E.M., Calvo-Bado, L.A., Wassink, G.J., 531
King, E.M., Moore, L.J., Russell, C., Green, L.E., 2010. Factors associated with changes of state of 532
534
Klitgaard, K., Boye, M., Capion, N., Jensen, T.K., 2008. Evidence of Multiple Treponema 535
Phylotypes Involved in Bovine Digital Dermatitis as Shown by 16S rRNA Gene Analysis and 536
Fluorescence In Situ Hybridization. J. Clin. Microbiol. 46, 3012-3020. 537
Kristensen, E., Dueholm, L., Vink, D., Andersen, J.E., Jakobsen, E.B., Illum-Nielsen, S., Petersen, 538
F.A., Enevoldsen, C., 2006. Within- and Across-Person Uniformity of Body Condition Scoring in 539
Danish Holstein Cattle. J. Dairy Sci. 89, 3721-3728. 540
541
Manske, T., Hultgren, J., Bergsten, C., 2002. Topical treatment of digital dermatitis associated with 542
severe heel-horn erosion in a Swedish dairy herd. Prev. Vet. Med. 53, 215-231. 543
544
Nielsen, B., Thomsen, P., Sorensen, J., 2009. A study of duration of digital dermatitis lesions after 545
treatment in a Danish dairy herd. Acta Vet. Scand. 51, 27. 546
547
Nowrouzan, I.J. & Radgohar, I., 2011. Restrospective Study of the Correlation Between Hygiene 548
Scores and the Prevalence of Papillomatous Digital Dermatitis in Dairy Cows. Proceeding from The 549
16th International Symposium & the 8th Conference on Lameness in Ruminants, Rotorua, New 550
Zealand, 29 February-3 March, 2011 551
552
Rasbash, J., Steele, F., Browne, W., Prosser, B., 2004. A User's Guide to MLwiN, version 2.10. 553
London: Institute of Education. 554
Rodriguez-Lainz, A., Melendez-Retamal, P., Hird, D.W., Read, D.H., Walker, R.L., 1999. Farm- 556
and host-level risk factors for papillomatous digital dermatitis in Chilean dairy cattle. Prev. Vet. 557
Med 42, 87-97. 558
559
Somers, J.G.C.J., Frankena, K., Noordhuizen-Stassen, E.N., Metz, J.H.M., 2005a. Risk factors for 560
digital dermatitis in dairy cows kept in cubicle houses in The Netherlands. Prev. Vet. Med. 71, 11-561
21. 562
563
Somers, J.G.C.J., Schouten, W.G.P., Frankena, K., Noordhuizen-Stassen, E.N., Metz, J.H.M., 564
2005b. Development of claw traits and claw lesions in dairy cows kept on different floor systems. J. 565
Dairy Sci. 88, 110-120. 566
567
Steele, F., Goldstein, H., Browne, W., 2004. A General Multilevel Multistate Competing Risks 568
Model for Event History Data, with an Application to a Study of Contraceptive Use Dynamics. Stat. 569
Model. 570
571
Steele, F., Kallis, C., Goldstein, H., Joshi, H., 2005. The Relationship between Childbearing and 572
Transitions from Marriage and Cohabitation in Britain. Demography 42, 647-673. 573
574
Tadich, N., Flor, E., Green, L., 2010. Associations between hoof lesions and locomotion score in 575
1098 unsound dairy cows. Vet. J. 184, 60-65. 576
577
Thomsen, P.T., Klaas, I.C., Bach, K., 2008. Scoring of Digital Dermatitis During Milking as an 578
580
Yano, T., Moe, K.K., Yamazaki, K., Ooka, T., Hayashi, T., Misawa, N., 2010. Identification of 581
candidate pathogens of papillomatous digital dermatitis in dairy cattle from quantitative 16S rRNA 582