Time-Resolved Detection and Analysis of Single Nanoparticle
Elec-trocatalytic Impacts
Minkyung Kang,
†David Perry,
†, ‡Yang-Rae Kim,
†Alex W. Colburn,
†Robert A. Lazenby,
†and
Patrick R. Unwin*
††
Department of Chemistry and
‡MOAC Doctoral Training Centre, University of Warwick,
Cov-entry, CV4 7AL, UK
Supporting Information Placeholder
ABSTRACT: There is considerable interest in understanding the interaction and activity of single entities, such as (elec-tro)catalytic nanoparticles (NPs), with (electrode) surfaces. Through the use of a high bandwidth, high signal/noise measurement system, NP impacts on an electrode surface are detected and analyzed in unprecedented detail, revealing considerable new mechanistic information on the process. Taking the electrocatalytic oxidation of H2O2 at ruthenium
oxide (RuOx) NPs as an example, the rise time of
current-time transients for NP impacts is consistent with a hydrody-namic trapping model for the arrival of a NP with a distance-dependent NP diffusion-coefficient. NP release from the elec-trode appears to be aided by propulsion from the electrocata-lytic reaction at the NP. High frequency NP impacts, orders of magnitude larger than can be accounted for by a single pass diffusive flux of NPs, are observed that indicate the re-petitive trapping and release of an individual NP that has not previously recognized. The experiments and models de-scribed could readily be applied to other systems and serve as a powerful platform for detailed analysis of NP impacts.
An important frontier in electrochemistry is measuring the behavior of individual nano-entities such as nanoparticles (NPs), nanowires and nanorods and relating this to other properties such as size, structure and electronic characteris-tics, so as to develop fundamental understanding and ration-al applications.1-3 An interesting approach for observing the
electrochemical properties of catalytic NPs is to monitor their impact (or landing) from solution onto a collector elec-trode, as introduced by Bard et al.,4,5 and developed by
sever-al groups.6-12 In order to resolve such impacts, the use of a
small-sized ultramicroelectrode (UME) is mandatory to re-duce both background currents and the impact frequency. To enhance the impact signal to background current, elec-trode surfaces have been modified with Hg or Bi7 and
boron-doped diamond12 has also been used as an UME material.
Alternatively, scanning electrochemical cell microscopy (SECCM) functioning as an ultramicro-electrochemical cell system offers particularly low background currents by reduc-ing the area of the collector electrode, as well as offerreduc-ing the
widest range of support electrodes. This is because the elec-trochemical cell is formed by meniscus confinement, rather than electrode encapsulation (Figure 1).13 Despite these
Figure 1. RuOx NP landing experiments in an
ultramicro-electrochemical cell, showing the cell set up (top), with a typical theta pipette for meniscus contact and NP delivery to a working electrode (HOPG) substrate. There is no oxidation of H2O2 at the HOPG electrode surface, i.e. no surface
cur-rent (isurf), as shown on the bottom left, unless a NP impacts
with the surface and sets off the electrocatalytic oxidation of H2O2 at the NP (bottom right).
In this paper we use SECCM13 to investigate H2O2
oxida-tion at ruthenium oxide (RuOx)NPs, determining the NP
landing characteristics and the distribution of kinetics cur-rents for individual impacts within an ensemble of colliding NPs, with unprecedented time resolution. The heterogene-ous kinetics of H2O2 electro-oxidation has been studied
ex-tensively at a variety of nanomaterials,13 among which several
metal oxides appear to be promising, particularly for bioana-lytical applications, due to the biocompatibility and robust electrocatalytic performance.14-17 RuO
x is especially
interest-ing as it catalyzes H2O2 electro-oxidation at relatively low
overpotentials in physiological environments.15,16 The
exper-iments reported herein allow us to measure the residence time and interaction of RuOx NPs with an electrode during
electroctalysis.
The ultramicro-electrochemical cell was made by meniscus contact of a highly oriented pyrolytic graphite (HOPG) col-lector electrode from a tapered dual-barrelled borosilicate theta pipette (end diameter 3 μm), filled with a solution of RuOx NPs and 0.5 mM H2O2 in 0.1 M phosphate buffer (pH
7.4) and containing a Ag/AgCl quasi-reference counter elec-trode (QRCE) in each channel (Figure 1).13 The pipette was
approached towards the HOPG with a z-piezoelectric posi-tioner while monitoring the ion-conductance current be-tween the barrels (iion) with a potential bias of 0.1 V between
the two Ag/AgCl QRCEs (V1). Once the meniscus was in
con-tact with the HOPG, sensed as an abrupt change in iion,13V1
was set to 0 V and current-time (i-t) traces were recorded from the HOPG substrate (isurf). Further details of the
in-struments and materials used can be found in the Supporting Information (S1.1). HOPG was selected as the collector elec-trode as it exhibits exceptionally low background cur-rents,18,19 and is relatively insensitive to H2O2 oxidation over
the potential range where RuOx is an effective electrocatalyst
(Supporting Information, Figure S1). Moreover, many types of NPs exhibit weak interaction with HOPG,20,21 and this
en-abled us to monitor H2O2 oxidation on the RuOx NPs with
[image:2.612.317.559.277.421.2]glancing collisions rather than sticking landings where the NP would remain, and accumulate on the support electrode.
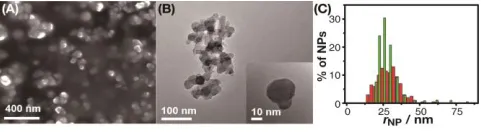
Figure 2. (A) FE-SEM and (B) TEM images of RuOx NPs
syn-thesized with sodium citrate. (C) Size distribution from the analysis of TEM images (red) and from DLS (green), in terms of the particle radius, rNP.
RuOx NPs were synthesized with sodium citrate
(Support-ing Information, S1.3) and characterized by field
emission-scanning electron microscopy (FE-SEM) and transmission electron microscopy (TEM), Figures 2A and 2B. Sodium cit-rate was used as a capping agent as it promoted the for-mation of well-dispersed RuOx NPs with a reasonably regular
size and shape (Figure 2), but would not lead to much inhibi-tion of electron-transfer in collision experiments unlike some alternative organic capping agents.22 The apparent NP radius, rNP, was estimated from the analysis of TEM images of NPs,
with a mean value of 28 ± 8 nm (N = 200), and from dynamic light scattering (DLS) for the same solution conditions as for the electrochemical measurements (26 ± 5 nm), with the results of both analysis shown in Figure 2C. Details of DLS are given in Supporting Information (S1.3). The capping step also enhanced the colloidal stability of RuOx NPs in aqueous
solution, as a result of a larger absolute -potential value than without capping agent (Supporting Information, Table S1).23 RuOx NPs synthesized without sodium citrate, in
con-trast, showed uneven structures with a broad distribution of both apparent size (Supporting Information, Figure S2) and the current signal in landing experiments, due to a predomi-nance of agglomerates (Supporting Information, Figure S3).
Figure 3. (A) Current (isurf) responses for 0.5 mM H2O2
oxi-dation with 15 pM RuOx NPs in 0.1 M phosphate buffer
solu-tion (pH 7.4) at different Eapp at the HOPG collector
elec-trode (0.15 V, 0.25 V, 0.35 V, 0.45 V, 0.55 V, 0.65 V and 0.75 V vs. Ag/AgCl QRCE). (B) Example current responses of indi-vidual impacts of RuOx NPs at the different Eapp with the
color matched with (A); the bigger the current magnitude the higher the Eapp. (C) Distribution of peak currents, ipeak,
from collision experiments at 0.55 V.
RuOx NP impacts with the collector electrode were
ob-served only in the presence of 0.5 mM H2O2 in 0.1 M
phos-phate buffer solution (pH 7.4) due to H2O2 oxidation on
Ru-Ox NPs when they made the contact with the HOPG support
(Figure 3). These data are representative of more than 8 ex-perimental runs carried out on this system. Control meas-urements, with and without H2O2 present (at a collector
elec-trode potential of 0.55V), are given in Supporting Infor-mation, Figure S4. Results at different applied potentials (Eapp) (0.15, 0.25, 0.35, 0.45, 0.55, 0.65 and 0.75 V) showed
that in the presence of H2O2 distinct features in the i-t trace
started to appear at 0.25 V (Figure 3A). The individual i-t
response shape (Figure 3B) was characterized by a fast rise to a peak (ipeak) and a slower decay back to the baseline, within 3
ms, during the single NP impacts on the collector electrode.
ipeak tended to increase with more positive Eapp. At 0.25 V,
[image:2.612.55.296.578.644.2]be seen (corresponding to the 2-electron oxidation of just 35 (± 14) × 103 molecules of H2O2).
A potential of 0.55 V was chosen as an optimized value for further studies to obtain a sufficiently large current response for H2O2 electro-oxidation to be made with good signal to
noise and bandwidth (Figure 3A), while minimizing side re-actions such as water splitting that can occur on RuOx NPs at
excessively positive potential (Support Information, Figure S5).24 The mean value of ipeak at 0.55 V (Figure 3C) was 46 ± 16
pA corresponding reasonably well to that expected for the diffusion-controlled steady-state current (iss) predicted for a
NP on a surface, based on the NP size distribution (Figure 2C):25,26
HO HO NP ss=4πln2nFD 2 2C 2 r i2 (1)
where n is the number of electrons transferred per H2O2
(2), F is the Faraday constant (96485 C mol-1), DH2O2 is the
diffusion coefficient of H2O2 in 0.1 M phosphate buffer
solu-tion (1.46×10⁻⁵ cm2 s-1),27CH2O2 is the concentration of H2O2
(0.5 mM). This simple analysis yields iss = 38 ± 10 pA.
The high rates of mass transport to NPs of this size means that the characteristic steady-state diffusion time, 0.5 s (≈
rNP2/DH2O2), is rapid and much faster than the response time
of the electrochemical measurement system. The electro-chemical current at any time (taking account of the instru-ment response function for the current measureinstru-ment; Sup-porting Information S2) is thus determined by the occupancy of the NP with the electrode surface. Since ipeak is close to
that expected for a diffusion-limited process (see above), ipeak
represents an occupancy of one of the NP with the surface, and i(t)/ipeak is thus the relative occupancy at time, t.
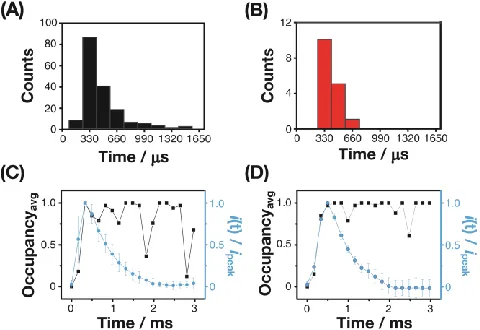
Figure 4. Histograms of the rise time from (A) 200 simula-tions and (B) 16 experimental transients. Experimental i-t
traces (blue lines) are presented in (C) and (D). These are the average (one standard deviation) of: (C) 10 individual transi-ents that had a rise time of 330 s and (D) 5 individual traces that had a rise time of 500 s. Shown alongside are simulated occupancy traces (black lines), which displayed similar rise time for comparison.
The excellent signal to noise and high bandwidth in our experiment allowed us to examine individual transients in unprecedented detail and compare the results to three-dimensional (3D) random walk simulations of NP landing, details of which are presented in Supporting Information, S2. Although the model has been developed for a spherical NP,
to which most systems will approximate, it would be possible to consider non-spherical NPs (variable direction-dependent diffusion coefficient). Furthermore, we have shown that NP aggregation is relatively unimportant in this system, but if such effects occurred, they could be incorporated into the model, e.g. through a time-dependent particle size and popu-lation, representing the aggregation and de-aggregation ki-netics. In brief, for the simulations, we considered an electro-lyte zone above the collector electrode of a similar size to the SECCM meniscus. Electron transfer between the electrode and NP was reasonably assumed to occur when the NP was within 1 nm of the electrode.28 We performed 200
simula-tions each of 3 ms duration with the NP having the same initial position at the start (5 nm above the electrode, over the center). As the NP moved from the start position and began to encounter the electrode, the simulations showed a distribution of rise times, defined as the time taken for the occupancy to change from an average of 0.1 to 0.9, centered around 465 s, as summarized in Figure 4A. This distribution is seen to be consistent with the current-time transients ob-served experimentally (Figure 4B). A key factor determining the rise time is a distance-dependent diffusion coefficient, expected for a spherical particle near a wall in solution, which slows the NP speed of motion, the closer the NP moves to the electrode, leading to hydrodynamic trapping (see Supporting Information, section S2).
In fact, the model simulations predict the NP to remain, on average, near the electrode surface due to the hindered diffusion of the NP, resulting in a occupancy close to 1 for an extended period.29 However, in the experiments, after
reach-ing a peak, the current shows a decay with time over a few ms. This difference in behavior between the experiment and model simulation can be seen in Figures 4C and D which each show the occupancy extracted from single example simulation runs plotted with current-time profiles obtained experimentally, as the average of 10 transients (C) and 5 tran-sients (D). The experimental trantran-sients and example simula-tionplots were grouped by the rise time, with the rise time centered about 330 s (C) and 500 s (D). The difference between experiment (colored traces) and the model (black traces) indicates that the hydrodynamic trapping is ultimate-ly overcome, and this can reasonabultimate-ly be attributed to the propulsion of the NP due to the release of oxygen as part of H2O2 electro-oxidation, as seen at larger “swimmer particles”
in solution.30 In essence, spatially and temporally
non-uniform oxygen generation on the asymmetrical NP (Figure 2B) after trapping on the collector electrode could accelerate the movement of the NP31 and overcome the hindered
diffu-sion of the NP near the surface, reducing the average occu-pancy (current) and ultimately leading to the particle moving completely outside the electron transfer region. Further evi-dence for this mechanism comes from the analysis of re-sponses at 0.75V where water oxidation was also initiated, causing higher currents and propulsion effects (Supporting Information, Figure S5). The decay time, defined as the time period from ipeak to the time when the current was 10 % of ipeak following the peak was 1.95 (± 0.15) ms (N = 38)
com-pared to 3.08 (± 0.58) ms at 0.55 V (N = 29), indicating that NPs tend to depart from the electrode quicker at higher bias. Other possible (alternative) reasons for the current-time decay that need to be considered include some deactivation process9,17 although this is unlikely, first, because such
[image:3.612.54.294.397.562.2]ad-sorbed on other electrode surfaces15 and, second, due to the
subsequent electrochemical events observed that involve the same NP (vide infra). Moreover, the low concentration of H2O2 used is insufficient for the NP surface to become
super-saturated with O2 and for all of the sites on the NP to be
[image:4.612.77.272.112.240.2]de-activated.32
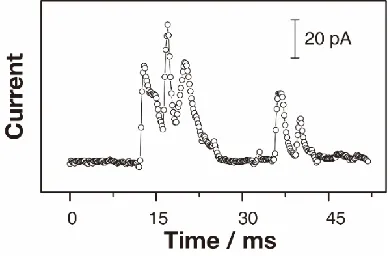
Figure 5. Typical multiple RuOx NP impact events at a
collec-tor electrode potential of 0.55 V.
As well as explaining the time scale of the observed current transients, the mechanism of hydrodynamic trapping and release also accounts for the high frequency of NP impacts (fNP) observed. Hitherto, a model based on a
diffusion-limited flux of NPs at an UME is often used to analyze fNP,
given by:4,5
disc A NP NP NP 4D C N r
f (2)
where DNP is the diffusion coefficient of NPs (8.8 × 10⁻⁸ cm2
s-1), CNP is the concentration of NPs (15 pM), NA is the
Avoga-dro constant (6.022 × 10²³ mol-1), and rdisc is the radius of the
electrode (1.5 m herein). For SECCM the diffusional flux is about 10% of that for the same sized disc electrode33 and for
the experimental conditions herein, this yields a value of 0.05 s-1. This corresponds to a single pass collision with the
collec-tor electrode every 20 s or so on average. The fNP we measure
is 86 s-1, about 1700-times greater than the fNP value expected
based purely on single-pass diffusion. The reason for the much larger fNP value is that once the NP has moved away
from the electrode and the electrochemical reactions switch-es off as a consequence, the NP will tend to come back to the electrode surface (hydrodynamic trapping), resulting in an-other current transient such as in the case shown in Figure 5, where multiple, rapid events are observed. The rapidity of such discrete events, would be very difficult to discern with previously employed set ups. Indeed, some previous studies have acknowledged that the accuracy of the fNP measurement
was low due to instrumental limitations necessitating a slow data acquisition rate.34 Other studies have reported that the
value of fNP was reasonably similar to that expected for a
dif-fusional flux of NPs.9 However, even without
electrochemi-cally-driven propulsion, it is important to point out that the random walk simulations with hydrodynamic trapping evi-dence a stochastic interaction of the NP with the collector electrode (simulation traces in Figure 4C and 4D; and Sup-porting Information, Figure S6). Consequently, multiple cur-rent events in quick succession are expected for NPs that do not remain affixed (and accumulate) on the electrode sur-face.
In conclusion, experiments in the SECCM system have provided profound new insights into the interaction of a NP
with an electrode surface during impact, using H2O2
oxida-tion at RuOx NPs as an illustrative case. The rise time of
cur-rent-time transients is consistent with random walk simula-tions for the diffusion of a NP, but with a bias due to hydro-dynamic trapping near the electrode due to a greatly reduced diffusion-coefficient. Multiple, rapid current-time curves with very high frequency indicate successive trapping and release of a single NP, with release proposed to be aided by electrochemical propulsion which switches on when a NP hits the electrode, but off again upon NP departure. For the electrochemical fluxes herein, the propulsion is insufficient to completely release the NP at the first attempt and, on av-erage, our measurements show that about 1700 attempts are needed for complete release and loss of the NP from the elec-trode.
ASSOCIATED CONTENT
Supporting Information
Full experimental details, 3D random walk simulations, and supporting RuOx NPs landing experiment data. This material
is available free of charge via the Internet at http://pubs.acs.org.
AUTHOR INFORMATION
Corresponding Author
Notes
The authors declare no competing financial interests.
ACKNOWLEDGMENTS
We thank the European Research Council (ERC-2009-AdG 247143-QUANTIF) for support. This work was also supported by a University of Warwick Chancellor’s International Schol-arship to M. Kang, a Basic Science Research Program through the National Research Foundation of Korea (2012R1A6A3A03039226) for Y.-R. Kim and EPSRC for a PhD studentship through the MOAC Doctoral Training Centre (EP/F500378/1) for D. Perry.
REFERENCES
(1) Cox, J. T.; Zhang, B. Annu. Rev. Anal. Chem.2012, 5, 253. (2) Sambur, J. B.; Chen, P. Annu. Rev. Phys. Chem.2014, 65, 395. (3) Zhang, B.; Fan, L.; Zhong, H.; Lui, Y.; Chen, S. J. Am. Chem. Soc.
2013, 135, 10073.
(4) Xiao, X.; Bard, A. J. J. Am. Chem. Soc.2007, 129, 9610.
(5) Kwon, S. J.; Zhou, H.; Fan, F-R. F.; Vorobyev, V.; Zhang, B.; Bard, A. J. Phys. Chem. Chem. Phys.2011, 13, 5394.
(6) Fosdick, S. E.; Anderson, M. J.; Nettleton, E. G.; Crooks, R. M. J.
Am. Chem. Soc.2013, 135, 5994.
(7) Fasari, R.; Robinson, D. A.; Stevenson, K. J. J. Am. Chem. Soc.
2013, 135, 570.
(8) Kim, B.-K.; Kim, J.; Bard, A. J. J. Am. Chem. Soc.2015, 137, 2343. (9) Jung, A. R.; Lee, S.; Joo, J. W.; Shin, C.; Bae, H.; Moon, S. G.;
Kwon, S. J. J. Am. Chem. Soc.2015, 137, 1762.
(10) Guo, Z.; Percival, S. J.; Zhang, B. J. Am. Chem. Soc.2014, 136, 8879.
(11) Stuart, E. J. E.; Tschulik, K.; Batchelor-McAuley, C.; Compton, R. G. ACS Nano2014, 8, 7648.
(13) Klejin, S. E. F.; Lai, S. C. S.; Miller, T. S.; Yanson, A. I.; Koper, M. T. M.; Unwin, P. R. J. Am. Chem. Soc.2012, 134, 18558.
(14) Chen, W.; Cai, S.; Ren, Q.; Wen, W.; Zhao, Y. Analyst2012, 137, 49.
(15) Kang, M.; Lee, Y.; Jung, H.; Shim, J. H.; Lee, N.; Baik, J. M.; Lee, S. C.; Lee, C.; Lee, Y.; Kim, M. H. Anal. Chem.2012, 84, 9485.
(16) Kim, S-J.; Jung, H.; Lee, C.; Kim, M. H.; Lee, Y. Sesor. Actuat. B-Chem.2014, 191, 298.
(17) Sardesai, N. P.; Andreescu, D.; Andreescu, S. J. Am. Chem. Soc.
2013, 135, 16770.
(18) Patel, A. N.; Collignon, M. G.; O’Connell, M. A.; Hung, W. O. Y.; McKelvey, K.; Macpherson, J. V.; Unwin, P. R. J. Am. Chem. Soc.2012, 134, 20117.
(19) Patel, A. N.; Tan, S.; Miller, T. S.; Macpherson J. V.; Unwin, P. R. Anal. Chem., 2013, 85, 11755.
(20) S. C. S. Lai, R. A. Lazenby, P. M. Kirkman, P. R. Unwin, Chem. Sci.2015, 6, 1126.
(21) Yang, D.-Q.; Sacher, E. Chem. Mater.2006, 18, 1811.
(22) Kleijn, S. E. F.; Lai, S. C. S.; Koper, M. T. M.; Unwin, P. R. Angew. Chem. Int. Ed.2014, 53, 2.
(23) Jiang, J.; Oberdörster, G.; Biswas, P. J. Nanopart. Res.2009, 11, 77.
(24) Lee, Y.; Suntivich, J.; May, K. J.; Perry, E. E.; Shao-Horn, Y. J. Phys. Chem. Lett.2012, 3, 399.
(25) Bard, A. J.; Faulkner, L. R. Electrochemical Methods:
Fundamen-tals and Applications, 2nd ed.; John Wiley & Sons: New York, 2001.
(26) Bobbert, P. A.; Wind, M.; Vlieger, M. J. Phys. A1987, 141, 58. (27) Evans, S. A. G.; Elliott, J. M.; Andrews, L. M.; Bartlett, P. N.;
Doyle, P. J.; Denuault, G. Anal. Chem. 2002, 74, 1322.
(28) Zhao, J.; Bradbury, C. R.; Huclova, S.; Potapova, I.; Carrara, M.; Fermin, D. J. J Phys Chem. B2005, 109, 22985.
(29) Bevan, M. A.; Prieve, D. C. J. Chem. Phys.2000, 113, 1228. (30) Wang, Y.; Hernandez, R. M.; Bartlett, Jr., D. J.; Bingham, J. M.;
Kline, T. R.; Sen, A.; Mallouk T. E. Langmuir, 2006, 22, 10451. (31) Howse, H. R.; Jones, R. A. L.; Ryan, A. J.; Gough, T.; Vafabakhsh,
R.; Golestanian, R., Phys. Rev. Lett.2007, 99, 048102. (32) Luo, L.; White, H. S. Langmuir, 2013, 29, 11169.
(33) Snowden, M. E.; Güell, A. G.; Lai, S. C. S.; McKelvey, K.; Ebejer, N.; O’Connell, M. A.; Colburn, A. W.; Unwin, P. R. Anal. Chem.2012, 84, 2483
6
SYNOPSIS TOC