NON LINEAR STATIC ANALYSIS OF FRAME WITH AND WITHOUT
INFILLS
B Suresh
1, P Hima Bindu
21
M. Tech, Structural Engineering, Sri Sunflower College of Engineering and Technology, Lankapalli, Andhra
Pradesh
2
Assistant Professor, Sri Sunflower College of Engineering and Technology, Lankapalli, Andhra Pradesh
---***---
Abstract:- The general multi-storey construction in country which is constructed with reinforced concrete frames consists
brick masonry Infill walls. Unreinforced masonry infill walls will not take part towards resisting gravity loads, but will have effect significantly, in terms of increased stiffness and strength for the loads like earthquake are acting on the structure. However, in real time analysis and design, the infill stiffness is generally neglected in structural analysis, resulting in an under-estimation of stiffness and natural frequency of the structure. To study the effect of the structure with the presence of Infill walls when lateral loads are acted on the structure here in this project, a typical building assumed in seismic zone-2 of India as per IS: 1893-2002. Features like plan irregularity and vertical irregularity (soft storey) are introduced in the building. Infill walls were modeled using the equivalent strut approach presented in FEMA 356. Static analysis (for gravity and lateral loads), Response spectrum analysis and non-linear pushover analysis (assigning the hinge properties to beams and column sections) were performed. In the present study, the non-linear response of Reinforced cement concrete structure by using SAP2000 software under the seismic loading has been carried out with the intention to investigate the relative importance of Infill walls when present in structure during the earthquake then the response factor depends on several factors in the non-linear analysis of RCC frames. This includes the altering in load displacement graph.
Keywords: SAP2000, FEMA 356, RCC FRAMES
I. INTRODUCTION
Earthquake is the main cause for the ground motion in random fashion in both horizontally and also in vertically, which starts its origin at the epicentre. Generally structures present on the ground they start vibrating when they are subjected to earthquake by inducing inertial forces on them. There are some high seismic areas where structures located at that will face severe damages. In addition to the gravity load these structures should also capable of resisting lateral loads which develops a high stresses in the members.
In the present scenario of reinforced concrete constructions the vertical space between the beams and columns is generally filled by brick Infill walls or panels, these are constructed only when the complete structure is constructed by using the material called as Bricks with cement mortar to have adequate bond between bricks and also to withstand. Generally the width or thickness of these will be in the range of 115mm to 230mm and they also have some openings for the purpose of general requirements.
The main reason to use the Infill wall in the structures because the material is locally available in bulk and also it can be handled easily, also it has good heat insulating properties which makes it greater comfort for the occupants of the building.
II. INFILLWALLSANDPUSHOVERANALYSIS
A. MASONARY INFILLS:
The frames are infilled with stiff construction such as brick or concrete block masonry, primarily to close the structure or to cover the structure and not to expose out and also to provide safety for the users. Such masonry walls known as Infill walls.
B. STIFFNESS OF INFILL WALLS (FEMA 356):
© 2019, IRJET | Impact Factor value: 7.34 | ISO 9001:2008 Certified Journal
| Page 1251
Figure 1: Concentric Struts Figure 2: Eccentric Struts
[image:2.595.309.528.249.375.2]C. PUSHOVER ANALYSIS:
Figure 3: Performance levels and damage functions
Pushover Analysis option will allow engineers to perform pushover analysis as per FEMA -356 and ATC-40. Pushover analysis is a static, nonlinear procedure using simplified nonlinear technique to estimate seismic structural deformations. It is an incremental static analysis used to determine the force-displacement relationship, or the capacity curve, for a structure or structural element. The analysis involves applying horizontal loads, in a prescribed pattern, to the structure incrementally, i.e. pushing the structure and plotting the total applied shear force and associated lateral displacement at each increment, until the structure or collapse condition.
Pushover analysis is a method by which a computer model of the building is subjected to a lateral load of a certain shape (i.e., inverted triangular or uniform). The intensity of the lateral load is slowly enhanced and the stages of cracking, yielding, plastic hinge formation, and failure of different structural members are noted. Pushover analysis will provide important in depth knowledge of the weak zones in seismic performance of a structure.
D. PLASTIC HINGE ZONES:
In lateral load analysis system of the structure, dissipate energy under server imposed deformations through critical regions of the members, often termed as “plastic hinges”.
Types of Plastic Hinges:
Negative Plastic Hinges. Positive Plastic Hinges.
III. MODELLINGANDANALYSIS
The major objectives of this work was to test a RCC G+4 frames which has vertical irregularity with Infill wall considered in one model and without infill wall under pushover loads. Thus the structure tested in this work is a prototype. The model was deliberately selected so that it had certain eccentricities and was un-symmetric in plan
Figure 4: Vertical Geometric Irregularity
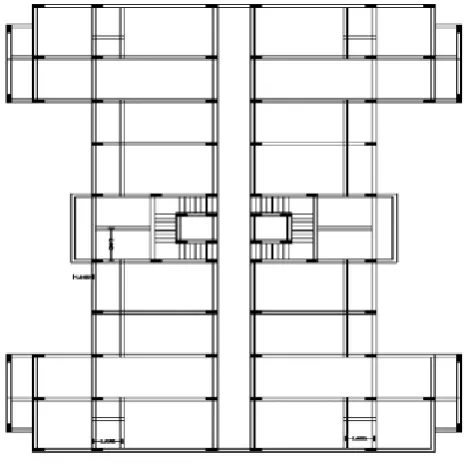
PLAN OF BUILDING:
[image:2.595.307.540.444.677.2]Figure 6: Framing Plans of all the floors
Building Type RC frame with masonry
brick infill
Number of stories Ground + 4 Storey Plan dimensions 37 m X 27 m
[image:3.595.69.279.97.334.2]Building height 12 m above plinth level
Table 1: Summary of Building
ANALYSIS IN SAP2000:
[image:3.595.302.566.395.647.2]Figure 7:The material specifications for concrete grade M25
Figure 8: The Reinforcement grade specifications for HYSD 500
[image:3.595.38.292.474.716.2]© 2019, IRJET | Impact Factor value: 7.34 | ISO 9001:2008 Certified Journal
| Page 1253
[image:4.595.301.561.86.291.2]Figure 10: The Floor beams section details in the structure
Figure 11: Column section details for all the columns in the structure
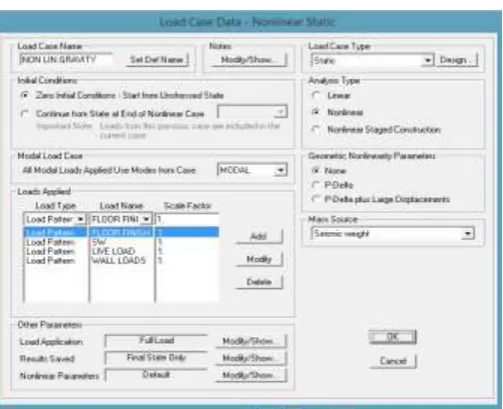
Figure 12: Non Linear Static load case for Gravity loads
Figure 13: Response spectrum Function definition as per IS 1893-2002
IV. RESULTSANDDISCUSSIONS
The results of Analysis of RCC frame. Analysis of RCC frame under the static loads has been performed using SAP2000 software. This is followed by load deflection curve.
Figure 14: Base shear Vs Roof Displacement for the structure with Infill wall for Push-x direction
TABLE: Pushover Curve - PUSH X
Step Displacement BaseForce AtoB BtoIO IOtoLS LStoCP CPtoC CtoD DtoE BeyondE Total
m
KN
0
0.001542
0 1965
0
0
0
0
0
0
0 1965
1
0.022537 3767.751 1964
1
0
0
0
0
0
0 1965
2
0.030943 5010.481 1897
68
0
0
0
0
0
0 1965
3
0.074935 7224.974 1781
86
98
0
0
0
0
0 1965
4
0.123602 8385.475 1713
55
176
20
0
1
0
0 1965
[image:4.595.35.292.331.516.2]5
0.123533 8381.266 1713
55
176
21
0
0
0
0 1965
Table 2: Base Shear Vs Roof Displacement with Infill
[image:4.595.314.557.415.562.2] [image:4.595.39.291.551.755.2]TABLE: Pushover Curve - PUSH X
Step Displacement BaseForce AtoB BtoIO IOtoLS LStoCP CPtoC CtoD
DtoE BeyondE Total
m
KN
0
0.00064
0
1802
0
0
0
0
0
0
0
1802
1
0.028874 3287.971
1801
1
0
0
0
0
0
0
1802
2
0.045038 4965.766
1728
74
0
0
0
0
0
0
1802
3
0.095553 7118.864
1548
155
99
0
0
0
0
0
1802
4
0.166743 8445.675
1393
183
177
38
2
9
0
0
1802
5
0.184867 8634.539
1369
195
171
30
2
35
0
0
1802
6
0.185301 8637.444
1369
195
169
32
2
35
0
0
1802
Table 3: Base Shear Vs Roof Displacement without
[image:5.595.43.290.507.708.2]Infill walls
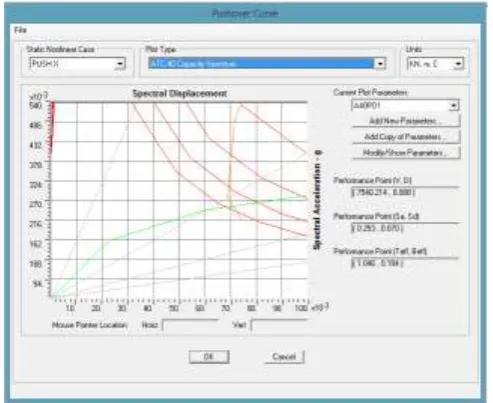
[image:5.595.311.558.552.770.2]Figure 15: Capacity curve & Demand curve also Performance point
Figure 16: Capacity Spectrum & Demand Spectrum with Infill wall
COMPARISION RESULTS:
Graph 1: Mode shape Vs Natural Time period
Graph 2: Base shear Vs Roof displacement curve for Building in X direction
Graph 3: Base shear Vs Roof displacement curve for Building in Y direction
0 0.2 0.4 0.6 0.8 1 1.2 1.4 1.6
1 2 3 4 5 6 7 8 9 10 11 12
Mode shape vs Natural Time period
Time Period with strut Sec
Time period without Strut Sec 0 1000 2000 3000 4000 5000 6000 7000 8000 9000 10000
0 100 200
B A SE S H EA R K N DISPLACEMENTS mm DISPLACEME NT WITH STRUT DISPLACEME NT WITHOUT STRUT 0 500 1000 1500 2000 2500 3000 3500 4000 4500 5000
0 100 200 300
© 2019, IRJET | Impact Factor value: 7.34 | ISO 9001:2008 Certified Journal
| Page 1255
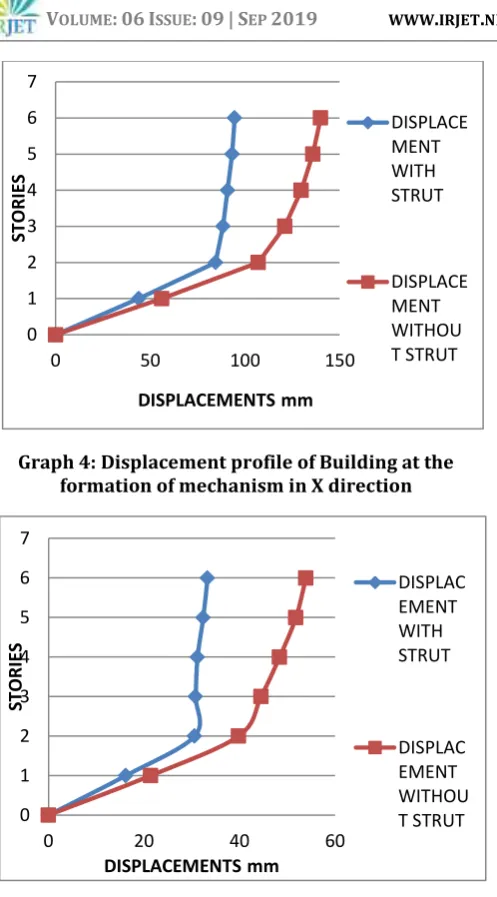
Graph 4: Displacement profile of Building at the formation of mechanism in X direction
Graph 5: Displacement profile of Building at the formation of mechanism in Y direction
[image:6.595.45.294.59.508.2]Figure 17: Load Resisting Mechanism for a typical frame of Building with Infill panels
Figure 18: Load Resisting Mechanism for a typical frame of Building for Bare Frame
V. CONCLUSIONS
The influence of masonry infill on the response of multi-storied building under seismic loading is shown through typical examples.
The presence of masonry infill panels modifies the structural force distribution significantly.
The total storey shear force increases considerably as the stiffness of the building increases in the presence of masonry infill.
Also, the bending moments in the ground floor columns increase, and the mode of failure is by soft storey mechanism (formation of hinges in ground floor columns).
The lateral load resisting mechanism of the masonry in filled frame is mainly different from the bare frame. The bare frame acts primarily as a moment resisting frame with the formation of plastic hinges at the joints under lateral loads. In contrast, the infill frame behaves like a braced frame resisted by a truss mechanism formed by the compression in the masonry infill panel and tension in the column. The plastic hinges are confined with the joint in contact with the infill panel. It is seen that the existing buildings with open ground storey are deficient and in need have retrofit.
SCOPE OF THE PROJECT:
In the present study, the 4 storey frame has been studied under monotonic loads. This may be further studied for more storeys and the frame can be studied under cyclic-loading to monitor the variation in load-deflection curves at given time history
VI. REFERENCES
IS 1893: Part 1 (2002); “Criteria for earthquake resistant design of structures”, Bureau of Indian Standards, New Delhi.
ATC 40, Volume 1 (1996) “Seismic evaluation and retrofit of concrete buildings”, Applied Technology Council, Seismic Safety Commission, State of California.
Effect of Infill stiffness on Seismic Performance of Multi-Storey RC Framed Structures 13th World
0 1 2 3 4 5 6 7
0 50 100 150
STORIE S DISPLACEMENTS mm DISPLACE MENT WITH STRUT DISPLACE MENT WITHOU T STRUT 0 1 2 3 4 5 6 7
0 20 40 60
Conference on Earthquake Engineering by Prof.Devdas Menon, Robin Davis, Meher Prasad. IS 456:2000; “Plane and Reinforced Concrete-Code of
Practice”, Bureau of Indian Standards, New Delhi. FEMA 356, “Federal Agency Management Agency”,
Pre standard and commentary for the Seismic rehabilitation of Buildings.
NPTEL Chapter “Non Linear seismic response of structures”.
Design of Reinforced Concrete Structures by Unnikrishna Pillai and Devdas Menon
Ashraf Habibullah, S.E., and Stephen Pyle, S.E,” Practical Three Dimensional Nonlinear Static Pushover Analysis”, Structure Magazine 1988. Pankaj Agarwal & Manish Shrikhande, “Earthquake