ISSN Online: 2159-4481 ISSN Print: 2159-4465
Methodical Analysis of Western-Caucasian and
East-Asian Basic Facial Expressions of Emotions
Based on Specific Facial Regions
Gibran Benitez-Garcia, Tomoaki Nakamura, Masahide Kaneko
Department of Mechanical Engineering and Intelligent Systems, The University of Electro-Communications, Tokyo, Japan
Abstract
Facial expressions are the straight link for showing human emotions. Psy-chologists have established the universality of six prototypic basic facial ex-pressions of emotions which they believe are consistent among cultures and races. However, some recent cross-cultural studies have questioned and to some degree refuted this cultural universality. Therefore, in order to contri-bute to the theory of cultural specificity of basic expressions, from a composite viewpoint of psychology and HCI (Human Computer Interaction), this paper presents a methodical analysis of Western-Caucasian and East-Asian proto-typic expressions focused on four facial regions: forehead, eyes-eyebrows, mouth and nose. Our analysis is based on facial expression recognition and visual analysis of facial expression images of two datasets composed by four standard databases CK+, JAFFE, TFEID and JACFEE. A hybrid feature ex-traction method based on Fourier coefficients is proposed for the recognition analysis. In addition, we present a cross-cultural human study applied to 40 subjects as a baseline, as well as one comparison of facial expression recogni-tion performance between the previous cross-cultural tests from the literature. With this work, it is possible to clarify the prior considerations for working with multicultural facial expression recognition and contribute to identifying the specific facial expression differences between Western-Caucasian and East-Asian basic expressions of emotions.
Keywords
Facial Expression Recognition, Cultural Specificity of Facial Expressions, Universality of Emotions, Cross-Cultural Analysis, Discrete Fourier Transform
1. Introduction
Facial expressions are a set of facial muscle movements which can directly ex-How to cite this paper: Benitez-Garcia, G.,
Nakamura, T. and Kaneko, M. (2017) Me-thodical Analysis of Western-Caucasian and East-Asian Basic Facial Expressions of Emo-tions Based on Specific Facial Regions. Jour-nal of SigJour-nal and Information Processing, 8, 78-98.
https://doi.org/10.4236/jsip.2017.82006
Received: March 30, 2017 Accepted: May 15, 2017 Published: May 18, 2017
Copyright © 2017 by authors and Scientific Research Publishing Inc. This work is licensed under the Creative Commons Attribution International License (CC BY 4.0).
http://creativecommons.org/licenses/by/4.0/
press human emotions. Since the early work of Charles Darwin [1], facial ex-pressions have been considered as a universal language, which can be recognized across different races and cultures around the world. Paul Ekman et al. [2] estab-lished the universality of basic facial expressions of emotions which are consis-tent among cultures. Thus, the prototypic expressions of anger, disgust, fear, happiness, sadness and surprise have known to be universally recognized and expressed. In order to methodically measure them, the Emotional Facial Action
Coding System (EMFACS) was proposed [3]. EMFACS focuses on muscle
movements called Action Units (AUs), which are related to the six basic emo-tions, and it provides specific coding for each of them. On the other hand, a cer-tain part of the research community has promoted an opposite theory of the un-iversality hypothesis. They proposed that the facial expressions are based on cultural learning and different races may have different ways to express emo-tions [4]. Indeed, recent cross-cultural studies have to some degree refuted this assumed universality by finding differences on facial expressions of Western- Caucasian and East-Asian people [5][6].
In spite of the psychological findings on the cultural specificity of facial ex-pressions, from the viewpoint of Human-Computer Interaction (HCI) the cul-tural universality of basic expressions is taken for granted [7]. Thus, automatic facial expression recognition systems (FER) do not consider the cultural differ-ences of facial expressions [8]. Therefore, in order to develop more realistic HCI systems, the differences of facial expressions among cultures have to be taken into account by FER systems. Furthermore, a deep analysis of recognition and representation of those differences is needed. Some of the practical applications of the results of this analysis include the development of highly accurate hu-man-robot interaction systems for social robots and that of culturally specific avatars.
The general approach of any FER system is based on three steps: face detec-tion, feature extraction and classification [9]. In order to make an accurate anal-ysis of facial expressions, the feature extraction process is crucial. Some of the techniques which are successfully applied to feature extraction are Bag of Words [10], Gabor [11], LBP [12], HOG [13] and recently Convolutional Neural Net-works (CNN) [14]. On this category, Fourier transform has accurately faced the problems of illumination changes, image rotation and dimensionality reduction of face recognition and facial expression recognition systems [15][16][17].
(mul-ticultural dataset) were analyzed. For FER analysis, we proposed a hybrid feature extraction method based on Fourier coefficients calculated from geometric and appearance features which are classified by Support Vector Machines (SVMs). In order to identify facial differences of the six basic expressions, we present two independent visual representations: reconstructed images from Eigenfaces using appearance features [18]; and caricature faces using geometric features [19]. In addition to this proposed analysis, we present a human study applied to 40 sub-jects from WSN and ASN ethnic races as a baseline.
In summary, the main contributions of this paper include supplementary findings to the theory of cultural specificity for FER based on four individual fa-cial regions and its combinations, as well as a visual analysis of the differences between Western-Caucasian and East-Asian basic facial expressions. Thus, the prior considerations for working with multicultural FER are also presented. Furthermore, the proposed analysis is based on a novel feature extraction me-thod which combines the most relevant geometric and appearance features of the facial expression. This method employs the coefficients of the 2-D Discrete Fourier Transform and Fourier Descriptors for each type of feature respectively.
The rest of the paper is organized as follows: a review of related works is pre-sented in Section 2. The proposed FER system is explained in Section 3 followed by the visual analysis proposal described in Section 4. Section 5 shows the expe-rimental results and finally, the conclusion and future works are drawn in Sec-tion 6.
2. Related Works
Related works are clearly divided by psychological and HCI viewpoints. Psycho-logical studies try to prove the refutation of the universality hypothesis of facial expressions. Meanwhile, those of HCI attempt to explain the low accuracy per-formance obtained by cross-cultural tests, taking the universality hypothesis as granted. From the psychological viewpoint, the works of Dailey et al. [5] and Jack et al. [6] present similar analysis based on human studies using cross-cul- tural datasets as stimuli. They analyzed the effect of culture-specific facial ex-pression recognition capability of U.S. (Westerns) and Japanese participants (East-Asians). The authors found in-group advantages for recognizing facial ex-pressions and they concluded that the 6 basic emotions can clearly represent the Western facial expressions, but they are inadequate to accurately represent the East-Asians emotions, demonstrating a different cultural-specific representation of the basic emotions. It is worth noting that these findings are approached from a psychological viewpoint, thereby the authors did not consider the differences that can be found in the facial representation of expressions and the effect that these differences may have in automatic FER systems.
authors concluded that multicultural training should be considered when an ef-ficient recognition performance is needed. Additionally, they pointed out that the six basic expressions are universal with subtle differences which could be in-fluenced by lighting changes or other image problems. Ali et al. [13] performed a similar study, where ensemble classifier construction was intended to find how those will be trained to accurately classify multicultural databases (from Cauca-sian and East-ACauca-sian people). The authors concluded that promising results are obtained when multicultural databases are used for training, increasing the ac-curacy achieved by the cross-cultural database experiments without regard of decreasing the accuracy in the same culture-specific database experiments. However, the misrecognition problems were attributed to factors such as differ-ences in the number of samples per expression and visual representation. In summary, many FER studies have included cross-database tests [11] [12] [13] [14] [20], but when considerable differences of accuracy among multicultural and out-group tests are found, they attribute those problems to external factors such as algorithm robustness or image quality rather than question the univer-sality of facial expressions itself.
Based on the literature of cross-cultural studies, we can summarize some im-portant points which must be considered in order to develop a robust cross- cultural analysis:
• Consistency in the size of the datasets and in the number of samples per ex-pression.
• A variety of geographic region, culture, ethnicity and race of the participants. • Robust facial feature extraction method (especially to illumination changes). • Review of in-group, out-group, multicultural and out-group multicultural
cross-classification.
• Consideration of static structure of individuals faces (neutral face treatment). • Visual representation of results and human study validation.
• Independent facial region treatment per expression.
After explaining related works and considering all of the mentioned points, we can proceed to explain our proposed analysis.
3. Proposed Feature Extraction Method
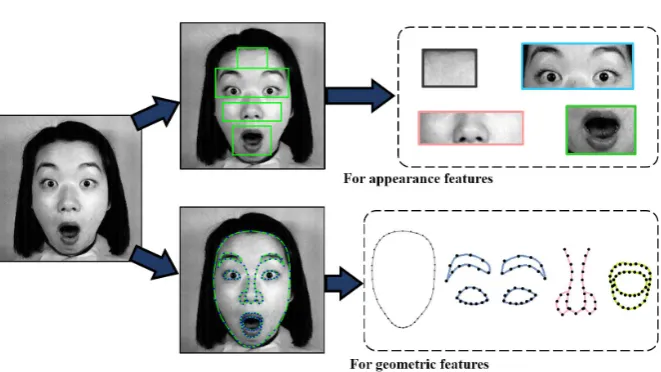
Figure 1. Example of a facial region segmentation based on appearance and geometric features.
In this way, we can analyze the culture-specific capability to recognize the basic expressions by using only one facial region. Furthermore, this analysis is ex-tended to the combinations that can be formed by the four independent regions, thus we can find the combination that achieves better recognition performance based on cross-cultural tests. An example of the region segmentation of both feature-based methods is shown in Figure 1.
3.1. Appearance Features
As mentioned before, the appearance features are individually obtained from four independent facial regions. Thus, for each facial region we applied the pro-posed feature extraction method independently. Therefore, the first step of this process is facial region segmentation which is based on the distance between irises and its relation with the four facial regions [10]. Figure 1 illustrates an example of this automatic segmentation.
Our proposal is based on the sub-block analysis of eigenphases algorithm presented in [16] which concludes that for face recognition, the ideal size of a sub-block for facing illumination problems is the smallest possible. Since the minimum size of a sub-block is equal to 2 × 2 pixels, and due to the complex part of the Fourier transform being equal to zero in this particular case, we pro-pose to use Fourier coefficients instead of the phase spectrum for the feature ex-traction process. For instance, consider IFR as the FR-th facial region image of size M×N, and for convenience I represents one of the four facial regions
which is subdivided into sub-blocks of size L L× . Then, the 2-D DFT of each sub-block of the facial region is given by
( )
1 1( )
( )2π
, ,
0 0
, , e ,
L L
j ux L vy L
p q p q
x y
f u v I x y
− −
− +
= =
=
∑ ∑
(1)( )
( )
( )
, , Re , 0 Im ,
p q
f u v = u v + × ×j u v , (2)
where Re
( )
u v, and Im( )
u v, are the real and imaginary components of( )
, ,
p q
f u v respectively. Thus, the final Fourier coefficient matrix is given by
1,1 1,2 1,
2,1 2,2 2,
,1 ,2 ,
, N L N L
M L M L M L N L
f f f
f f f
F
f f f
… … = …
(3)
where F is the Fourier coefficient matrix of the facial region, which has the same dimensions as I. Finally, in order to have correlated information with the set of training images and for dimensionality reduction we apply PCA. To this end, this confusion matrix should be converted into a column vector, so that
(
)
(
)
vec , ,
Ap
F = F m n
(4) where FAp is the column vector and 0≤m n, <M N, . Moreover, Fourier
coef-ficient vectors FAp are independently projected into the discriminative facial
region subspace obtained from the training set. These projections are considered as appearance feature vectors of the current facial region, given by
(
)
T
YAp =WAp FAp− µAp , (5)
where WAp is the facial region subspace and µAp is the mean vector of all
training images. It is worth noting that this PCA process is applied retaining 90% of the variance, soWAp is calculated using the necessary eigenvectors for
retaining that percent of the variance.
3.2. Geometric Features
Geometric features are also focused in four independent regions of the face. However, they define the shape of specific facial regions instead of texture in-formation. The shapes of eyes-eyebrows, nose, lips and the face outline were de-fined by manually picking up 163 feature points [21]. Figure 1 shows an exam-ple of these four shapes. It is worth noting that this paper intends to precisely analyze facial expression from two different racial groups which may imply sub-tle differences among specific facial regions. In this way, feature point extraction is crucial for the accuracy of feature extraction settling the analysis efficiency. Therefore, the feature points were extracted manually, even though we have also developed an automatic extraction method of a large number of feature points. The results of this automatic process tend to be affected by shooting conditions and it is still not easy to guarantee the sufficient accuracy for the analysis.
var-iation of FD and PCA as a feature extraction method for these kinds of features. To this end, each facial region shape is considered as K-point coordinate pairs, K being the number of facial feature points of the shape, where K = 54, 42, 29 and 38 for eyes-eyebrows, nose, lips and the face outline, respectively. Thus, we as-sume that a specific shape of the FR-th facial region is represented as the se-quence of coordinates:
( )
( )
( )
FR FR , FR ,
s k = x k y k
(6) where
k
=
0,1, 2,
,
K
−
1
. From one of the four facial regions, complex num-bers have to be generated from each coordinate pairs, as in( )
( )
c( )
c ,s k =x k −x + j y k −y
(7)
where
(
x yc, c)
represents the centroid of the shape, which is the average of the coordinate pairs so that( )
( )
1 1 0 0 1 1 , . K K c c t tx x k y y k
K K
− −
= =
=
∑
=∑
(8)
Subsequently, the DFT of s k
( )
is given by( )
1( )
2π
0
e ,
K
j uk K Ge
k
F u s k
− −
=
=
∑
(9)for u=0,1, 2,,K−1, where FGe
( )
u represents the Fourier coefficient vector which has to be projected into the current facial region subspace obtained by ap-plying PCA to the training set. Therefore, geometric feature vectors are defined as(
)
T
YGe =WGe FGe− µGe ,
(10)
where WGe is the current facial region subspace and µGe is the mean vector of all training images. It is important to mention that unlike the appear-ance-based process given by Equation (5), here 99% of the variance is retained.
3.3. Hybrid Method
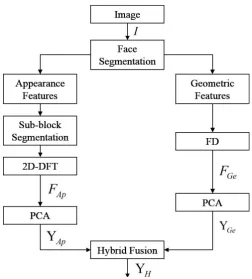
Figure 2. Framework of the fusion process of hybrid Fourier features.
The process of the complete fusion process is shown in Figure 2, where first we obtained individual feature vectors of appearance and geometric features, as defined in Equations ((5) and (10)), respectively. Thus, the process begins with the concatenation of both feature vectors, so that
T T T
H= Y , YGe Ap . (11)
Finally, the projection of H onto a new subspace of hybrid features of the cur-rent facial region represents the hybrid feature vector, which is given by
(
)
T
YH =WH H− µH , (12)
where WH is the current facial region subspace obtained by retaining the 99% of the variance, and µH is the mean hybrid vector of all training images. It is worth noting that YH only represents the feature vector of an individual facial region. Therefore, the final feature vector which is based on all possible combi-nations of the four facial regions is defined as
( )
1Y Y , 1, 2, 3, 4,
FR
H l
l FR
=
=
=(13)
where YH represents one of the four hybrid feature vectors based on a specific facial region and Y the concatenation of them. Thus, it can be conformed up to four individual facial regions.
3.4. Static Structure of Individual Faces
com-bination based on the difference between expressive facial images and neutral image of the same subject [23][24]. It is well known that the structural characte-ristics and texture information which define a specific expression appear when the face images change from neutral to expressive, hence the difference image may represent those changes and it can reduce the dependency on the subject’s identity as well. Therefore, difference images may also reduce the physical dif-ferences among faces from different races and be focused only in the way to constitute the facial expressions. For that reason, we propose to make that dif-ference between feature vectors instead of the raw images, so that
( )
l YEx( )
l YNe( )
l ,Ζ = − (14)
for
l
=
0,1, 2,
, Q 1
−
, where Q is the total number of expressive images in thedataset, YEx and YNe represents the final feature vectors of expressive and neutral facial image, and Z the difference feature vector. It is important to men-tion that for this process, informamen-tion of neutral images must be considered on each facial region subspace (W) defined in Equations ((5), (10) and (12)).
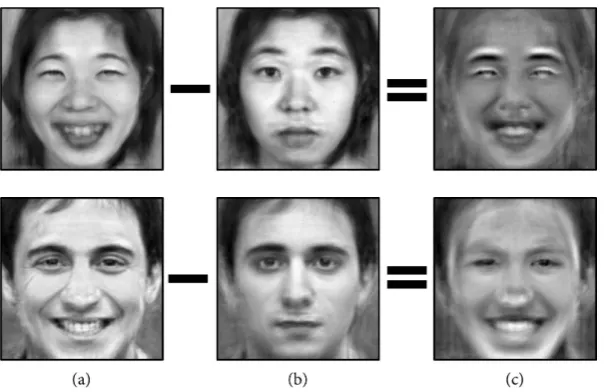
As a visual example of the effect of mentioned subtraction, Figure 3 shows two difference images of subjects from different races showing the same facial expression. As we can observe, the expressive images in the first column present physical changes related to gender and race. These noticeable differences be-tween images of the same expression may affect the classification process. On the other hand, the difference images (third column) present clear similarities based on the facial actions produced by the expression rather than physical dif-ferences.
4. Proposed Visual Analysis
[image:9.595.224.527.496.692.2]In order to make a robust analysis of facial expressions, visual changes presented in the face must be taken into account. Therefore, we present two methods for
Figure 3. Example of two difference images reconstructed from its feature vectors. (a) Expressive images from YEx; (b) Neutral images from YNe; (c) difference images from
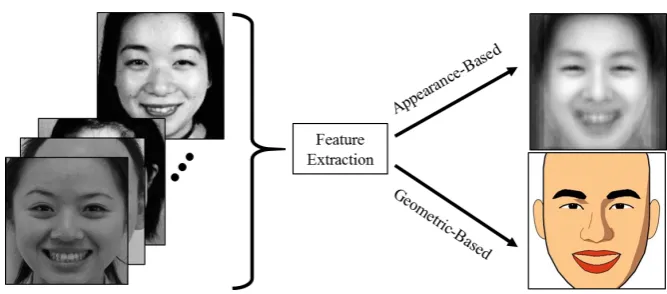
Figure 4. Average projected image of happiness from ASN dataset represented by using appearance and geometric features.
visually analyzing the differences which may appear among both racial groups. Those methods are based on the type of features employed for the analysis: ap-pearance- and geometric-based. Figure 4 shows an example of the visual repre-sentation of the average happy expression from both feature-based approaches.
4.1. Appearance-Based
The visual representation of appearance features is based on the well-known al-gorithm of Eigenfaces. The ability of this method for reconstructing images from projected vectors of a previously defined Eigenspace has been successfully ap-plied for analyzing facial expressions [25]. Therefore, using reconstructed images from feature vectors gives the opportunity to analyze the differences and simi-larities which may appear among the basic expressions of different cultures in detail. To this end, we have to obtain average projected vectors by each expres-sion, which can be calculated from a cultural-specific or multicultural dataset. These average vectors are given by:
( )
( )
( )( )
01
, P r
i
r i
P r µ
=
Ζ =
∑
Ζ(15)
for r=0,1, 2,, 5 which represents the number of basic expressions and P(r) the number of images per expression, so that Q= ×P r. As mentioned before,
in order to have a better analysis of facial expressions the number of frames per expression should be equal, then P r
( )
=Q 6. Finally, reconstructed images are the reshaped matrix of reconstructed average projected vectors given by:( )
( )
R r =W ,Ζµ r + µ (16)
for r=0,1, 2,, 5, where W is the subspace where the Z projections were made,
and µ is the mean feature vector of all training images. An example of one re-constructed image from an average happy expression is illustrated in Figure 4.
4.2. Geometric-Based
Figure 5. Framework of DrawFace tool [26] for developing facial caricatures.
the geometric features, we employed the DrawFace tool [26], which has been successfully applied for representing facial expressions from geometric feature vectors using PCA [19]. DrawFace tool draws caricatures based on the Eigenfac-es procEigenfac-ess, hence this tool requirEigenfac-es to input individual eigenspacEigenfac-es of facial re-gions and the mean facial shape as initialization setup.
Figure 5 presents the general framework of DrawFace tool. Similar to the PCA process, the mean face of the complete dataset has to be subtracted from the input, but the eigenspaces are calculated individually for each facial region and the placement of them. Thus, the final caricature is drawn by integrating the projections of the input features into its respective eigenspace. In this way, these caricatures can be considered as a result of a projected feature vector into a sub-space made by a set of specific facial shapes. For this analysis, we use the eigen-spaces and average projected vectors as obtained by Equations ((10) and (15)). Examples of caricatures of an average happy expression and individual surprise face from ASN dataset can be seen in Figure 4 and Figure 5 respectively.
5. Human Study
As a baseline for the experimental results, we present a cross-cultural human study based on a survey applied to subjects from a different race and culture. Forced-choice facial expression classification from each participant was collected by using the same datasets employed for the proposed experiments as stimuli. Relevant information about this study is presented as follows.
5.1. Participants
Mex-ican students (50% males). Their ages ranged from 20 to 26 years old (mean 22). It is important to mention that the Western-Caucasians are currently exchange students and had newly arrived in an Asian country for the first time with a res-idence time no longer than 3 months on average.
5.2. Procedure
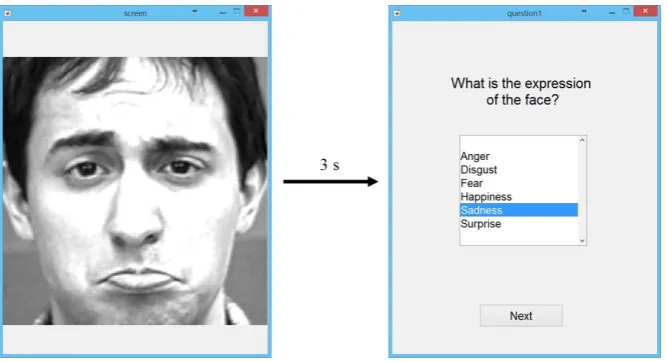
A GUI-based script for collecting and presenting the survey was developed in MATLAB. After a brief explanation of the experiment by the software, the sti-muli were automatically presented one by one. The instructions of the experi-ment were presented in Japanese and Chinese for East-Asian participants and in English for Westerns. Each stimulus appeared in the central visual field and re-mained visible just for 3 seconds, followed by a 6-way forced choice decision question related to the 6 basic expressions. The question presented was “What is the expression of the face?” and the participant has to choose one answer before clicking the button “Next” for the following stimulus. We randomized trials within each participant and all of them have to recognize the 240 stimuli of the dataset which have been presented by groups of 30 images with breaks of 30 seconds between them. Figure 6 presents two screenshots of the application software used for this study.
6. Experimental Results
6.1. Datasets
FER test, visual analysis and human study were evaluated using the same data-sets. A total of 656 images were used for this paper. 480 expressive and 176 neu-tral facial images were selected from four standard datasets which were divided into two racial groups, representing three possible training sets: Western-Cau- casian dataset (WSN), East-Asian (ASN) dataset and the multicultural dataset (MUL).
[image:12.595.209.543.537.718.2]WSN dataset is comprised of 330 facial images from 90 different subjects (40% males) of the extended Cohn-Kanade dataset (CK+) [27], which in turn is com-
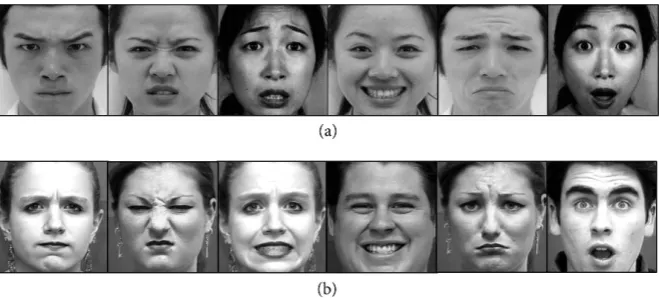
Figure 7. Example of images included in each dataset. For each row from left to right: anger, disgust, fear, happiness, sadness and surprise. (a) ASN dataset and (b) WSN data-set.
posed of 327 facial image sequences from 123 subjects performing the 6 basic emotions plus the neutral state. For this paper, the subset selected from CK+ only includes images of 90 Euro-American subjects.
ASN dataset contains 326 images selected from 86 subjects(47% males) of three different datasets: Japanese Female Facial Expression (JAFFE) dataset [28], which comprises 213 images of 10 Japanese female models; Japanese and Cauca-sian Facial Expression of Emotion (JACFEE) dataset [29], which contains 56 images from different individuals including 28 Japanese and 28 Caucasian sub-jects; and Taiwanese Facial Expression Image Database (TFEID) [30], which in-cludes 336 images from 40 Taiwanese models. In this way, ASN dataset is formed by 86 subjects from Japan and Taiwan.
Finally, MUL dataset is a combination of WSN and ASN. It is worth noting that the number of images per facial expression is equitable among each dataset, being 40 images per expression for ASN and WSN so that 240 expressive images correspond to each dataset. However, the neutral facial images vary from each dataset. Figure 7 shows an example of the six basic expressions displayed by subjects from WSN and ASN datasets.
All facial images were pre-processed in order to have the same inter-ocular distance and eye position as well as cropped with 280 × 280 pixels. For the re-gions of forehead, eyes-eyebrows, mouth and nose their sizes were normalized at 100 × 70, 200 × 80, 140 × 80 and 175 × 50 pixels respectively.
6.2. Cross-Cultural Classification
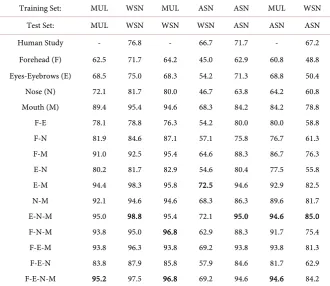
Feature vectors of the six basic expressions were classified by multi-class SVMs with RBF kernels [31], and evaluated by leave one subject out cross-validation. Average recognition rates and confusion matrices are presented to show the ac-curacy of FER. The visual analysis is focused on the changes of facial images based on the FACS, for further information refer to [3]. Table 1 shows all results obtained by the proposed method and human study.
Table 1. Classification accuracy of individual facial regions and its combinations.
Training Set: MUL WSN MUL ASN ASN MUL WSN Test Set: MUL WSN WSN WSN ASN ASN ASN Human Study - 76.8 - 66.7 71.7 - 67.2 Forehead (F) 62.5 71.7 64.2 45.0 62.9 60.8 48.8 Eyes-Eyebrows (E) 68.5 75.0 68.3 54.2 71.3 68.8 50.4 Nose (N) 72.1 81.7 80.0 46.7 63.8 64.2 60.8 Mouth (M) 89.4 95.4 94.6 68.3 84.2 84.2 78.8 F-E 78.1 78.8 76.3 54.2 80.0 80.0 58.8 F-N 81.9 84.6 87.1 57.1 75.8 76.7 61.3 F-M 91.0 92.5 95.4 64.6 88.3 86.7 76.3 E-N 80.2 81.7 82.9 54.6 80.4 77.5 55.8 E-M 94.4 98.3 95.8 72.5 94.6 92.9 82.5 N-M 92.1 94.6 94.6 68.3 86.3 89.6 81.7 E-N-M 95.0 98.8 95.4 72.1 95.0 94.6 85.0 F-N-M 93.8 95.0 96.8 62.9 88.3 91.7 75.4 F-E-M 93.8 96.3 93.8 69.2 93.8 93.8 81.3 F-E-N 83.8 87.9 85.8 57.9 84.6 81.7 62.9 F-E-N-M 95.2 97.5 96.8 69.2 94.6 94.6 84.2
features. Because the facial region of the forehead cannot be represented by geometric features, for convenience, this region was fused with the outline shape of the face. Other regions were fused with the same facial region of its counter-part kind of features.
From Table 1 we can observe a trend of the results which follows the order from top to bottom the accuracy obtained by the tests of in-group, out-multi- cultural, multicultural and out-group. Thus, the best result is reached by the in-group test of WSN (WSN vs WSN), followed by the out-multicultural test of the same dataset (MUL vs WSN) and the third place is for the multicultural test (MUL vs MUL). This trend is also followed by the human study, showing that the WSN dataset is easier for classifying the prototypic expressions.
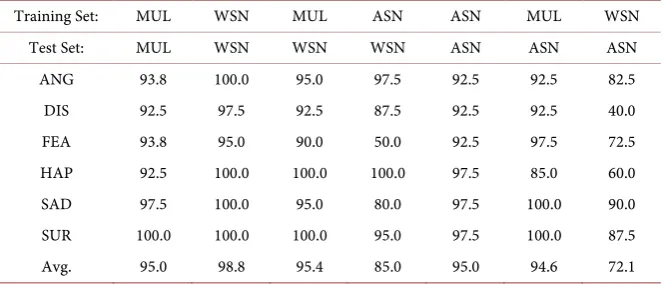
Table 2. Classification accuracy per expression using the region of Mouth.
Training Set: MUL WSN MUL ASN ASN MUL WSN Test Set: MUL WSN WSN WSN ASN ASN ASN
[image:15.595.208.540.274.416.2]ANG 92.5 95.0 95.0 72.5 90.0 90.0 85.0 DIS 81.3 90.0 90.0 60.0 72.5 72.5 32.5 FEA 87.5 95.0 97.5 72.5 72.5 77.5 80.0 HAP 88.8 95.0 95.0 92.5 85.0 82.5 70.0 SAD 88.8 100.0 92.5 85.0 87.5 85.0 60.0 SUR 97.5 97.5 97.5 90.0 97.5 97.5 82.5 Avg. 89.4 95.4 94.6 78.8 84.2 84.2 68.3
Table 3. Classification accuracy per expression using the combination of E-N-M.
Training Set: MUL WSN MUL ASN ASN MUL WSN Test Set: MUL WSN WSN WSN ASN ASN ASN
ANG 93.8 100.0 95.0 97.5 92.5 92.5 82.5 DIS 92.5 97.5 92.5 87.5 92.5 92.5 40.0 FEA 93.8 95.0 90.0 50.0 92.5 97.5 72.5 HAP 92.5 100.0 100.0 100.0 97.5 85.0 60.0 SAD 97.5 100.0 95.0 80.0 97.5 100.0 90.0 SUR 100.0 100.0 100.0 95.0 97.5 100.0 87.5 Avg. 95.0 98.8 95.4 85.0 95.0 94.6 72.1
6.3. Racial Comparisons
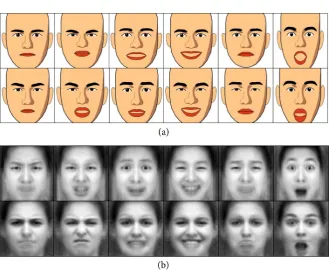
In order to have a robust results evaluation, an analysis of the differences be-tween both racial groups based on its expressive faces must be done. Therefore, Figure 8 shows the visual representation of the average expressions of both data-sets obtained from appearance and geometric features. The expressions represented by each row from left to right are: anger, disgust, fear, happiness, sadness and surprise. From this illustration, we can observe the same distinctive patterns of difference from specific expressions. For instance, disgust and fear expressions look different. Disgusted faces from WSN fulfill the necessary AUs to be classi-fied as disgust (AU9, AU15, AU16). However, the same average face from ASN presents an extra AU22 and AU23 which are known to appear in anger expres-sion. The average face of fear from WSN again covers the EMFACS for fear ex-pression (AU1, AUN2, AU4, AU5, AU7, AU20, AU26). However, that of ASN lacksAU4 and AU20, given the impression of surprised in the eyes region and the mouth is not well defined.
Figure 8. Visual representation of average expressions from ASN (upper row) and WSN (lower row) datasets using (a) appearance features and (b) geometric features. For each row from left to right: anger, disgust, fear, happiness, sadness and surprise.
Figure 9. Average projected vectors of six expressions, (a) from ASN and (b) from WSN.
among themselves rather than those of ASN, which have problems especially for the expressions of fear, disgust and anger.
[image:16.595.59.542.381.615.2]Figure 10. Confusion matrices of mouth region for out-group test. (a) ASN vs WSN (b) WSN vs ASN.
Figure 11. Confusion matrices of eyes region for out-group test. (a) ASN vs WSN (b) WSN vs ASN.
ing the visualization, showing higher results in black and lower in white. The confusion matrices represent the true expression on the vertical axis and the deci-sion made by the classifier is presented on the horizontalaxis so that each row of the matrix indicates the level of confusion of each expression with its counterparts.
From these confusion matrices, we can observe that the misclassification problems mainly reside in the expressions of fear and disgust for both facial re-gions. Some examples of the faces misrecognized even for the human study are presented in Figure 12, which shows the original expressive facial image, its feature vector extracted using E-M-N combination and the visual representation using appearance features (difference image).
Finally, Table 4 presents a comparison of our results with those found in the literature. A few studies have analyzed the cross-cultural recognition capabilities of their proposals. Nevertheless, none of them have covered the out-group mul-ticultural analysis. Even though the recognition accuracy is vastly ranged, the same trend is found: the results of in-group tests are better than those of out-group and WSN datasets achieve higher accuracy than ASN.
[image:17.595.211.541.218.318.2]Figure 12. Examples of misclassification. (a) sample from ASN dataset showing anger misrecognized with sadness. (b) sample from WSN dataset showing fear misrecognized with disgust.
Table 4. Classification accuracy of the proposed method and previous works with cross- cultural tests.
Training Set: ASN WSN ASN WSN MUL MUL MUL Test Set: ASN WSN WSN ASN MUL ASN WSN Gabor [11] 89.7 91.5 54.1 55.9 - - - LBP + SVM [12] 81.0 91.4 - 41.3 - - - HOG + NNE [13] - - 55.9 63.6 93.8 - -
CNN [14] 86.7 98.9 - 79.6 - - -
HOG + SVM [20] 88.6 93.5 39.9 42.3 84.7 - - Human Study 71.7 76.8 66.7 67.2 - - - Proposed 95.0 98.8 72.5 85.0 95.2 94.6 96.8
Table 5. Datasets included in each cultural group of previous cross-cultural studies.
Dataset: ASN WSN
Gabor [11] JAFFE CK
LBP + SVM [12] JAFFE CK
HOG + NNE [13] JAFFE, TFEID RAFD
CNN [14] JAFFE CK+
HOG + SVM [20] JAFFE CK+, MUG
Proposed JAFFE, JACFEE, TFEID CK+
7. Conclusions and Future Work
[image:18.595.210.539.565.685.2]East-Asian basic expressions focused on four facial regions. Based on the litera-ture and from a psychological viewpoint, we know that there exist in-group ad-vantages for recognizing facial expressions when using cross-cultural datasets and Western-Caucasian facial expressions are closer related to the six basic emo-tions than those of East-Asian. Moreover, from an HCI viewpoint we know that multicultural training is necessary for increasing the accuracy of FER systems. Following these findings, the cross-cultural tests analyzed in this paper present the same trend about the design of the training phase which suggests that WSN basic expressions are easier to recognize than those of ASN. In addition, as indi-cated by previous works, we found strong cross-cultural similarities on the ex-pressions of happiness and surprise. On the other hand, even though the system trained by using the multicultural dataset (MUL) reached higher accuracy, the proposed analysis of out-group multicultural test follows the same trend by ex-posing difficulties for recognizing ASN expressions. This issue points out the cultural-specific differences that can be found on showing the six basic expres-sions. To this end, and thanks to the facial region segmentation presented in this paper, we fully analyzed the cross-cultural recognition performance of individu-al faciindividu-al regions and its combinations. In this way, our anindividu-alysis individu-also contributes to identifying the differences between WSN and ASN expressive faces which are primarily found in the regions of mouth and eyes-eyebrows, specifically for ex-pressions of disgust and fear.
In summary, we can conclude that when working with multicultural datasets for FER, it is better to set up specific training for each cultural group. This issue could be pointed out by including an extra pre-processing stage for race recogni-tion. In addition, the cultural-specific training strongly depends on the applica-tion of the FER system due to the cross-cultural similarities found on the so- called positive expressions. On the other hand, we frankly recognize that this analysis deals with the problem of reliability of the datasets. Most of the standard datasets are taken under controlled environments and expressions are shown by professional actors which sometimes exaggerate and break the spontaneity of a true facial expression. However, despite the limitations of the datasets, the pro-posed analysis helps to find cultural differences of specific facial expressions and introduces a methodical process for analyzing new FER methods.
As a future work, we plan to expand the limited size of the datasets, as well as to include datasets without controlled environments and with subjects of differ-ent nationalities from similar cultures. In addition, we would like to analyze the reliability of the set of basic expressions for ASN, from an HCI viewpoint.
Acknowledgements
References
[1] Darwin, C. (1872) The Expression of the Emotions in Man and Animals. Oxford University Press, Oxford. https://doi.org/10.1037/10001-000
[2] Ekman, P. (1972) Universal and Cultural Differences in Facial Expression of Emo-tion. In: Proceedings of Symposium on Motivation, Nebraska University Press, Lincoln, 9-15.
[3] Ekman, P., Friesen, W.V. and Hager, J.C. (1978) Facial Action Coding System (FACS). A Technique for the Measurement of Facial Action. Consulting, Palo Alto, 22.
[4] Jack, R.E. (2013) Culture and Facial Expressions of Emotion. Visual Cognition, 21, 1248-1286. https://doi.org/10.1080/13506285.2013.835367
[5] Dailey, M.N., et al. (2010) Evidence and a Computational Explanation of Cultural Differences in Facial Expression Recognition. Emotion, 10, 874-893.
https://doi.org/10.1037/a0020019
[6] Jack, R.E., Garrod, O.G., Yu, H., Caldara, R. and Schyns, P.G. (2012) Facial Expres-sions of Emotion Are Not Culturally Universal. Proceedings of the National Acad-emy of Sciences, 109, 7241-7244. https://doi.org/10.1073/pnas.1200155109
[7] Tian, Y., Kanade, T. and Cohn, J.F. (2011) Facial Expression Recognition. In:
Handbook of Face Recognition, Springer, London, 487-519.
https://doi.org/10.1007/978-0-85729-932-1_19
[8] Sariyanidi, E., Gunes, H. and Cavallaro, A. (2015) Automatic Analysis of Facial Af-fect: A Survey of Registration, Representation, and Recognition. IEEE Transactions on Pattern Analysis and Machine Intelligence, 37, 1113-1133.
https://doi.org/10.1109/TPAMI.2014.2366127
[9] Deshmukh, S., Patwardhan, M. and Mahajan, A. (2016) Survey on Real-Time Facial Expression Recognition Techniques. IET Biometrics, 6, 155-163.
[10] Li, Z., Imai, J.I. and Kaneko, M. (2010) Facial Expression Recognition Using Fa-cial-Component-Based Bag of Words and PHOG Descriptors. Journal of ITE, 64, 230-236. https://doi.org/10.3169/itej.64.230
[11] Gu, W., Xiang, C., Venkatesh, Y.V., Huang, D. and Lin, H. (2012) Facial Expression Recognition Using Radial Encoding of Local Gabor Features and Classifier Synthe-sis. Pattern Recognition, 45, 80-91.
[12] Shan, C., Gong, S. and McOwan, P.W. (2009) Facial Expression Recognition Based on Local Binary Patterns: A Comprehensive Study. Image and Vision Computing, 27, 803-816.
[13] Ali, G., Iqbal, M.A. and Choi, T.S. (2016) Boosted NNE Collections for Multicultur-al FaciMulticultur-al Expression Recognition. Pattern Recognition, 55, 14-27.
[14] Lopes, A.T., de Aguiar, E., De Souza, A.F. and Oliveira-Santos, T. (2017) Facial Ex-pression Recognition with Convolutional Neural Networks: Coping with Few Data and the Training Sample Order. Pattern Recognition, 61, 610-628.
[15] Hwang, W., Wang, H., Kim, H., Kee, S.C. and Kim, J. (2011) Face Recognition Sys-tem Using Multiple Face Model of Hybrid Fourier Feature under Uncontrolled Il-lumination Variation. IEEE Transactions on Image Processing, 20, 1152-1165.
https://doi.org/10.1109/TIP.2010.2083674
[16] Benitez-Garcia, G., Olivares-Mercado, J., Sanchez-Perez, G., Nakano-Miyatake, M. and Perez-Meana, H. (2013) A Sub-Block-Based Eigenphases Algorithm with Op-timum Sub-Block Size. Knowledge-Based Systems, 37, 415-426.
[17] Benitez-Garcia, G., Sanchez-Perez, G., Perez-Meana, H., Takahashi, K. and Kaneko, M. (2014) Facial Expression Recognition Based on Facial Region Segmentation and Modal Value Approach. IEICE Transactions on Information and Systems, 97, 928- 935. https://doi.org/10.1587/transinf.E97.D.928
Rec-ognition, Hawaii, 3-6 June 1991, 586-591. https://doi.org/10.1109/cvpr.1991.139758
[19] Benitez-Garcia, G., Nakamura, T. and Kaneko, M. (2017) Analysis of Differences between Western and East-Asian Faces Based on Facial Region Segmentation and PCA for Facial Expression Recognition. In: AIP Conference Proceedings 1807, AIP Publishing, Tokyo, Article ID: 020025. https://doi.org/10.1063/1.4974807
[20] Da Silva, F.A.M. and Pedrini, H. (2015) Effects of Cultural Characteristics on Building an Emotion Classifier through Facial Expression Analysis. Journal of Elec-tronic Imaging, 24, 0230151-0230159. https://doi.org/10.1117/1.jei.24.2.023015
[21] Benitez-Garcia, G., Nakamura, T. and Kaneko, M. (2017) Analysis of In- and Out-Group Differences between Western and East-Asian Facial Expression Recog-nition. Proceedings of the 14th IAPR International Conference on Machine Vision Applications (MVA 2017), Nagoya, 8-12 May 2017. (In Press)
[22] El-Bakry, H.M. (2001) Automatic Human Face Recognition Using Modular Neural Networks. Machine Graphics and Vision, 10, 47-73.
[23] Yi, J., Mao, X., Chen, L., Xue, Y. and Compare, A. (2014) Facial Expression Recog-nition Considering Individual Differences in Facial Structure and Texture. IET Computer Vision, 8, 429-440. https://doi.org/10.1049/iet-cvi.2013.0171
[24] Mohammadi, M.R., Fatemizadeh, E. and Mahoor, M.H. (2014) PCA-Based Dictio-nary Building for Accurate Facial Expression Recognition via Sparse Representa-tion. Journal of Visual Communication and Image Representation, 25, 1082-1092. [25] Calder, A.J., Burton, A.M., Miller, P., Young, A.W. and Akamatsu, S. (2001) A
Principal Component Analysis of Facial Expressions. Vision Research, 41, 1179- 1208.
[26] Kaneko, M. (2008) Computerized Facial Caricatures. Journal of Institute of Image Information and Television Engineers,62, 1938-1943.
https://doi.org/10.3169/itej.62.1938
[27] Kanade, T., Cohn, J.F. and Tian, Y. (2000) Comprehensive Database for Facial Ex-pression Analysis. Proceedings of 4th IEEE International Conference onAutomatic Face and Gesture Recognition, Washington DC, 28-30 March 2000, 46-53.
https://doi.org/10.1109/AFGR.2000.840611
[28] Lyons, M., Akamatsu, S., Kamachi, M. and Gyoba, J. (1998) Coding Facial Expres-sions with Gabor Wavelets. Proceedings of 3rd IEEE International Conference on Automatic Face and Gesture Recognition, Nara, 14-16 April 1998, 200-205.
https://doi.org/10.1109/AFGR.1998.670949
[29] Biehl, M., et al. (1997) Matsumoto and Ekman’s Japanese and Caucasian Facial Ex-pressions of Emotion (JACFEE): Reliability Data and Cross-National Differences.
Journal of Nonverbal Behavior, 21, 3-21. https://doi.org/10.1023/A:1024902500935
[30] Chen, L.F. and Yen, Y.S. (2007) Taiwanese Facial Expression Image Database. Brain Mapping Laboratory, Institute of Brain Science, National Yang-Ming University, Taipei.
[31] Chang, C.C. and Lin, C.J. (2011) LIBSVM: A Library for Support Vector Machines.
ACM Transactions on Intelligent Systems and Technology, 2, 27.
Submit or recommend next manuscript to SCIRP and we will provide best service for you:
Accepting pre-submission inquiries through Email, Facebook, LinkedIn, Twitter, etc. A wide selection of journals (inclusive of 9 subjects, more than 200 journals)
Providing 24-hour high-quality service User-friendly online submission system Fair and swift peer-review system
Efficient typesetting and proofreading procedure
Display of the result of downloads and visits, as well as the number of cited articles Maximum dissemination of your research work
Submit your manuscript at: http://papersubmission.scirp.org/
![Figure 5. Framework of DrawFace tool [26] for developing facial caricatures.](https://thumb-us.123doks.com/thumbv2/123dok_us/7761107.712737/11.595.209.541.69.274/figure-framework-drawface-tool-developing-facial-caricatures.webp)