warwick.ac.uk/lib-publications
Manuscript version: Published Version
The version presented in WRAP is the accepted version.
Persistent WRAP URL:
http://wrap.warwick.ac.uk/102917
How to cite:
The repository item page linked to above, will contain details on accessing citation guidance from the publisher.
Copyright and reuse:
The Warwick Research Archive Portal (WRAP) makes this work of researchers of the University of Warwick available open access under the following conditions.
This article is made available under the Attribution-NonCommercial-NoDerivs 3.0 UK: England & Wales (CC BY-NC-ND 3.0 UK) and may be reused according to the conditions of the license. For more details see: https://creativecommons.org/licenses/by-nc-nd/3.0/
Publisher’s statement:
Please refer to the repository item page, publisher’s statement section, for further information.
Interpolating vector fields for near identity maps and
averaging
V. Gelfreich
1and A. Vieiro
21
Mathematics Institute, University of Warwick, Coventry CV4 7AL, UK
2
Departament de Matem`atiques i Inform`atica,
Universitat de Barcelona, Gran Via 585, 08007 Barcelona, Spain
May 3, 2018
Abstract
For a smooth near identity map, we introduce the notion of an interpolating vector field written in terms of iterates of the map. Our construction is based on Lagrangian interpolation and provides an explicit expressions for autonomous vector fields which approximately interpolate the map. We study properties of the interpolating vector fields and explore their applications to the study of dynamics. In particular, we con-struct adiabatic invariants for symplectic near identity maps. We also introduce the notion of a Poincar´e section for a near identity map and use it to visualise dynamics of four dimensional maps. We illustrate our theory with several examples, including the Chirikov standard map, a volume-preserving map and a symplectic map in dimension four. The last example is motivated by the theory of Arnold diffusion.
1
Introduction
It is well known that a near identity map F, where || 1 and F0 = I, is formally embedded into an autonomous flow [16]. Indeed, a formal construction can be used to find a vector field in the form of a formal power series in such that the formal series of the corresponding time- map coincides with the Taylor series of the original map. Truncated series define a vector field which interpolates the map with an error of order of the first omitted term. Note that this construction is formal only as in general the map cannot be embedded into an autonomous flow, i.e. generic F cannot be represented as a time- map
of an autonomous vector field [10]. Nevertheless, the difference between them can be made a flat function in at = 0 [14]. In the analytic case, the difference becomes exponentially small in when the series are optimally truncated [1].
An alternative approach to the study of near identity maps is based on averaging (see e.g. [10]). A near identity map F can be written as a time- map of a time-periodic vector
field called a suspension of the map. Then the averaging procedure can be used recursively to eliminate the time-dependence up to any order of the small parameter. In the analytic case, a suspension can be found in the form of an analytic autonomous vector field plus an exponentially small non-autonomous term [10] (see also [3] for a concrete example). In order to make the paper more self-contained, we sketch the construction of a suspension and averaging procedure in Section 2.3. The corresponding arguments are based on the implicit function theorem and involve vectorfields which are analytic in the space variables but only
C∞in time. We note that a suspension can be made analytic both in the space variables and time [9] but the corresponding construction is more complicated, moreover, the analyticity in time is not essential for the application of the averaging theory.
Both these methods are constructive, nevertheless, none of them provides an easy way to find an explicit expression for a vector field which approximately interpolates the map. In this paper we propose a new method for construction of such vector fields henceforth referred to as interpolating vector fields. The interpolating vector fields are represented in the form of weighted sums of iterates of the map, i.e. Xn =
Pn
k=−npnkFk. Therefore our
construction can be considered as a discrete version of the averaging method. The weights
pnk are constants determined explicitly with the help of the Lagrange interpolation.
The simplicity of the expressions for the interpolating vector fields turn them into a useful tool for analysis of dynamics. In particular, we introduce the notion of a “Poincar´e section” for the mapF. Similarly to classical Poincar´e section, this construction reduces the
dimension of the phase space by one and, consequently, can be used to visualise trajectories of four-dimensional maps. We note that the method of slices can be used to achieve the same goal (see e.g. [12]). Of course, the method of slices is applicable to a wider class of maps as it does not require the map to be near identity. On other hand, if the map is near identity, the interpolating vector fields have a potential for refining the method of slices by taking into account the dynamics: orthogonal projections used in the method of slices may be replaced by projections along an interpolating vector field in hope of getting a better representation of invariant sets using a smaller number of iterates. A more detailed comparison of the methods can be found in Section 3.3.
to construct an adiabatic invarianthn. The functionhn is approximately preserved for many
iterates of the map and can be used for a further reduction of the dimension.
In order to illustrate the effectiveness of the method and before discussing technical details involved in the construction, let us consider a 4-dimensional near identity Froeschl´ e-like symplectic diffeomorphism T defined on T2 ×R2. In coordinates (ψ1, ψ2, J1, J2) this map is defined by the equation (3.6) but the precise expression is not important for the current discussion. Let Σ be a three-dimensional cylinder defined by the equality ψ1 = ψ2. Fig.1(a) shows points from several trajectories ofT projected along an interpolating vector
field onto Σ. We call this picture a Poincar´e section for the map T.
In Fig. 1 all initial conditions are chosen from a torus defined by the intersection of Σ with a level set of the adiabatic invariant h10. Since h10 is approximately preserved by the map, all points shown on Fig.1(a) are in a small neighbourhood of the torus. Then a clearer image of the dynamics is obtained with the help two angular coordinates, namely, ψ and
φ = arg(J1+iJ2). Fig. 1(b) shows the projection of Fig. 1(a) onto the torus (ψ1, φ), and Fig.1(c) is a magnification of a strip located near the top of Fig.1(b). These pictures reveal that the four-dimensional dynamics of T resemble a two-dimensional area-preserving map.
This similarity can be explained with the help of the normal form theory [11]. The latter also provides an alternative visualisation method (see [6]). We stress that the method of this paper is much easier to implement and provides higher accuracy in representation of details of the dynamics as our pictures represent true trajectories of T since the interpolation is
used only for selecting initial conditions and projecting points onto Σ. The details of the model and the method are described in Section 3.
To give more formal definitions for the objects discussed in this paper, consider a smooth one-parameter near identity family of maps F :D→Rm wherem ≥1,D⊂Rm is an open
domain and ||< 0. Then the map can be written in the form
F(x) = x+ G(x),
where G depends smoothly on x and . The functionG0 obtained by setting = 0 is often called a limit vector field. Its time- map is 2-close to F
.
The central object of this paper is an interpolating vector field for the near identity map F defined in the following way. Fix a positive integern. Let x∈D and suppose that
the iterates xk=Fk(x)∈Dare defined for−n≤k ≤n. Then there is a unique polynomial
pn of degree 2n int such that
xk =pn(tk, x0, ) (1.1)
for every tk =k with |k| ≤ n. The coefficients of pn depend on x and . The interpolating
vector field is defined as the velocity vector of the interpolating curve at t= 0, i.e.,
Xn(x, ) =∂tpn(0, x, ) (1.2)
where ∂tpn denotes the derivative of pn with respect to t. In Section 2 we will use the
(a)
1.2
0
φ
ψ
π
π
−
π
[image:5.612.77.535.73.589.2](b) (c)
Figure 1: Dynamics of a symplectic map on a four-dimensional cylinderT2 ×
of the iterates of the initial point x=x0,
Xn(x, ) = −1
n
X
k=1
pnk(xk−x−k), (1.3)
where
pnk =
(−1)k+1(n!)2
k(n+k)!(n−k)!. (1.4) Note that the coefficientspnk are independent of the mapF. In particular, for n = 1 we get
X1(x, ) =
F(x)−F−1(x)
2 .
The time- map of this vector field is 3-close to F. Thus the flow of X1 provides more accurate interpolation forF than the limit flow.
Let Φt
Xn be the flow defined by the vector field Xn. In section 2.4 we will show that
ΦXn =F+O(2n+1). Moreover, in a way similar to the classical averaging theory [10], the
interpolation error becomes exponentially small, O(e−c/||), when n is chosen to be of order
of −1.
IfF :D→Dis a diffeomorphism, then the domainDis invariant and the equation (1.3)
defines Xn on D for every n ∈ N. In general, we do not assume that D is invariant, and
iterates of a point x0 ∈ D may leave the domain. Nevertheless, it is not difficult to show that for any compact subset D0 ⊂ D, there is a constant r0 > 0 such that xk = Fk(x) is
defined for everyx∈D0 and every integerk provided |k| ≤r0. Therefore Xn is defined on
D0 for every n≤r0||−1.
If the map F is a lift of a diffeomorphism of a torus or cylinder, then the interpolating
vector field is also a lift of a vector field defined on the same manifold. It is possible to generalize the definition onto a general manifold but this discussion is beyond the aims of the present paper.
We note that if F and F−1 are both polynomial (e.g. the classical H´enon map and its
generalisations), then the interpolating vector field is also polynomial.
In the symplectic case, the interpolating vector fields remove the need of computing an averaged Hamiltonian. This opens an opportunity of performing massive numerical ex-plorations of a multi-dimensional phase space, reducing the computation time significantly. Possible dynamical applications of this visualizing techniques include, among others, study-ing of area-preservstudy-ing maps inC2 and of Arnold diffusion for 4-dimensional symplectic maps near double resonances.
The rest of this paper is organised as follows. In Section 2we briefly summarise the La-grangian interpolation theory and derive some properties of the interpolating vector fields. Then we analyse the accuracy of interpolation. We discuss connections between the inter-polating vector field and suspensions of the map F. In particular, we discuss connections
Xn is not symplectic, it still can be used to define an adiabatic invariant hn which remains
approximately constant for about−2n iterates of the map F .
In Section 3 we present results of our numerical experiments to illustrate the use of the interpolating vector fields for exploring the dynamics of maps in regions where they are near the identity. First, in Section3.1we consider the 2-dimensional symplectic case and perform experiments with the Chirikov standard map as a model. This is a preliminary example which illustrates various useful features of the interpolating vector fields. Moreover, one can compare the interpolating vector field directly with the map as the two dimensional dynamics is easy to visualize.
The main advantage of interpolating vector fields is that they provide a useful tool to investigate higher dimensional phase spaces. In particular, they provide a powerful tool for computing projections of the discrete dynamics onto subspaces of codimension-one. We use this tool to define Poincar´e sections for maps, an extension of the classical construction traditionally restricted to systems with continuous time only, see details in Section 3.2. We illustrate this construction for a three-dimensional volume-preserving map and a four-dimensional symplectic map and obtain representations of different types of dynamics with the help of plots in dimensions two and three.
2
Interpolating vector fields
2.1
Lagrange interpolating polynomials
An interpolating polynomial can be explicitly written with the help of Lagrange interpolating polynomials (see e.g. [15]). Suppose that nodes are located at integer points symmetrically with respect to τ = 0. Then Lagrange’s fundamental interpolating polynomial is
πn(τ) =
n
Y
k=−n
(τ −k) (2.1)
and Lagrange’s basis polynomials are
πnk(τ) =
πn(τ)
π0
n(k)(τ −k)
. (2.2)
For every n ∈ N and |k| ≤ n the equation (2.2) defines the unique polynomial of degree 2n
such that πnk(j) = δkj for every |j| ≤n, where δkj is the Kronecker delta. For 1 ≤ |k| ≤ n
we differentiate the equation (2.2) and, taking into account thatπn(0) = 0, we get π0nk(0) = −π0n(0)
kπ0
n(k). Since π 0
n(0) = (−1)n(n!)2 and
πn0(k) =
k−1 Y
j=−n
(k−j)
n
Y
j=k+1
we conclude that πnk0 (0) =pnk where
pnk =
(−1)k+1(n!)2
k(n+k)!(n−k)!. (2.4)
Sinceπn is odd,πn0 is even and, consequently,pn0 =π0n0(0) = 0. The constants pnk are used
in the equation (1.3) which defines the interpolating vector fields. Later we will need some properties of these constants.
Proposition 2.1. For every n fixed, (−1)k+1p
nk is a monotone decreasing positive sequence
for 1≤k≤n, and pn,−k =−pnk. Moreover,
n
X
k=−n
pnkkj =
(
1, if j = 1,
0, if j = 0 or 2≤j ≤2n, (2.5)
n
X
k=1
|pnk|=
Hn
2 and
n
X
k=1
pnk =H2n−Hn, (2.6)
where Hn =Pnk=1k−1 is the n-th harmonic number.
Proof. The first equality can be derived from the following observation. Let 0 ≤ j ≤ 2n. Interpolating any polynomial of degree j with the help of a polynomial of degree 2n, we recover the original polynomial. Applying this rule to τj we get that
n
X
k=−n
πnk(τ)kj =τj.
Differentiating this equality with respect toτ atτ = 0 we obtain (2.5).
Let r > 0 and consider a continuous curve γ : [−r, r] → Rm. For any 6= 0 and n ∈
N such that n||< r, the equation
pn(t, ) = n
X
k=−n
πnk(−1t)γ(k)
defines the unique polynomial of degree 2n such that pn(k, ) = γ(k) for |k| ≤ n. Let
vn(γ, ) =∂tpn(0, ). Taking into account the expression for pn we get
vn(γ, ) = −1
n
X
k=−n
pnkγ(k). (2.7)
Note that although this definition contains a division by, the following lemma implies that
Lemma 2.2. If γ ∈ C2n+1 [−r, r]
and ||n < r, then
|γ˙(0)−vn(γ, )| ≤
2n(n!)2 (2n+ 1)!max|t|≤r
γ(2n+1)(t)
. (2.8)
Proof. The standard theory of interpolating polynomials, see e.g. [15], states that
γ(t) =pn(t, ) +
2n+1π
n(−1t)
(2n+ 1)! wn(t, ),
where the functionwncan be expressed aswn(t, ) =γ(2n+1)(τ∗(t, )) withτ∗(t, )∈[−n, n],
an intermediate value of the time variable. Since the zeroes ofπare all simple,wis continuous att =k. Differentiating with respect to t at t= 0 and taking into account that πn(0) = 0,
we get
˙
γ(0) =vn(γ, ) +
2nπn0(0) (2n+ 1)!γ
(2n+1)(τ
∗(0, )).
The estimate of the lemma immediately follows from (2.3). This inequality implies that
vn(γ, )→γ˙(0) when →0.
Lemma 2.3 (stability with respect to perturbations). If γ1, γ2 ∈ C0([−r, r]), 6= 0 and
n||< r, then
|vn(γ2, )−vn(γ1, )| ≤ ||−1Hnkγ2−γ1k
where Hn =
Pn
k=1k
−1 is the n-th harmonic number.
Proof. Using (2.7) and the triangle inequality we get
|vn(γ2, )−vn(γ1, )| ≤ ||−1
n
X
k=−n
|pnk| |γ2(k)−γ1(k))|
≤ ||−1kγ
2−γ1k
n
X
k=−n |pnk|.
Then the first equality in (2.6) implies the estimate of the lemma.
2.2
Basic properties of interpolating vector fields
The interpolating polynomial of the equation (1.1) can be explicitly written in the form of a Lagrange interpolating polynomial, namely,
pn(t, x, ) =
n
X
k=−n
πnk(−1t)xk, wherexk =Fk(x).
Differentiating this equality with respect to t at t = 0 and using that πnk0 (0) = pnk, we
recover the explicit expression (1.3) for the interpolating vector field (1.2):
Xn(x, ) = −1
n
X
k=−n
pnkxk =−1
n
X
k=1
For example, for n= 2 we get
X2(x, ) =
2
3 F(x)−F
−1
(x)
− 1
12 F
2
(x)−F −2
(x)
.
The definition of the interpolating vector field involves division by, but we will see thatXn
can be continuously extended to = 0.
Proposition 2.4. Let D0 ⊂D be compact. Then there is r0 >0 such that the interpolating vector field is defined for all x ∈ D0 and all n ∈ N such that n|| ≤ r0. For every n, the interpolating vector field Xn is as smooth as the map F itself and Xn(x,0) =G0(x).
Proof. Let F(x) =x+G(x) =x+g1(x, ). Obviously,g1(x,0) =G0(x). Then the finite
induction implies that
xk=Fk(x) = x0+
k−1 X
j=0
g1(xj, ) (2.10)
for every k ∈N such that xj ∈D for all 0 ≤j ≤ k. Similarly, the inverse function theorem
implies that F−1
(x) = x−g−1(x, ), where g−1(x,0) = −G0(x). Repeating the previous arguments we conclude that
x−k =F−k =x0+
k−1 X
j=0
g−1(x−j, ). (2.11)
Using the finite induction, the equations (2.10) and (2.11) and compactness of D0, we prove that there is r0 >0 such that Fk(x)∈Dfor all x∈D0 provided |k|< r0.
Substituting the expressions (2.10) and (2.11) into the definition (2.9) of Xn, and using
(2.5) with j = 0, we obtain
Xn(x, ) =
n
X
k=−n
pnk |k|−1
X
j=0
gsign(k)(xsign(k)j, ) (2.12)
and the smoothness of Xn follows directly. Finally, we note that if = 0, then xj =x0 =x for every j. Substituting = 0 into the equation (2.12) we get
Xn(x,0) =
n
X
k=−n
pnk |k|−1
X
j=0
gsign(k)(x,0) =
n
X
k=−n
pnkkG0(x).
Then the equation (2.5) with j = 1 implies that Xn(x,0) =G0(X).
Proposition 2.5. LetΦτ be a time-τ flow of a smooth autonomous vector fieldY andn ∈
N. Let Xn be an interpolating vector field for the map Φ. Then
Y(x) = Xn(x, ) +O(2n).
The estimate is uniform on every compact subset of D.
Proof. Letx∈Dandγ be a solution of the initial value problem for the ordinary differential equation ˙γ =Y(γ), γ(0) =x. Then Proposition2.5 follows from Lemma2.2 as the solution is smooth.
We note that the following arguments can also be used to prove the proposition. Ex-panding the solution γ of the initial value problem into Taylor series in time we get
γ(t) =x+
2n
X
k=1
tk
k!γ
(k)(0) +r 2n(t)
where γ(1)(0) =Y(x) andr
2n(t) = O(t2n+1). Substituting this expression into the definition
of the interpolating vector field we get
Xn(x, ) =
n
X
k=−n
pnkγ(k) =
n
X
k=−n
pnk
2n
X
j=1
jkj
j! γ
(j)(0) +r 2n(k)
!
= 2n
X
j=1
j
j!γ (j)(0)
n
X
k=−n
kjpnk+Rn() =Y(x) +Rn(),
where Rn() =
Pn
k=−npnkr2n(k) = O(2n+1). Here we used the equation (2.5) to simplify
the sum.
Remark 2.6. If x0 is a fixed point of F, then x0 is an equilibrium of Xn.
Remark 2.7. For a fixed n and a smallthe interpolating vector field Xn(x, )only involves
values of F from a small neighbourhood of the point x.
Remark 2.8. IfF is a lift of a map defined on a cylinder (or a torus), then the interpolating
vector field Xn is also a lift of a vector field defined on the same manifold. This argument
also applies to every manifold obtained by factorising Rm with respect to action of a discrete
group of (affine) linear transformations.
We recall that a map F is called reversible, if there is an involution R (i.e., R◦R = I)
which conjugates the map and its inverse, i.e.,F−1
=R◦F◦R. The involutionR is called
a reversor. In this paper we consider only the case when R is a linear map. This case is often used in applications.
Proposition 2.9. If F is a reversible map with a linear reversor R, then the interpolating
vector field is also reversible, i.e. the application of the mapR changes the direction of time:
This proposition is proved by a straightforward computation using the symmetric expres-sion for the interpolating vector field (1.3) and the fact that the reversorR maps a trajectory of F into a trajectory of F−1.
Let F be a map defined on an one-dimensional interval. Suppose that x0 ∈R is a fixed point ofF and let λ =F0(x0). Then x0 is an equilibrium for the interpolating vector field, i.e. Xn(x0) = 0, and
Xn0(x0) =−1
n
X
k=1
pnk λk −λ
−k
.
Ifis sufficiently small, the linear stability type of the fixed point is the same for the map and for the interpolating vector field. Moreover, sinceF is a monotone function, it is easy to see
that the time-map of the interpolating vector field is topologically conjugate toF. On the
other hand, in general, the conjugating function cannot be differentiable as the multipliers
λ and exp(Xn0(x0)) of the fixed points can be different. The conclusions about topological equivalence do not require hyperbolicity of F and do not generalize to higher dimensions.
2.3
Suspensions of a map and averaging
In general it is not possible to construct an autonomous vector field such that its time-
map coincides withF. On the other hand, it is possible to construct a time-periodic vector
field with this property. Such vector field is called a suspension of F. Suppose that Y is a
suspension of F. This vector field has the following characteristic property: ifξ =ξ(τ, x, )
is a solution of the initial value problem
∂τξ=Y(τ, ξ, ), ξ(0, x, ) =x , (2.13)
then ξ(1, x, ) =F(x). Note that we use the fast time τ =−1t instead of the slow time t.
It is not too difficult to construct a suspension. Indeed, let χ : [0,1] → [0,1] be a monotone smooth (C∞) function, such that χ(0) = 0,χ(1) = 1 andχ(k)(0) =χ(k)(1) = 0 for allk ∈N. Then consider a curve parametrized by the function
ξ(τ, x, ) =x+χ(τ)G(x) (2.14)
with τ ∈ [0,1]. This curve connects the points x and F(x) = x+G(x). Consider the
map Φτ : x7→ ξ(τ, x, ). This map is -close to the identity in the C1 topology and, hence, a local diffeomorphism by the inverse function theorem. Let Ψτ
= (Φτ) −1
and consider a non-autonomous vector field
Y(τ, x, ) = χ0(τ)G(Ψτ(x)) (2.15)
originally defined for τ ∈[0,1] and extended periodically as a function ofτ. It is easy to see that Y is smooth.
Note that in this construction solutions of the differential equations (2.13) are given explicitly for τ ∈ [0,1]. These solutions extend recursively to other values of τ using the identity ξ(τ, x, ) = ξ(τ −1, F(x), ). Since the function χ is flat at τ = 0 and τ = 1, the
function ξ is smooth in time as long as the solution remains in D. It is also possible to use the flow Φτ
(x) = Fχ(τ)(x) instead of (2.14) in the construction of the suspension.
A suspension of F is not unique and we are interested in finding a suspension which is
as close to an autonomous vector field as possible. This task can be performed with the help of averaging [2]. An averaging step consists of a substitution of the form
ξ=ξ1+S(τ, ξ1, ) (2.16)
where the functionS is periodic inτ. Substituting (2.16) into the differential equation (2.13) we get
(1 +∂ξS)∂τξ1+∂τS =Y(τ, ξ1+S, ) (2.17)
where S is evaluated at (τ, ξ1, ). Let hYi= R1
0 Y dτ be the mean value of Y over its period inτ, and ˜Y =Y − hYi be its oscillatory part with zero mean. It is convenient to let
S(τ, ξ, ) =
Z τ
0 ˜
Y(t, ξ, )dt.
This function is periodic in τ and S(k, ξ, ) = 0 for every k ∈ Z. Then the map ξ1 7→ ξ is
-close to the identity for everyτ and is exactly the identity forτ ∈Z. Therefore, the change of variables (2.16) transforms Y into another suspension of the same map F. Multiplying
the equation (2.17) by the matrix (1 +∂ξS)−1, we write the new suspension in the form
∂τξ1 =Y1(τ, ξ1, ),
where
Y1(τ, ξ1, ) = (1 +∂ξS)−1 Y(τ, ξ1+S, )−Y˜(τ, ξ1, )
.
Taking into account that S =O(), the definition of ˜Y and differentiability of Y and S, we can check that the oscillatory part of Y1 vanishes at the leading order, i.e., kY˜1k=O(kY˜k). The averaging procedure can be repeated to further decrease the time-dependent part of the suspension. Note that the expression for the vector field Y1 contains a first derivative with respect to the space variable, thus if Y ∈ Ck then we can claim that Y
1 ∈ Ck−1 only and the maximum number of averaging steps is bounded by the smoothness class of Y. If Y is infinitely differentiable, the time-dependent part of the suspension vector field can be made smaller than any power of || by repeating the averaging procedure multiple times: after n
steps we obtain a suspension of the form
Yn(τ, x, ) =An(x, ) +nBn(τ, x, ). (2.18)
Neishtadt [10] proved that if Y is analytic in a complex neighbourhood of D then after
exponentially small compared to ||. I.e., if F is a family of maps analytic in a complex
neighbourhood of D, then there is a suspension vector field defined on D such that
Y(τ, x, ) = A(x, ) +B(τ, x, ), (2.19)
with B =O(exp(−c/||)) for some c >0.
2.4
Suspensions of a map and interpolating vector fields
Although the averaging is an effective tool for studying near identity maps, it is not usually possible to find an explicit expression for the vector fields Yn.
Theorem 2.10. Let F : D → Rm be a smooth family of near identity maps defined on a
domain D⊂Rm with m≥1 and let n∈
N. If a suspension of F can be written in the form
Y(t, x, ) =An(x, ) +2nBn(t, x, ) (2.20)
where the C2n norms of A
n and Bn are bounded uniformly with respect , then for every
compact D0 ⊂D there is a constant Cn such that
sup
x∈D
|An(x, )−Xn(x, )| ≤Cn2n
where Xn is the interpolating vector field for the map F.
Proof. Since D0 is compact, there is 0 >0 such that every solution of
∂τξ(τ, x, ) =Y(τ, ξ(τ, x, ), ), ξ(0, x, ) =x (2.21)
with initial condition x ∈ D0 remains inside D for |τ| ≤ n and || ≤ 0. Since Y is a suspension of F, we have Fk(x) = ξ(k, x, ) for |k| ≤ n. Repeatedly differentiating the
equation (2.21) with respect to τ and taking into account the form ofY, we see that there is a constant C such that
∂τkξ(τ, x, )
≤C||k
for k≤2n+ 1. Then the theorem follows from the Lemma 2.2 with γ(t) = ξ(−1t, x, ). This theorem has several important corollaries. The first one states that the time-shift along trajectories of the interpolating vector field approximates F.
Corollary 2.11. If F ∈ C2n+1 and D0 is a compact subset of D then on this subset the interpolating vector field is uniformly bounded for ||< 0 and
F(x) = ΦXn(x) +O(
2n+1)
If F is analytic in a complex neighbourhood of D0, then we can choose n ∼ ||−1 in order to obtain a vector field which interpolates F with an error exponentially small in
. To prove this, let Y be the suspension of F given by (2.19). So its non-autonomous
part B is exponentially small in . Suppose that a solution of the autonomous equation
∂tη(t, x, ) = A(η, ) with η(0, x, ) = x ∈ D0 is analytic in time for |t| < 3r because
it remains inside the domain of the vector field A for these values of t. Then the Cauchy estimate implies that|∂tk+1η| ≤k!r−kkAkfor|t| ≤r. Let ˜X
n(x, ) be the interpolating vector
field for the time- map of the flow of A. Applying Lemma 2.2 to the curveγ(t) =η(t, x, ), we obtain that forn||< r
A(x, )− ˜
Xn(x, )
≤
2n(n!)2 2n+ 1 r
−2nkAk.
Then Stirling’s formula implies
A(x, )− ˜
Xn(x, )
≤
n
re
2n 4πn
2n+ 1kAk.
Since B is small, the time-t map of A is close to the time-t map of Y. In particular, Lemma 2.3 implies that
Xn(x, )− ˜
Xn(x, )
≤Hn|| −1
CAkBk.
whereCA>0 is a suitable constant so thatCAkBkbounds the distance between the solutions
of the initial value problems related to the vector fieldsAandY for|t| ≤r. Using the triangle inequality we get
|A(x, )−Xn(x, )| ≤
n
re
2n 4πn
2n+ 1kAk+Hn||
−1
CAkBk.
Since B =O(e−c/||) for a suitable c >0 it follows that, taking n= [r/||], one obtains
|A(x, )−Xn(x, )| ≤2πkAke−r/||+||−1log||−1Ce−c/||.
Thus for this n=n() the vector field Xn interpolates the map with an error exponentially
small in.
2.5
Adiabatic invariants of a symplectic map
Let m = 2d and ω be a symplectic form on R2d. We will mainly consider the standard
symplectic form
ω =
d
X
i=1
dxi∧dxi+d.
A map is called symplectic if it preserves ω. Even when F is symplectic, the corresponding
not necessarily Hamiltonian. Therefore there is no reason to expect thatXn has an integral.
Nevertheless, Xn is very close to a symplectic one and can be used to define an adiabatic
invariant – a function which is approximately preserved on time scales much longer than||−1. In order to construct the adiabatic invariant, we consider a differential one-form νn =
ω(Xn,·). In the case of the standard symplectic form
νn =
d
X
i=1
Xnidxi+d−Xni+ddxi
, (2.22)
where Xi
n denotes a component of the vector Xn. Then we fix a base point xb ∈D and, for
every x∈D, consider an integral
hn(x, ) =
Z
γ(xb,x)
νn (2.23)
where γ(xb, x) is a curve which connects the base point xb and x. If the form νn is closed
and the domain D is simply connected, this integral does not depend on the choice of the path (yet it depends on the choice of xb) and uniquely defines the function hn:D→Rsuch
that dhn =νn.
In general, the form νn is not necessarily closed and the integral may depend on the
choice of the path. In order to obtain a well-defined function we choose a rule for selecting
γ(xb, x). For example, if the domainDis star-shaped (e.g. convex), thenγ can be a straight
segment connecting its end points. Another convenient choice is a path which consists of straight segments parallel to coordinate axes.
In contrast with the interpolating vector fields, a suspension vector field (2.20) for sym-plectic map can be chosen (locally) Hamiltonian [10,7].
Proposition 2.12. Let F be a smooth family of near identity symplectic maps defined on
a domain D ⊂ R2d with d ≥ 1 and let n ∈
N. Let C > 0 be a constant and γ(xb, x) be
piecewise smooth paths such that |γ(xb, x)| ≤ C|x−xb| for every x∈D. If a suspension of
F can be written in the form of a Hamiltonian vector field with a Hamiltonian function
h(t, x, ) =han(x, ) +2nhbn(t, x, )
where the C2n+1 norms of ha
n andhbn are bounded uniformly with respect and han(xb, ) = 0,
then for every compact D0 ⊂D there is a constant Cn such that
sup
x∈D0
|hn(x, )−hna(x, )| ≤Cn2n
where hn is defined by (2.23).
Proof. Let the pathγ(xb, x) be parametrized by a functionγ(t, xb, x) witht∈[0,1],γ(0, xb, x) =
xb and γ(1, xb, x) =x. Then (2.23) takes the form
hn(x, ) =
Z 1
0
ω Xn(γ(t, xb, x), ), ∂tγ(t, xb, x)
LetAn be the Hamiltonian vector field defined by the Hamiltonian function han. Then
han(x, ) = Z 1
0
ω An(γ(t, xb, x), ), ∂tγ(t, xb, x)
dt.
Using the bi-linearity of the symplectic formω, we obtain
hn(x, )−han(x, ) =
Z 1
0
ω Xn(γ(t, xb, x), )−An(γ(t, xb, x), ), ∂tγ(t, xb, x)
dt.
Since |ω(v1, v2)| ≤ Cω|v1| |v2| for any two vectors v1, v2 (e.g. Cω = 1 for the standard
symplectic form), we get
|hn(x, )−han(x, )| ≤Cω sup
˜
x∈γ(xb,x)
Xn(˜x, )−An(˜x, )
|γ(xb, x)|.
The proposition follows directly from Theorem 2.10.
Corollary 2.13. For any compact D0 ⊂D and ∀x∈D0, one has
hn(F(x), )−hn(x, ) =O(2n).
Proof. Since F−ΦAn =O(
2n+1), we get
hn(F(x), ) = han(F(x), ) +O(2n) = han(ΦAn(x), ) +O(
2n).
The flow ofAn preserves han, in particularhna(ΦAn(x), ) =h a
n(x, ), and the desired estimate
follows.
This corollary implies that hn is an adiabatic invariant of the map F, as it is
approxi-mately preserved for −2n iterations of the map, provided the corresponding segment of the trajectory remains inside D. We expect that in the case of an analytic map, the adiabatic invariant hn() is preserved over exponentially long times where n()∼ ||−1.
We note that the functionhncan be as smooth as the interpolating vector field (provided
the paths γ(xb, x) are chosen appropriately). If the domainD is not simply-connected, the
functionhn can become multivalued if it does not return to the original value when xmakes
a round along a closed non-contractible loop.
3
Numerical study of dynamics using interpolating
vec-tor fields
3.1
Two-dimensional area-preserving maps: the Chirikov
stan-dard map
Our first example is the Chirikov standard map [4] written in the form
whereis a real parameter. We consider this map on the cylinderS1×
R. On every bounded subset of the cylinder, the map (3.1) is close to identity provided || is small enough.
In our first numerical experiment we take = 0.1, n = 5 and study the interpolating vector fieldXn defined by equation (1.2). We choose some initial conditions on the cylinder
and compare their iterates under the original mapM with the iterates under the time-map
ΦXn corresponding to the interpolating vector fieldXn. Fig. 2shows the first 103 iterates for
200 initial conditions. Both pictures use the same set of initial conditions. The interpolating vector field is integrated up toτ = 103 with the help of a Runge-Kutta-Felberg 7-8 integrator with variable step size (RK78). There is no visually perceptible difference between the two images.
-3 -2 -1 0 1 2 3
-3 -2 -1 0 1 2 3
-3 -2 -1 0 1 2 3
[image:18.612.99.520.227.434.2]-3 -2 -1 0 1 2 3
Figure 2: Iterates of the standard mapM (left) and of the time-map ΦXn associated to the
interpolating vector field (with n = 5) (right). In both cases = 0.1. No visual differences are detected in the plots.
In order to quantitatively describe the difference between the map and its interpolating flow, we consider interpolating vector fields Xn for n = 5,10,15 and 20. Fig. 3 shows level
plots of |ΦXn(x0)−M(x0)| computed for 5×10⁵ initial conditions selected on a uniform
mesh in [−π, π]×[−2π,2π]. We clearly see that the error vanishes at the fixed points of the map and that the error decreases as n increases. Of course, the interpolation error will eventually grow with n due to Runge oscillations in interpolation.
Remark 3.1. For the standard map (3.1), the interpolating flow Xn, for any n, defines
a one degree of freedom Hamiltonian system (with a non-standard symplectic form). This follows from the fact that the map is reversible, hence so is the interpolating vector field, see Proposition 2.11. The reversibility of Xn forces the phase space to be foliated by periodic
2--6 -4 -2 0 2 4 6
-3 -2 -1 0 1 2 3
-16 -14 -12 -10 -8 -6 -4 -6 -4 -2 0 2 4 6
-3 -2 -1 0 1 2 3
-16 -15 -14 -13 -12 -11 -10 -9 -8
n= 5 n = 10
-6 -4 -2 0 2 4 6
-3 -2 -1 0 1 2 3
-16 -15 -14 -13 -12 -11 -10 -9 -8 -6 -4 -2 0 2 4 6
-3 -2 -1 0 1 2 3
-16 -15 -14 -13 -12 -11 -10 -9 -8
[image:19.612.101.516.69.405.2]n = 15 n= 20
Figure 3: = 0.1. Level plots of log10|ΦXn(x0)−M(x0)| for x0 ∈ [−π, π]×[−2π,2π], and four different values of n.
dimensional system having a foliation of periodic orbits is Hamiltonian (possibly with a non-standard symplectic form).
To visually inspect the differences between the orbits for the map and the interpolating flow, we increase the parameter up to = 0.5 and show the results in Fig. 4. The left plots represent the iterates of the standard mapM, while the right ones correspond to the time-
map ΦXn for n = 10. We recall that Xn defines an integrable vector field, see Remark 3.1.
The bottom raw of Fig.4shows magnifications of a part of the pictures from the top row: we can clearly see the differences between the phase portraits when magnifying a strip located near a chain of resonant islands of the map.
To study the adiabatic invariants defined by the equation (2.23), we fix a base point
xb ∈ R2d (d = 1 in this section but we will also use d = 2 later) and consider paths
-3 -2 -1 0 1 2 3
-3 -2 -1 0 1 2 3
-3 -2 -1 0 1 2 3
-3 -2 -1 0 1 2 3
2.8 3 3.2 3.4 3.6
-3 -2 -1 0 1 2 3
2.8 3 3.2 3.4 3.6
[image:20.612.120.492.74.423.2]-3 -2 -1 0 1 2 3
Figure 4: = 0.5. Left: Iterates of the standard map M. Right: Iterates of the time- map
ΦXn (with n = 10) associated to the interpolating vector field.
integral (2.23) takes the form
hn(x, ) =
Z 1
0
d
X
i=1
Xni(γ(s, x0, x), )vi+d−Xni+d(γ(s, x0, x), )vi
ds (3.2)
wherevi are components of the vectorv. In numerical experiments, we evaluate this integral
using a trapezoidal rule combined with the Romberg extrapolation scheme. We accept a numerical estimate of the integral value if the difference between two consecutive approxi-mations of the Romberg scheme is less than 10−8. We use this rule to evaluate the adiabatic invariants in all examples presented in the paper unless otherwise stated. In principle, this method can be used to achieve higher precision, however for the visualization purposes higher precision is not needed.
for every point compute ∆hn(x0) = |hn(M(x0), )−hn(x0, )| and use the corresponding maximum value to estimate the supremum norm k∆hnk. The point xb = (0,0) is used as a
base point in computations of hn.
-9 -8 -7 -6 -5 -4 -3 -2 -1 0
-2 -1.8 -1.6 -1.4 -1.2 -1 -0.8 -0.6 -0.4
n= 1
n= 2
n= 20
-12 -10 -8 -6 -4 -2 0
5 10 15 20 25
ǫ= 0.1 ǫ= 0.2
ǫ= 0.3
ǫ= 0.4 ǫ= 0.5
[image:21.612.88.526.130.292.2](a) (b)
Figure 5: Plots of log10k∆hnk: (a) as a function of log10 for 1 ≤ n ≤ 20, and (b) as a function of n for = 0.1(0.1)0.5.
Fig. 5(a) shows plots ofk∆hnkas a function of log10for every 1≤n ≤20. Each line of the plot corresponds to a fixed value ofn and is obtained by joining 50 points with different values of ∈ [0,1/2]. In this plot n = 1 corresponds to the largest values of k∆hnk. This
plot confirms that the upper bound of Corollary 2.13 is not too far from being optimal as the lines on the plot are approximately linear with the slope about 2n+ 1 (till they reach the levelled floor located just below 10−8, which is determined by our choice of the accuracy in evaluation ofhn). For≈0.15 the values ofk∆hnkare monotone decreasing for 1≤n ≤20.
On the other hand, we see that k∆hnk is not necessarily monotone in n for larger values of
as the lines have intersection. Moreover, the plot indicates that for a fixed the value of
k∆hnkcannot be moved below a certain threshold by increasing the value ofn(see Fig5(b)).
Therefore for a fixed we can find an optimal value ofn which corresponds to a point after which the adiabatic invariant is not improved when n is increased. The existence of this threshold can be attributed to the non-integrability of the map M. A similar phenomena
are observed in the study of optimal truncation of asymptotic series.
Finally, we note that the methods of this section can be used to study some maps which are not a priori near identity but have an iterate which is near identity on some subset of the phase space. In particular, this situation can arise in a study of a near integrable system near a multiple resonance. For example, if is not small, the map M is no longer close
to identity. Nevertheless, in a neighbourhood of a q-periodic point, the map Mq becomes close to identity. Let us illustrate how the interpolating vector field can be adapted to study the dynamics near a q-resonant chain of islands. Let = 0.5. We established (see Fig. 4) that the interpolating vector field provides an accurate approximation of the dynamics ofM
approximation. We take initial points with x = π and iterate them. Comparing Fig 6 (a) and (b) which represent the dynamics ofM and the interpolating vector fieldXn forn = 5,
respectively, we see that the interpolating vector field does not correctly capture the dynamics around the 2-periodic chain of islands. On the other hand, in this part of the phase space the dynamics ofM2
is sufficiently close to identity so that the interpolating vector fieldX2,n,
computed from iterates of M2, provides a good approximation of the dynamics as can be seen in Fig 6(c). Note, that only one of the two islands can be seen due to the choice of initial conditions.
4.5 5 5.5 6 6.5 7 7.5 8
0 1 2 3 4 5 6 4.5
5 5.5 6 6.5 7 7.5 8
0 1 2 3 4 5 6 4.5
5 5.5 6 6.5 7 7.5 8
0 1 2 3 4 5 6
[image:22.612.76.542.195.323.2](a) (b) (c)
Figure 6: = 0.5. Initial points taken on x = π, n = 5. (a) Iterates of the standard map
M, (b) Iterates of ΦXn, and (c) Iterates of the map Φ
X2,n associated with the interpolating
vector field for M2
.
Fig. 7 shows similar results for q = 3. Here we take initial points with x = 0, hence only one of the 3-periodic islands appears in the picture. The interpolating vector field X3
n
computed for M3
accurately describes the dynamics in a narrow zone around the resonant
3-periodic island. Note that the 5-periodic island observed in Fig. 7(a) is not present in Fig. 7(b).
3.2
Exploring higher dimensional phase spaces: Poincar´
e sections
for maps
If the dimension of the phase space m ≥ 3, the visualization of the dynamics becomes more difficult. In the case of a system with continuous time, a Poincar´e section provides a convenient tool to reduce the dimension: a trajectory is represented by its intersections with a codimension one surface. In the case of discrete time, the reduction of the dimension cannot be performed in a similar way. A typical solution to this problem is either to plot a projection of the trajectory on a subset of lower dimension, or to use the method of slices [12], i.e. to plot only a part of the trajectory which consists of points from a narrow strip near a codimension one surface (called a slice). In the last case, the points are also projected on the surface to reduce the dimension.
2 2.5 3 3.5 4 4.5 5 5.5
-3 -2 -1 0 1 2 3
2 2.5 3 3.5 4 4.5 5 5.5
-3 -2 -1 0 1 2 3
[image:23.612.99.521.70.237.2](a) (b)
Figure 7: = 0.5. Initial points taken on x = 0, n = 5. (a) Iterates of the standard map, and (b) iterates of Φ
X3,n associated to the interpolating vector field for M
3
.
function such that its zero set Σ = {x ∈ Rm : g(x) = 0} is a smooth hyper-surface of
codimension one. Taking an initial condition x0 ∈D we compute the points xk+1 =F(xk)
recursively. The surface Σ locally divides the space. So we can look for consecutive points of the trajectory which are separated by Σ, i.e.,
g(xk)g(xk+1)≤0. (3.3)
Suppose that the limit vector field G0 is transversal to Σ (at least in a neighbourhood of the intersection of Σ with the straight segment with endpoints at xk and xk+1). Then, for small enough, there is a unique tk ∈[0, ] such thatg(ΦtXkn(xk)) = 0, and we plot the point
yk = ΦtXkn(xk) (3.4)
instead of xk. Obviously, yk ∈ Σ and the trajectory is represented on a manifold of lower
dimension. The pointykisO() close toxk and the error does not accumulate whenkgrows
as the construction ofyk does not affect the computation of the trajectory (xk)k≥0.
3.3
Three-dimensional volume-preserving maps
Our next example is the 3-dimensional volume preserving map
Gε :
x y z
7→
¯
x
¯
y
¯
z
=
x+y
y+ ¯z
z−ε−2.4y+x2+xy/2 +y2/2
(3.5)
invariant curve with rotation number that increases with ε and ranges in (0.2821,0.2853). The invariant curve is located at the centre of a “bubble of stability” which has a topological structure that resembles discrete spherical Hill’s vortex with the rotational symmetry axis located near the x-axis. This suggests to use Σ =
z = 0 as a transversal section. Here, we illustrate how to use the interpolating vector field to visualize the dynamics in Σ and compare the results with the method of slices. In all examples below, we use interpolating vector fields with n= 5.
We note that the rotation number of the elliptic invariant curve is relatively close to 2/7 = 0.2857. . . for the specified values of ε. This implies that G7ε is close to the identity in a neighbourhood of the curve. Note that the parameter ε does not measure the distance fromG7
ε to the identity.
First we take ε = 10−2. We consider 17 initial points (0,10−2j,0), 0 ≤ j ≤ 16 (for initial conditions of this form with y ≥ 0.17 the corresponding orbits are not bounded). Fig. 8 (a) shows a representation of the dynamics with the help of the method of slices: each initial condition is iterated 107 times and a projection on Σ is plotted for every iterate which is within the slice |z| ≤ 10−4. Note that the large number of iterates is needed as only a small fraction of points lands inside the thin slice. A thicker slice would require less iterates but some details of the picture would not be visible as the projection along thez-axis does not take into account the dynamics of the map. Compare this picture with Fig. 8 (b) which is obtained with the help of the interpolating vector field: every initial condition is iterated 5×10³ times under G7
0.01 and, each time the trajectory crosses Σ, we project the corresponding iterate onto Σ along the interpolating vector field as explained in Section 3.2. Apparently, we obtain a comparable resolution of dynamics using each of the methodologies. Note that the number of iterates of G0.01 needed for the method based on the interpolation vector field is smaller by more than two orders of magnitude as every passage near Σ is used to generate a point on the plot.
Next we consider ε = 0.128. We note that at ε = ε1/4, where 0.12 ≤ ε1/4 ≤ 0.122, the elliptic invariant curve crosses the (4,−4,1) resonance, see [5] for further details. Accordingly, for the value ε = 0.128 one expects to observe a related 4-periodic structure. We choose (0,0.41+0.005j,0), 0≤j ≤30, as initial conditions, and again we compare the results of the method of slices with the method based on the interpolating vector fields. For the method of slices we perform 108 iterates of each condition and we display those with |z| ≤ 10−4. For the computation of the Poincar´e iterates using the interpolating vector field, we perform 103 iterates of G280.128 and display the projections onto Σ at every crossing. The results are shown in Fig. 9 first row. We can identify clearly the 4-periodic structure in both pictures. The fact that the secondary periodic structures around this main 4-periodic one are not well-described is due to the fact that the map G280.128 is not close enough to the identity in that region.
-0.2 -0.1 0 0.1 0.2
-0.1 0 0.1
-0.2 -0.1 0 0.1 0.2
-0.1 0 0.1
[image:25.612.116.501.67.218.2](a) (b)
Figure 8: Both plots correspond to iterates of the same 17 initial conditions. (a) Method of slices: N = 107 iterates ofG
0.01are computed and we show orthogonal projections of iterates with |z| ≤ 10−4. (b) Method of interpolating vector fields: N = 5×10³ iterates of G7
0.01 are computed, we show the projections onto Σ every time when Σ separates two consecutive iterates.
consider the map G21
0.252 which is considered globally as a near identity map. The obtained visualizations of the dynamics are shown in Fig. 9second row.
Those visualizations show that most of the details in the whole stability domain of Gε
can be detected, with a reasonable resolution, from a relativelly small number of iterates of some initial conditions using the interpolating vector field to project onto Σ.
3.4
Four-dimensional symplectic maps: the Froechl´
e-like map
We apply the construction of the previous section to a 4-dimensional symplectic map and show that the method reveals interesting details of the dynamics. We consider the Froechl´ e-like map
T :
ψ1 ψ2 J1 J2 7→ ¯ ψ1 ¯ ψ2 ¯ J1 ¯ J2 =
ψ1+(a1J¯1+a2J¯2)
ψ2+(a2J¯1+a3J¯2)
J1−sin(ψ1)
J2−ηsin(ψ2)
, (3.6)
where a1, a2, a3, η, are real parameters. The map T is a symplectic diffeomorphism of the
cylinder M = T2 ×R2. It was introduced in [8] to model the dynamics near a double resonance in a near-integrable Hamiltonian system with three degrees of freedom. In our numerical experiments we use
a1 = 1, a2 = 1/2, a3 = 5/4, η= 1/2. (3.7)
0.2 0.4 0.6
-0.15 0 0.15
0.2 0.4 0.6
-0.15 0 0.15
0.45 0.55 0.65
-0.06 -0.03 0 0.03
0.45 0.55 0.65
[image:26.612.124.494.182.459.2]-0.06 -0.03 0 0.03
Figure 9: The plots in the left column are obtained by the method of slices, the plots in the right column are obtained with the help of interpolating vector fields. Left: We perform
N = 108 iterates of each initial condition under G0.128 (first row) and under G0.252 (second row). We show orthogonal projections of those iterates which are within the slice|z| ≤10−4. Right: We perform N = 104 iterates of each initial condition under G28
A Poincar´e section for T
Since the map (3.6) is symplectic, its limit flow is Hamiltonian. It is easy to find the corresponding Hamiltonian function explicitly:
h0(ψ1, ψ2, J1, J2) =a1
J12
2 +a2J1J2+a3
J22
2 −cos(ψ1)−ηcos(ψ2). (3.8) This Hamiltonian defines a non-integrable Hamiltonian system with two degrees of freedom. The Hamiltonianh0 has four critical points which coincide with the fixed points ofT. Levels
of constant energy,M0
E ={x:h0(x) = E}, are smooth hyper-surfaces for every regular value of h0. It is natural to study the dynamics of the limit system restricted on each energy level separately as the Hamiltonian function h0 remains constant along trajectories of the limit flow. Let Σ be the 3-dimensional hyper-surface defined by the equality ψ1 =ψ2. Note that we do not call Σ a “hyper-plane” because we treatψ1 andψ2 as angular variables. The limit vector field is transversal to Σ except for points which satisfy the equation (a1 −a2)J1 = (a3−a2)J2 where the vector field is tangent to Σ.
The intersection Σ0
E = Σ∩ME0 defines a Poincar´e section for the limit flow. Outside
a neighbourhood of the tangencies, the first return map of the limit flow defines an area-preserving map on Σ0
E. The dynamics of the limit Hamiltonian system are described by
a collection of the Poincar´e sections for different values of E. Since the quadratic form
a1
J2 1
2 +a2J1J2 +a3
J2 2
2 is positive definite, M 0
E is diffeomorphic to a three dimensional torus
T3 for every E > h0(p4) = 1 +η. Then Σ0E is diffeomorphic to a two dimensional torus T2.
It is convenient to use ψ =ψ1 =ψ2 and φ= arg(J1+iJ2) as coordinates on Σ0E.
In contrast to the limit flow, the map T does not have a first integral. Moreover, even
if x0 ∈ Σ, it is unlikely that xk = Tk(x) will ever come back to Σ (periodic points of T
are obvious exceptions) so the direct implementation of the Poincar´e section is not possible. In order to visualise a trajectory xk = Tk(x0) we implement the procedure explained in Section 3.2. The procedure consists in finding a subsequence kj such that the trajectory
jumps over Σ between xkj and xkj+1. We note that Σ does not divide the cylinder M into
two subsets globally but, since the mapTis near identity, we can check this condition locally.
Since Σ is defined by the equality ψ1 = ψ2, we look for kj such that (ψ kj
1 −ψ
kj
2 )(ψ
kj+1
1 −
ψkj+1
2 ) < 0, where xk = (ψk1, ψ2k, J1k, J2k) denotes the k-th iterate of x0 ∈ T2 ×R2. Then a point ykj ∈ Σ is defined by projecting xkj to Σ along the interpolating vector field Xn as
defined by the equation (3.4).
Since the section Σ is three dimensional, the sequence ykj can be plotted and used to
visually inspect the behaviour of the trajectoryxk.
On a moderate time scale, a further reduction of the dimension can be achieved by noting thathn(defined by the equation (3.2)) is an adiabatic invariant of the map, so the trajectory
xk stays in a small neighbourhood of the set MEn ={x :hn(x, ) =E} where E =hn(x0, ). Since MEn is close to ME0 and the latter is nicely described by the coordinates (ψ, φ), we can project the points ykj on the torus of coordinates (ψ, φ). In this way a trajectory of a
We remark that this procedure relies on the closeness of the map to the identity. Similar to the standard map, acceptable values of depend on the values of the variablesJ1 andJ2. In our numerical experiments we use || ≤0.5, so in practical terms the parameter does not need to be very small.
Visualization of the dynamics of T
Examples of visualization of dynamics for T are shown on Fig. 1 and 10. Some comments
concerning the implementation can help the reader. First, the computation of the pointsykj
on Σ requires integration ofXn which is performed using a RK78 method that only requires
evaluating the vector field. The timetk in (3.4) is then computed using the Newton method
in a way similar to [13].
Second, to show different trajectories on a single 2-dimensional torus we select initial conditions on ΣnE = Σ∩MEn for a fixed E. To find initial conditions with the same value of E, we use the following procedure: we select values of ψ = 0,1,2,3 and, for each value, we compute a point p= (ψ, ψ,0, J20), with J20 >0, such that hn(p, ) = E (using a bisection
method with respect to J2 to get a zero of hn(p, )−E). Since ∇hn is orthogonal to the
vector (0,0,−∂hn/∂J2, ∂hn/∂J1), we numerically integrate the auxiliary vector field
˙
J1 =−
∂hn
∂J2
, J˙2 =
∂hn
∂J1
, (3.9)
with initial condition (J1(0), J2(0)) = (0, J2) (using a RK78 method). One obtains points
x0,i = (ψ, ψ, J1(ti), J2(ti)) ∈ ΣnE for a sequence of ti provided by the integration method.
Finally, we usex0,i as initial conditions for the mapT.
Fig.10shows 500 projected iteratesykj, as defined by (3.4), obtained from the iteratesxkj
under the map T for each of around 400 different initial conditions. The parameters of the
map are defined by (3.7) and = 0.2. The hyperbolic-hyperbolic fixed point p4 is used as a base pointxb in the definition of the adiabatic invariant and the initial conditions are chosen
on Mn
E with n = 10 and E = 1. We see that all points are located near a 2-dimensional
torus embedded in the 3-dimensional surface Σ. The projection of the trajectories onto the coordinates (ψ, φ) resembles the dynamics of an area-preserving map.
Fig. 11(a) shows iterates of the point (ψ1, ψ2, J1, J2) = (3,3,−1.043523,1.385456) that belongs to Σn
E with E = 1. This is one of the chaotic orbits which can be seen in Fig. 10.
Fig. 11(b) shows a plot of the adiabatic invariant as a function of time along this orbit. For better visualization we show the value of the adiabatic invariant for one out of every 250 consecutive iterates of the point under T. Some important observations follow from this
plot:
• The orbit we study apparently belongs to a chaotic zone and is not located on a KAM torus.
(a)
1.2
0
φ
ψ
π
π
−
π
[image:29.612.72.539.83.603.2](b) (c)
Figure 10: Trajectories of T with the parameters defined by (3.7) and = 0.2, E = 1,
n = 10. (a) 500 projections ykj are plotted for each of 400 initial conditions taken on
Σ∩Mn
E, (b) projection of the points of (a) onto the torus with coordinates (ψ, φ), where
1 1.5 2 2.5 3 3.5
-3 -2 -1 0 1 2 3
-4e-05 0 4e-05
0 5e5 1e6
(a) (b)
-4e-05 0 4e-05
0 5e9 1e10
0 0.05 0.1 0.15 0.2 0.25 0.3
-4e-05 -2e-05 0 2e-05 4e-05
[image:30.612.90.525.143.490.2](c) (d)
Figure 11: A single trajectory of the map T with = 0.2 for the initial point located
at (3,3,−1.043523,1.385456). (a) Points on the Poincar´e section are represented using co-ordinates ψ1 (= ψ2) and φ = arg(J1 +iJ2) ∈ (−π, π]; we show only one out of every ten consecutive points on the Poincar´e section. (b) The adiabatic invariant hn as a function of
at least for 1010 iterates of T
. The dynamical interpretation of such preservation is
clear: our numerical method has detected the slowest variable of the system which evolves on a very long time scale. We note that in this example one expects to see an (Arnold like) diffusion process and, in particular, the slow variable requires exponen-tially long (with respect to −1) time to be changed by order one. Our method is able to detect such a slow variable in a simple and efficient way.
• There is no systematic drift of the adiabatic invariant. Its values are distributed in a Gaussian-like way around the initial value (see Fig. 11(d)). We remark that, for T
and the chosen parameters, there is numerical evidence supporting that the detection of the expected drift in the adiabatic invariant due to the Arnold diffusion process requires a much longer time scaling.
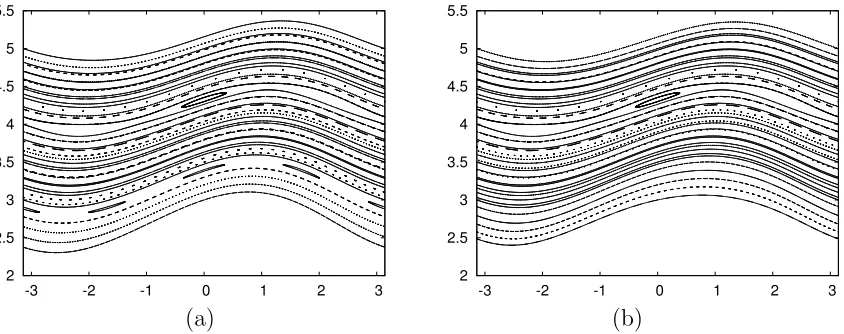
A final illustration of the amount of details one can visualize with this methodology is presented in Fig. 1. There we show a plot similar to the one in Fig. 10but for = 0.35 and
E = 4. As before, we take the hyperbolic-hyperbolic fixed pointp4 as a base point to define the adiabatic invariant. The interpolating vector field is constructed with n = 10. One can clearly recognize the typical structures that show up in a phase space of an area-preserving map: islands of stability (including secondary islands and satellites in the chaotic zone), invariant curves and chaotic zones. Yet this is not a 2-dimensional map: we are just plotting a suitable projection (along the solutions of the interpolating vector field) of the iterates of the 4-dimensional map!
4
Conclusions
It has been known for a long time that the combination of a time-periodic suspension with the averaging method can be used to construct an autonomous vector field which approximately interpolates a near identity map F. In this paper we show that an interpolating vector field
can be constructed directly from iterates of the map: Xn=Pnk=−npnkF k
where the weights
pnk are constant and independent of the map (see equation (1.3)). In this way the averaging
procedure is reduced to computing a weighted sum of the iterates of the map. Similarly to the classical averaging procedure, the parameter n controls the order of the interpolation error and by taking n∼−1 the error can be made exponentially small.
The simplicity of the expression for the interpolating vector field Xn makes it a useful
tool in numerical studies of the dynamics. In particular, projections along Xn can be used
to define a “Poincar´e section” for the map which help to visualise dynamics by reducing dimension of the pictures.
In the case of a symplectic F the interpolating vector fieldXn is close to a Hamiltonian
one and can be used to construct an adiabatic invariant of the map. We use the adiabatic invariant to achieve further reduction in the dimension and obtain two-dimensional pictures showing details of the dynamics for a four-dimensional Froeschl´e-like map.
We are confident that the interpolating vector fields can be useful in other analytical and numerical studies. In particular, we used them in a quantitative study of the Arnold diffusion and we will report on the corresponding results elsewhere. We expect that the projection along an interpolating vector field can be used in combination with the method of slices. Finally, the interpolating vector fields are potentially applicable to analysis of time series where the precise form of the map is not known.
5
Acknowledgments
AV has been supported by grants MTM2016-80117-P (MINECO/FEDER) (Spain) and 2014-SGR-1145 (Catalonia). VG’s research was supported by EPRC (grant EP/J003948/1). The authors are grateful to Ernest Fontich and Carles Sim´o for useful discussions and remarks.
References
[1] Benettin, G.; Giorgilli, A.; On the Hamiltonian interpolation of near-to-the identity symplectic mappings with application to symplectic integration algorithms, Journal of Statistical Physics (1994) vol. 74, issue 5-6, pp 1117–1143.
[2] Bogoliubov, N. N.; Mitropolsky, Y. A.; Asymptotic methods in the theory of non-linear oscillations. Gordon and Breach Science Publishers, New York 1961, 537 pp.
[3] Broer, H., Roussarie, R., and Sim´o, C.; Invariant circles in the Bogdanov-Takens diffeomorphisms. Ergod. Th. and Dynam. Sys., 16:1147 – 1172, 1996.
[4] Chirikov, B.V.; A universal instability of many-dimensional oscillator system. Phys. Rep., 52 (1979), 264–379.
[5] Dullin, H.R.; Meiss, J.D.; Quadratic Volume-Preserving Maps: Invariant Circles and Bifurcations. Siam J. Applied Dynamical Systems 8(1), 76–128.
[6] Efthymiopoulos, C.; Harsoula, M.; The speed of Arnold diffusion, Physica D vol.
251 issue 1 (2013) pp. 19–38.
[7] Gelfreich, V., Numerics and exponential smallness. In Handbook of dynamical sys-tems, Vol. 2, 265–312, North-Holland, Amsterdam, 2002.
[8] Gelfreich, V., Sim´o, C., and Vieiro A.; Dynamics of 4D symplectic maps near a double resonance, Physica D vol. 243 issue 1 (2013) pp. 92–110.
[10] Neishtadt, A.I.; The separation of motions in systems with rapidly rotating phase, J.Appl. Math. Mech., 48 (1984), 133–139.
[11] Nekhoroshev N.N.; An exponential estimate of the time of stability of nearly inte-grable Hamiltonian systems. Russian Mathematical Surveys, 32(6) (1977) 1–65.
[12] Richter M.; Lange S.; Bcker A.; Ketzmerick R.; Visualization and comparison of classical structures and quantum states of four-dimensional maps. Phys. Rev. E 89(2) (2014) 022902
[13] Sim´o, C.; On the Analytical and Numerical Approximation of Invariant Manifolds, Les M´ethodes Modernes de la Mec´anique C´eleste (Course given at Goutelas, France, 1989), D. Benest and C. Froeschl´e (eds.), pp. 285–329, Editions Frontires, Paris, 1990.
[14] Sim´o, C.;Analytic and numeric computations of exponentially small phenomena, In K. Gr¨oger B. Fiedler and J. Sprekels, editors, Proceedings EQUADIFF 99, Berlin, pages 967 – 976, 2000. World Scientific, Singapore.
[15] Stoer, J; Bulirsch, R.; Introduction to Numerical Analysis. Third edition. Texts in Applied Mathematics, 12. Springer-Verlag, New York, 2002. xvi+744 pp.


![Figure 3: ϵ = 0.1. Level plots of log10 |ΦϵXn(x0) − Mϵ(x0)| for x0 ∈ [−π, π] × [−2π, 2π], andfour different values of n.](https://thumb-us.123doks.com/thumbv2/123dok_us/9429165.448041/19.612.101.516.69.405/figure-level-plots-fxn-m-andfour-dierent-values.webp)


![Figure 10: Trajectories of Tϵ with the parameters defined by (3.7) and ϵ = 0.2, E = 1,n = 10.(a) 500 projections ykj are plotted for each of 400 initial conditions taken onΣ ∩ M nE, (b) projection of the points of (a) onto the torus with coordinates (ψ, φ), whereφ = arg(J1 + iJ2) ∈ (−π, π], (c) is a magnification from (b).](https://thumb-us.123doks.com/thumbv2/123dok_us/9429165.448041/29.612.72.539.83.603/trajectories-parameters-dened-projections-conditions-projection-coordinates-magnication.webp)
