O R I G I N A L A R T I C L E
A practical creep model for concrete elements
under eccentric compression
Haidong Huang.Reyes Garcia .Shan-Shan Huang .Maurizio Guadagnini . Kypros Pilakoutas
Received: 22 August 2019 / Accepted: 2 December 2019 / Published online: 10 December 2019
ÓThe Author(s) 2019
Abstract Many prestressed concrete bridges are reported to suffer from excessive vertical deflections and cracking during their service life. Creep softens the structure significantly, and therefore an accurate prediction of creep is necessary to determine long-term deflections in elements under eccentric axial compression such as prestressed concrete girders. This study proposes a modification to the creep damage model of Model Code 2010 to account for the effect of load eccentricity. The modified creep model considers damage due to differential drying shrinkage. Initially, the creep behaviour of small scale concrete specimens under eccentric compression load is investigated experimentally. Twelve small-scale concrete prisms
were subjected to eccentric axial loading to assess their shrinkage and creep behaviour. The main parameters investigated include the load eccentricity and exposure conditions. Based on the experimental results, an inverse analysis is conducted to determine the main parameters of the modified creep model. Subsequently, a numerical hygro-mechanical simula-tion is carried out to examine the effect of load eccentricity on the development of shrinkage and creep, and on the interaction between drying, damage and creep. The results indicate that eccentric loading leads to different tensile and compressive creep through the cross section, which contradicts the current design approach that assumes that tensile and compressive creep are identical. The proposed model also predicts accurately the long-term behaviour of tests on reinforced concrete elements available in the literature. This study contributes towards further understanding of the long-term behaviour of concrete structures, and towards the development of advanced creep models for the design/assessment of concrete structures.
Keywords Eccentric compressionNonlinear creepDrying-induced damageOne-way hydro-mechanical couplingAgeing effectsConcrete Electronic supplementary material The online version of
this article (https://doi.org/10.1617/s11527-019-1432-z) con-tains supplementary material, which is available to authorized users.
H. Huang
Department of Bridge Engineering, Chongqing Jiao Tong University, 66 Xuefu Street, Nan’an District,
Chongqing 400074, China
R. Garcia (&)
School of Engineering, The University of Warwick, Library Road, Coventry CV4 7AL, UK
e-mail: [email protected]
S.-S. HuangM. GuadagniniK. Pilakoutas Department of Civil and Structural Engineering, The University of Sheffield, Sir Frederick Mappin Building, Mappin Street, Sheffield S1 3JD, UK
1 Introduction
Due to their structural efficiency and cost-effective-ness, prestressed concrete (PC) box girders are exten-sively used in the construction of long-span bridges (100–300 m). The cross section of box girders is typically subjected to bending and eccentric compres-sion forces due to the opposite action of dead loads and prestressing forces. Eccentric compression forces can generate second order effects that affect the long-term behaviour of the structure. For instance, in recent years, many concrete box girder bridges have been reported to suffer from excessive mid-span deflections and cracking, which affect their safety and service-ability [1–3]. Whilst time-dependent vertical deflec-tions of bridges can be calculated using existing design guidelines, actual measured deflections usually exceed the calculations due to the inaccuracy of existing creep and shrinkage models [4–6].
Due to the technical and economic constraints in testing and analysing large PC box girders, creep behaviour is generally examined using simple beam or column elements. For instance, previous research has investigated the influence of second order effects [7,8] and material nonlinearity [9–11] on the creep behaviour of such elements. In these studies, the magnitude of tensile and compressive creep strains was assumed to be equal. Existing state-of-the-art design guidelines (e.g. Model Code 2010 (MC2010) [12]) also assume that the compressive and tensile creep are identical. However, recent experimental evidence indicates that the tensile creep strains can be between 2.4 and 8.9 larger than the compressive creep strains [13, 14]. The difference between tensile and compressive creep has been attributed to microcrack-ing and drymicrocrack-ing-induced microprestressmicrocrack-ing [15]. The force applied on a concrete element affects signifi-cantly the development of drying–induced microc-racking. For instance, compressive forces tend to close microcracks and inhibit further microcracking, whereas tensile forces promote the growth and widening of microcracks during the concrete drying process. The microprestress-solidification model [16] attributes the drying creep to microcracking and microprestressing effects. This model has been widely used in recent studies on creep [17–21] and expresses the rate of the stress-induced shrinkage as a function of the rate of internal humidity loss. An alternative creep-damage model was proposed based on concrete
damage [22,23], where nonlinear creep is accounted for using the interaction between the growth of creep strain and damage over time. However, such models neglect the influence of shrinkage and drying-induced microcracking, which always occur during the service life of structures.
To account directly for the effect of microcracking due to the non-uniform distribution of internal humidity, recent studies [24–28] have adopted a hygro-mechanical approach to assess creep in con-crete elements. This approach calculates the non-uniform development of stresses and the drying-induced cracks using a shrinkage coefficient that correlates the internal humidity and shrinkage defor-mations. Drying-induced creep is accounted for through a Kelvin-Voigt chain associated with an ageing dashpot [29–31]. Although this approach has proven effective at estimating creep in concrete elements, tests are necessary to obtain the input parameters. Moreover, the analysis is computationally demanding and thus difficult to implement in practice. On the other hand, the creep and shrinkage models included in current design codes (e.g. MC2010 [12] and ACI 209 [32]) do not take into account the interaction between drying, creep and damage explic-itly, which can lead to inaccurate and unsafe calcu-lations of long-term deformations of structures with drying-induced cracks. Consequently, a more robust and practical model is needed to assess the time-dependent behaviour of RC structures that considers the combined effect of (1) eccentric compression, and (2) ageing, drying and cracking effects.
This study proposes a modification to the creep damage model of Model Code 2010 to account for the effect of load eccentricity in concrete. The proposed model considers damage occurring during the creep process. Section 2 of this article presents an experi-mental programme on eccentrically loaded small-scale specimens (prisms) that assesses their tensile and compressive creep, as well as the interaction between drying-induced damage and creep strains. Subse-quently, Sect.3 proposes a new modelling approach that simulates the interaction between drying, creep and damage using a one-way hydro-mechanical cou-pling model. In Sect.4, the model proposed in Sect.3
concrete beams available in the literature. Concluding remarks of this study are given in Sect.5. The results of this study contribute towards developing a further understanding of the long-term behaviour of concrete structures, as well as towards the development of practical models to evaluate the serviceability of RC structures.
2 Experimental programme
2.1 Test specimens and material properties
To examine the effect of load eccentricity and drying of concrete over time, twelve 1009100 9450 mm concrete specimens (prisms) were tested. Specimens D1, D2, D3 and D4 were tested in concentric compression to obtain creep strains, whereas speci-mens W1, W2, W3 and W4 were tested in eccentric compression. Likewise, two specimens (DS1 and DS2) were used to measure drying shrinkage strains, whereas two specimens (BS1 and BS2) were epoxy coated on all faces to examine basic shrinkage without concrete drying effects.
The specimens were cast using one batch of normal-strength concrete typical of bridge construc-tion in China. Aw/cratio of 0.40 was used according to the following mix proportions (kg/m3): water 163, cement 410, sand 545, and gravel 1275. The 28-day mean concrete compressive strengthfcwas 54.5 MPa,
as obtained from concrete cubes tested according to the Chinese bridge design code JTG D62 [33]. All the specimens were moist-cured for 3 days after casting. After this, epoxy coating was applied onto the faces of specimens BS1 and BS2 to prevent drying, whereas DS1 and DS2 were fully exposed to the laboratory environment.
2.2 Test setup and instrumentation
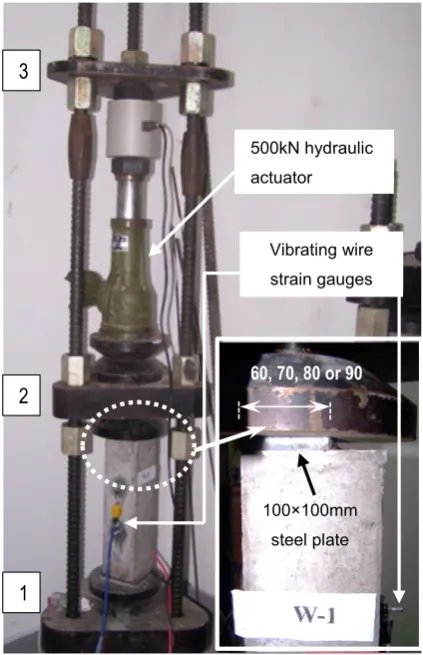
The specimens were tested in compression using the standardised test rig in ASTM C512 [34], but with some minor modifications. The self-reacting test rig consisted of three horizontal steel plates (1–3, as shown in Fig.1) and three vertical steel bars. The concrete specimens were placed between plates 1 and 2. The compressive load was applied using a hydraulic actuator of 500 kN capacity, which in turn reacted against plate3during the tests.
[image:3.547.286.498.58.386.2]small voids (\5 mm in size) existed between the 100 9100 mm steel plates and the specimens ends, epoxy padding material was added to fill in such voids. Spherical steel bearings at the top and bottom of the specimens (plates 1 and 2) allowed free end rotations of the samples. This ensured the application of vertical load with no bending moments during the tests. The loading on specimens D1–D4 and W1–W4 started on day 9 after casting (casting day = day 0). The applied vertical force was monitored and controlled by a pressure sensor in the hydraulic jack. All the speci-mens were kept in standard laboratory conditions at ambient temperatures of 20 ±2 °C and RH = 70% ±10% during testing. It should be noted that the authors tried to test a fifth specimen with an eccen-tricity of 25 mm, but the specimen failed suddenly after a few hours of testing due to excessive bending. The instantaneous strains due to the applied force on specimens D1–D4 and W1–W4 were recorded during the tests. Before applying the load, instanta-neous deformations were monitored using four vibrat-ing wire strain gauges, one fixed on every face of each specimen. Two temporary strain gauges installed on the direction perpendicular to the specimen’s flexion plane ensured that the loading was applied uniformly in this direction. During the initial loading process, all the measured strains were compared with the numer-ical results to adjust the applied bending moments and the position of the specimens in the perpendicular direction. The development of strain over time was measured with two vibrating wire strain gauges installed on two opposite faces of each specimen: P1 on the compression face, and P2 on the tension face. The gauges had a strain range of ±1500le and accuracy of 1le, which were sufficient for the expected strains. Measurements started on day 4 after casting, whereas creep data from D1–D4 and W1–W4 were recorded from day 10 onwards. The shrinkage and creep data were recorded for 321 days and 331 days, respectively.
2.3 Test results and discussion
Figure2a shows the measured drying shrinkage strains of specimens DS1 and DS2, as well as the basic shrinkage strain of specimens BS1 and BS2. The figure reports both the mean values and the standard deviations. Figure2b shows the development of the total strain (i.e. the sum of instantaneous, shrinkage
and creep strains) over time. The results in Fig. 2b show that the mean values of the instantaneous strains are-305leand-705 lefor axial loadsPof 100 and 250 kN, respectively. Figure2b also shows that, at the end of the tests, the shrinkage and creep strains for P= 250 kN is about 2.4 times that for P = 100 kN.
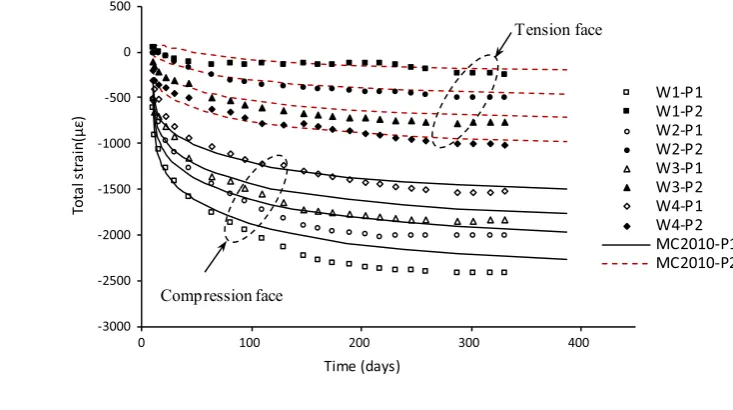
Figure3 compares the instantaneous strains recorded during the tests on specimens W1 to W4 and the results given by MC2010. The instantaneous strains on the compression face of the specimens ranged from-610le(W1) to-305le(W4), while the instantaneous strains ranged from 60le(W1) to -200 le(W4) on the tension face. The figure also shows that, as the load eccentricity increases, the differential strain between the compression and ten-sion faces increases from 516 to 2172leat day 331, thus confirming that the bending moment induces additional curvature deformations. A significant non-linear relationship between curvature deformation and eccentricity is also observed. For instance, as the eccentricity increases from 5 mm (specimen W4) to 20 mm (specimen W1), the differential strain (i.e. the curvature deformation of the specimen) increases 4.21 times, which is not proportional to the increase in applied bending moment (four times). This may be attributed to different creep behaviour under com-pression and tension, and to additional eccentricity induced by lateral deflections. The results in Fig.3
also show that the MC2010 results match well the test results on the tension face but not so well on the compression face. Hence, there is a need to address this issue by coupling damage and creep on the long-term deformation potential of concrete.
3 Proposed modified creep model
3.1 Damage model
For computational efficiency, this study adopts the isotropic elastic damage model proposed by Mazars [35] to analyse the creep and drying-induced stresses [22,23,31]. The material properties used in Mazars’ model depend on the concrete age, especially at the early stages when concrete is most vulnerable to damage. In this article, some parameters of the original Mazars’ model are modified to consider the changes in the strength and stress–strain relationship over time. The time-dependant constitutive law is defined as:
r¼ð1D tð ÞÞE0ee ð1Þ whererandeeare the elastic stress and strain, respec-tively;D(t) is the damage variableð0D tð Þ 1Þat a concrete aget; andE0is the initial stiffness matrix of the material. To consider the behaviour under tension and compression stresses, the damage variableD(t) is defined as the linear superposition of a tensile damage variable Dþð Þ, and a compressive damage variablet Dð Þ:t
0 100 200 300
0 -100 -200 -300 -400 -500
Shrinkage strain(με)
Time (days)
DS BS
0 100 200 300 400
0 -500 -1000 -1500 -2000 -2500 -3000 -3500
-305με
Total strain(με)
Time (days) P=100KN
P=250KN
-705με
(a) Shrinkage strain, specimens DS and BS (b)Total strain, specimens D in compression
Fig. 2 Measured data of shrinkage and creep
-3000 -2500 -2000 -1500 -1000 -500 0 500
0 100 200 300 400
To
ta
l s
tr
ain
(μ
ε)
Time (days)
W1-P1 W1-P2 W2-P1 W2-P2 W3-P1 W3-P2 W4-P1 W4-P2 MC2010-P1 MC2010-P2
Compression face
Tension face Fig. 3 Comparison of
[image:5.547.54.496.58.223.2] [image:5.547.131.498.281.486.2]D tð Þ ¼aDþð Þ þt ð1aÞDð Þt Dþð Þ ¼t 1 1A
þ
ð Þk0ð Þt eeq
Aþexp Bþ eeqk0ð Þt
Dð Þ ¼t 1 1A
ð Þk0ð Þt eeq A
exp B e
eqk0ð Þt
ð2Þ where Aþ,Bþ,A and B are empirical parameters obtained from uniaxial material testing; a is a ratio between tension and compression stresses;k0ð Þt is the damage threshold at a concrete age t; and eeq is an equivalent strain. The valueais calculated as:
a¼
P3 i¼1hrii
P3 ij jri
ð3Þ
wherehriiis theith principal effective stress which is controlled by the Macaulay function. The Macaulay brackets in Eq. (3) indicate that only positive stress is considered.
For uniaxial tension,k0ð Þt can be calculated as: k0ð Þ ¼t fctmð Þt =E0ðtÞ ð4Þ wherefctmð Þt is the mean tensile strength of concrete; andE0ð Þt is the initial modulus of elasticity.
The damage criterion function, which is linked to D(t), can be used to determine the damage level in a multi-axial stress state. The strain-based damage criterion functionxis expressed as:
x eeq;k;t¼eeqk0ð Þt ð5Þ where all the variables are as defined before.
To consider the contribution of creep strains to the development of damage over time, Mazzoti and Savoia [23] proposed the use of a weighting coeffi-cientbcto calculate the equivalent straineeq, which is defined as:
eeq¼
ffiffiffiffiffiffiffiffiffiffiffiffiffiffiffiffiffiffiffiffiffiffiffiffiffiffiffiffiffiffiffiffiffiffiffiffi X3
i¼1heiþbceici 2
r
ð6Þ
whereeiis theith principal elastic strain; andeicis the creep strain in theith principal direction.
The Macaulay brackets in Eq. (6) indicate that only positive strain is considered. Typical values of bc range from 0.05 to 0.40 [22,23,31].
In real situations, the nonlinear creep strain is coupled with the plastic strain, which increases
microcracking over time and can lead to structural failures at high stress levels. The affinity hypothesis [36] has been used to describe the nonlinear effect of a high stress/strength ratio on the linear creep coefficient (b;, as described later). In this study, the affinity hypothesis is adopted to represent the influence of the stress/strength ratio onbc:
bc¼ac
maxð Þri fc
HFeeqk0ð Þt ð7Þ where ac is a modification coefficient for creep-induced damage which needs to be calibrated using test results;ri is the ith principal stress; fc is the concrete compressive strength; HF is a heaviside function defined as HF= 1 foreeqk0ð Þ t 0 or HF= 0 for eeqk0ð Þt \0 (i.e. a discontinuous function to control the effect of creep strain). Therefore, bc is taken into account only after the damage criterion [i.e. Eq. (5)) has been reached.
Equations (4) to (7) show that the effect of concrete ageing on damage is controlled by the tensile strength fctmð Þt and the initial elastic modulus of concreteE0ð Þ.t In this article, the strength development model in MC2010 [12] is adopted to calculatefctmð Þt andE0ð Þt using the test results from Sect.2.
It should be mentioned that, in real concrete structures, the evolution of damage and the develop-ment of material properties are mutually linked. For instance, as the strength and elastic modulus of concrete increase over time, the threshold of damage and the damage criterion also change over time. However, limited experimental data exist on the interaction between damage and strength increase. Consequently, the calculations in this study assume that the strength and elastic modulus do not change once the damage criterion is reached.
3.2 Drying and shrinkage model
oH
ot ¼ r½D Hð ÞrH þ
oHa
ot
D Hð Þ oH
on
jS¼f Hð enHsÞ
8 > < >
: ð8Þ
whereD(H) is the moisture diffusion coefficient;His the relative pore humidity;fis the surface factor;Hen is the environmental humidity; Hs is the relative humidity on the exposed faceS andoHa
ot is the rate of internal humidity change due to self-desiccation (full details of the self-desiccation model can be found in Ref. [6]). To determine the parameters needed for the hydro-mechanical model, a moisture diffusion analy-sis is first performed. This study adopts the approach suggested by MC2010 [12], whereD(H) is calculated as:
D Hð Þ ¼D1 bþ
1b 1þ 1H
1Hc n 0 B @ 1 C A ð9Þ
where D1 is the maximum of D(H) for H= 1.0 (D1= 1910
-8
[m2/s]/fck, where fck= characteristic
concrete strength); andHcis the relative pore humidity
at D(H) = 0.5D1. MC2010 suggests using b = 0.05, Hc= 0.80 andn = 15 in practical calculations.
The hydro-shrinkage coefficient bsh couples the free shrinkage strain and the varying moisture. Hence, the incremental shrinkage strain can be calculated as: Desh¼bshDH ð10Þ whereDHis the variation of pore humidity. The result of the shrinkage strain calculated with the above equation is substituted later in Eq. (17) to consider the interaction between drying, damage and creep (see Sects.3.4.1and3.4.2).
3.3 Creep model
In this study, the Dirichlet series is used to calculate the creep coefficient;:
;ðt0;tÞ ¼X m
j¼1
gjð Þt0 1exp t sj
ð11Þ
where gjð Þt0 is the jth age function; t0 is the initial loading time (in days); t is the age of concrete (in days); andsjis thejth discrete retardation time.
The creep strain at the end of theith andith?1 time steps considering the effect of concrete ageing can be expressed as:
ecð Þ ¼ti P i1
i¼0 Drð Þti
E tð Þi
Xm
j¼1
gjð Þti 1exp
titi1
sj
ecðtiþ1Þ ¼P
i
i¼0 Drðtiþ1Þ
E tðiþ1Þ Xm
j¼1
gjðtiþ1Þ 1exp tiþ1ti
sj 8 > > > > < > > > > : ð12Þ wheretiandtiþ1are the loading ages;gjð Þti is thejth age function; andsjis thejth discrete retardation time. From Eq. (12), the creep strain increments fromti to tiþ1are given by:
Decð Þ ¼ti
Xm
j¼1
Bjð Þti 1exp tiþ1ti
sj
ð13Þ
where
Bjð Þ ¼ti
Xi2
i¼0
Drð Þti gjðti1Þexp titi1
sj
þDrðti1Þgjðti1Þ ð14Þ Note that during the explicit iteration process, the stress is updated at the beginning of each time step and remains unchanged within a time step.Drð Þti is taken as the size of each time step.
From Eqs. (12) to (14), the incremental relationship can be defined by:
Bjðtiþ1Þ ¼Bjð Þti exp tiþ1ti
sj
þDrð Þti gjð Þti ð15Þ To carry out the above creep incremental analysis, the creep coefficient ; [Eq. (11)] needs to be cali-brated/calculated so that the parameters gjð Þti andsj can be determined. In this study, the creep model in MC2010 [12] is adopted for such calculation.
For simplicity, the loading time function and concrete age function are represented by curves. The age functiongjð Þti is assumed as constant att0¼1, 10, 100, 1000 and 10,000 days. Att0¼10 days, Eq. (11) can be expressed as:
;ð10;tÞ ¼X m
j¼1
gjð Þ10 1exp t sj
ð16Þ
By approximating the creep curve in MC2010, g1ð10Þ to gmð10Þ can be determined at t0¼10. Subsequent values of gj can be calculated at any loading ageti. Thejth age functiongjð Þti is established by fitting the values of the discrete points fromgjð Þ1 to gjð10000Þ. The results indicate that the exponential expression (form= 5) reproduces accurately the creep model included in MC2010.
3.4 Coupled hygro-mechanical numerical modelling
The above mentioned shrinkage, creep and damage models are implemented into the subroutine CUSER2 for 2D elements of ADINAÒ[38]. The time-dependent stress integration and numerical algorithm are described in the following sections.
3.4.1 Humidity and shrinkage
The development of shrinkage deformation is simu-lated using the drying process described previously in Sect.2.2. The consumption of internal humidity due to self-desiccation is modelled using a time-dependent uniform drying process. In each time step fromti to tiþ1, the incremental shrinkage strainDeshis calculated as:
Desh¼bshðHtiþ1HtiÞ ð17Þ
wherebshis the hydro-shrinkage coefficient; andHtiþ1 andHti are the humidities attiþ1andti, respectively.
3.4.2 Creep and damage
In the elastic state (i.e. damage criterion function x\0), the modulus of elasticity only depends on the age of concrete. The incremental strain and stress can be calculated using the iterative procedure described previously [Eqs. (13)–(15)]. Forx0, damage starts to develop and thus the damage-induced nonlinear strain–stress relationship needs to be used for the calculation of stresses [Eq. (1)]. The evolution of damage is controlled by Eq. (2). Accordingly, the elastic strain increases frometitoetiþ1in each time step from ti to tiþ1. This in turn increases the damage variable fromDti toDtiþ1, thus reducing the effective elastic modulus. The elastic strain etiþ1 can be expressed as:
etiþ1¼etiþðDeDecDeshÞ ð18Þ
where De, Dec and Desh are the increments of total strain, creep strain and shrinkage strain, respectively. The increment of creep strain Dec is calculated using Eq. (13). The increment of shrinkage strain is obtained using the humidity variation fromti totiþ1. The elastic stressrtiþ1 is calculated as:
rtiþ1 ¼Etiþ1 1Dtiþ1
etiþ1 ð19Þ
The incremental stressDr, which is used to update the creep model parameters, can be obtained using: Dr¼rtiþ1rti ð20Þ
The subroutine in ADINAÒ uses an explicit Euler forward stress integration approach and the above-mentioned algorithm. In summary, for each time step fromti totiþ1, the calculation involves the following steps:
(1) InitialiseBj t i
ð Þ[Eq. (14)] which is calculated at ti, then compute the incremental strain of creep Dec[Eq. (13)] and shrinkageDesh [Eq. (17)]; (2) Calculate the elastic strain etiþ1 [Eq. (18)], the
initial elastic stress rtiþ1 [Eq. (19)] and the equivalent straineeqtiþ1 [Eq. (6)].
(3) Check the criterion functionxtiþ1[Eq. (5)], and subsequently update the damage variable Dtiþ1 [Eq. (2)];
(4) Update the elastic stress rtiþ1 [Eq. (19)], then calculate the incremental stressDr[Eq. (20)]; (5) ComputeBtjiþ1[Eq. (15)] and save the data, then
go to next the time step and repeat the process until the calculation time is reached.
The following section adopts the proposed approach to provide further insight into the long-term behaviour of the specimens tested in Sect. 2. The approach is further validated using long-term test results from concrete specimens available in the literature.
4 Numerical analysis and discussion of results
creep strains considering the interaction between drying, damage and creep. This is conducted through an ad hoc subroutine developed in ADINAÒ[38], as described in Sect.3.4.
4.1 FE modelling
The FEA package ADINAÒ was used to solve the proposed coupled diffusion-mechanical model. The internal distribution of RH was calculated using ADINA-T, while ADINA Structure was employed for the analysis of the time-dependent structural behaviour. For consistency, the mesh of the diffusion model and mechanical model was the same. In the diffusion model, 2D diffusion elements were adopted to calculate the internal distribution of RH, and 1D convection elements were used to model the drying boundary of the specimens. Based on the RH measured in the laboratory, a constant ambient RH = 70% was selected for the exposed face in the diffusion model. 2D plane stress elements were used in the mechanical model.
4.2 Modelling parameters
In this study, the parameters needed for the new analytical creep model were determined through inverse analyses, calibrated against the experiments described in Sect.2.
4.2.1 Drying and shrinkage
The surface factor f and the hydro-shrinkage coeffi-cient bsh were calculated through inverse analyses using the results of sealed (BS) and unsealed speci-mens (DS). In the inverse analyses, the valuesf were first varied fromf1tofn, whilebsh remained constant. Subsequently,bshwas varied frombsh1tobshm, which in turn led to different values of fi. This resulted in mn sets of results for different combinations offi and bshi. The inverse analyses with the test results indicate that, as expected, there is a nonlinear relationship between the calculated shrinkage strain and the surface factorf. Through a parametric study (see Fig. S1 in Supplementary Material), the best match between the analysis and test results is obtained for f = 0.70 mm/day and f = 0.01 mm/day for unsealed and sealed specimens, respectively, and therefore such values are adopted in subsequent
analysis. A value bsh = 0.00234 matched well the experimental results of sealed and unsealed speci-mens, and therefore this value is used in the proposed analytical creep model.
4.2.2 Creep and creep-induced damage
To determine the linear creep coefficientb; and the creep-induced damage modification coefficient ac [defined in Eq. (7)], the test data from specimens D and the linear creep model in MC2010 [12] (see Sect.3.3) were used. To consider the errors due to variability of material properties and environment, MC2010 suggests the use of a mean creep coefficient with a 95% confidence interval, which leads to lower and upper limit values of 0.59 and 1.41, respectively. In this study, the mean total strain of specimens D1 and D2 (subjected to P= 100 kN) is calculated by performing FEA assumingb; = 1.5, 1.25 or 1.0. The results from a parametric analysis indicate that the use ofb; = 1.25 matches accurately the test results. Since the compressive stress produced by the applied load is below the linear limit value (0.4fcm), the calculated
results confirm that the specimens do not experience damage.
In this study, the creep model in MC2010 is adopted for creep incremental analysis. The function bðRHÞ (defined in MC2010) is used to take into account the effects of relative ambient humidity. Since all the specimens were kept under standard laboratory con-ditions at ambient RH = 70% ±10% during testing, the approximate constant RH = 70% is adopted for creep calculations.
influence on the development of compressive damage over time.
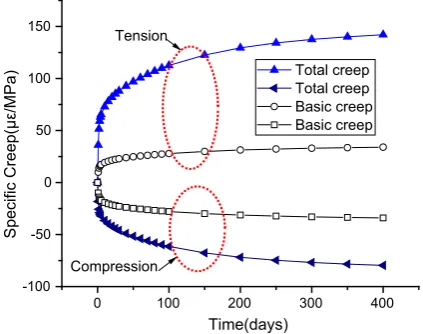
To study the relationship between tensile creep and compressive creep, tensile creep strains were calcu-lated using the same material parameters used previ-ously in the compressive creep FEA models. The applied load was determined using a stress/strength ratio of 50% for both tensile creep and compressive creep models. The specific creep (creep strain per unit stress) is adopted here to show more clearly the difference of creep strains under different applied stress. Basic creep was also calculated to examine the contribution of the drying process to the total creep strain over time. To avoid the influence of drying shrinkage and creep, an ambient RH = 100% was selected for basic creep analysis. Figure5 compares the calculated specific creep in compression and tension for a stress/strength ratio = 50%. The total creep (basic creep plus drying creep) results show that the specific creep stain in tension is significantly higher than in compression, and that the ratio of tensile to compressive specific creep is 1.78. It is also shown that the calculated basic creep in tension is equal to the one in compression, and that the ratio of basic creep to total creep is 0.24 and 0.43 for tension and compres-sion, respectively. These results indicate that the difference between tensile and compressive creep can be attributed to drying-induced damage.
4.3 Drying-induced stresses and damage
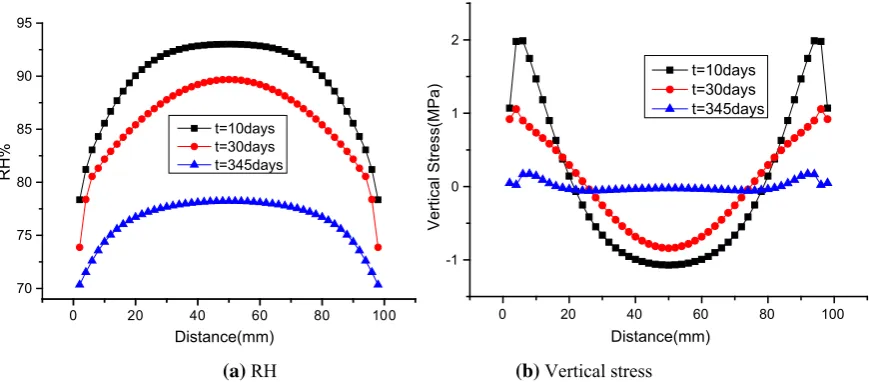
The results summarised in the previous paragraphs are used here to simulate the drying-induced stresses and damage, as well as the creep behaviour of the tested specimens. Figure6a–b show, respectively, the FE results of time-dependent RH and vertical stress distribution across the 100 mm width (at mid-height) of the shrinkage specimen DS. Figure 6a indicates that, as expected, the calculated internal RH decreases over time from 92% at t= 10 days to 77.5% at t = 345 days. It is also shown that, as expected, the RH is not uniform across the section due to surface drying.
0 100 200 300 400
0 -400 -800 -1200 -1600 -2000 -2400 -2800 -3200 -3600
Total strain(με)
Time (days)
αc=1.0
αc=0.6
αc=0.2 Test
1 10 100
0.0 0.1 0.2 0.3 0.4
Damage variable
Time (days) αc=1.0
αc=0.6 αc=0.2
(a) Total strain
(b) Time-dependent damage variable
Fig. 4 Comparison of total strain and damage and FEA results using different creep-induced damage modification coefficientsac
0 100 200 300 400
-100 -50 0 50 100 150
Compression
Time(days)
Specific Creep(με/MPa)
Total creep Total creep Basic creep Basic creep Tension
[image:10.547.54.498.59.249.2] [image:10.547.287.499.287.454.2]For instance, att= 10 days, the maximum RH = 92% is located in the middle of the section, whereas the minimum internal RH = 77.7% is at the surface.
The results in Fig.6b show that drying causes vertical stresses due to the differential drying shrink-age strains throughout the cross-section of the spec-imen. At an early age (t= 10 days), the stress is not uniform across the width of the specimen. Tensile stresses develop up to depths of 20–22 mm, whereas the core remains in compression. Figure6b also shows that, at t = 10 days, the tensile stresses exceed the concrete tensile strength at the surface, thus leading to damage. This is confirmed by a drop in the maximum tensile stress from 2.0 to 1.1 MPa at a 5 mm depth from the specimen surface. The maximum compres-sive stress is -1.0 MPa in the centre of the specimens. Note that the magnitude of drying-induced stresses decreases over time as the internal RH tends to balance with the ambient RH. For instance, at t= 345 days, the maximum tensile stress drops to 0.17 MPa, which is only 15% of that calculated at t= 10 days.
For the free shrinkage specimens, shrinkage dom-inates the total deformation of the specimens. How-ever, creep significantly affects the distribution of drying-induced stress during the drying process of the specimens. To examine the contribution of creep to the variation of stress and damage distribution over time, the specimens were modelled without creep. Fig-ure7a–b compare the FEA results of drying
specimens at t= 10 days with and without creep, respectively. Figure 7a shows that, due to stress relaxation in concrete, the drying-induced damage occurs mainly near the surface up to depths of 2.5–5 mm. Conversely, Fig.7b shows that if creep is neglected, the tensile stresses caused by non-uniform drying cannot be relieved, thus leading to damage (cracking) growing from the surface to a depth of up 30 mm att= 10 days. As discussed in Sect. 3.3, no cracking was observed during the tests on drying specimens DS1 and DS2. These observations imply that the inclusion of concrete creep in the proposed model is necessary to simulate and assess accurately the behaviour of drying concrete. The results also indicate that, as expected, concrete creep has no influence on the development of shrinkage strain in sealed or unsealed specimens. However, creep signif-icantly affects the drying-induced stresses and the damage distribution.
4.4 Creep under eccentric compression
In this section, specimens W1–W4 are modelled to examine the time-dependent strains and stresses. For the diffusion and mechanical models, the following values were adopted: surface factor f= 0.7 mm/day, hydro-shrinkage coefficientbsh= 0.00234, creep mod-ification coefficient b;¼1:25, and creep-induced damage modification coefficient ac = 0.6 (see more details in Sect.4.2). The input parameters used in the
0 20 40 60 80 100
70 75 80 85 90 95
RH%
Distance(mm)
t=10days t=30days t=345days
0 20 40 60 80 100
-1 0 1 2
Vertical Stress(MPa)
Distance(mm)
t=10days t=30days t=345days
(a) RH (b) Vertical stress
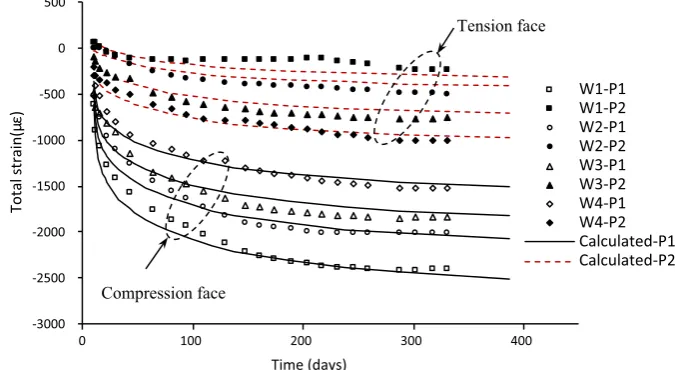
[image:11.547.52.489.58.249.2]FE modelling are listed in Table B and Table C in the Supplementary Material. Figure8 compares the FE results and strain gauge readings from gauges P1 and P2. The total strain shown in Fig.8 includes the transient elastic strain caused by the applied load, as well as the time-dependent shrinkage and creep strains. The results indicate that the FE models match well the experimental data and provide more accurate results than MC2010 for the compression face of the specimens. The minor discrepancy between calcula-tions and test results can be attributed to minor variations of (i) environmental conditions (e.g. vari-able RH), and (ii) applied load during a test.
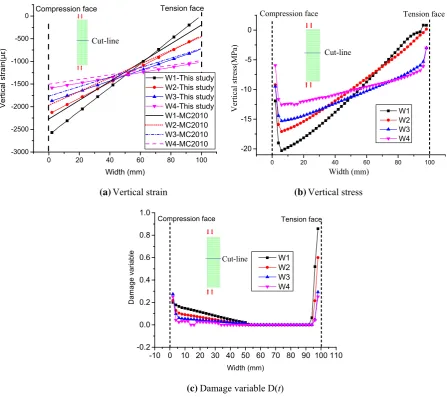
To examine the impact of different load eccentric-ities, Fig.9a–c compare the FE results of vertical strain, stresses and the damage variable D(t) at the
mid-height att= 387 days (i.e. at the end of the test), respectively. To assess the difference between the proposed model and MC2010, the simplified elastic beam theory is adopted in the calculations. Figure9a shows that, as expected, the slope of the vertical strain calculated using the elastic beam model is constant and varies linearly for specimens W1 to W4. However, when non-uniform drying shrinkage and nonlinear creep are considered, the slope of the vertical strain is steeper than the results from the beam model, while the vertical strain on the compression face is higher. It is also shown that the ratio between the maximum compressive strain given by the proposed model and MC2010 decreases nonlinearly from W1 to W4. For example, such ratio is 1.13 for W1, but only 1.05 for W4. It is also evident that the proposed model Fig. 7 Comparison of vertical stresses and damage distribution with or without creep effects (units: MPa)
-3000 -2500 -2000 -1500 -1000 -500 0 500
0 100 200 300 400
Total strain(μ
ε)
Time (days)
W1-P1 W1-P2 W2-P1 W2-P2 W3-P1 W3-P2 W4-P1 W4-P2 Calculated-P1 Calculated-P2
Compression face
Tension face Fig. 8 Comparison of
[image:12.547.110.444.56.220.2] [image:12.547.162.500.474.659.2]calculates a roughly constant slope of vertical strains for W1, which indicates that there is no cracking at the cut-line of W1. These results match well the exper-imental observations shown later in Fig.10.
As shown in Fig. 9b, the slope of the vertical stresses (which include normal and bending stresses) is approximately constant in the core of the specimen. However, due to drying shrinkage, vertical stresses reduce close to the specimen surface, particularly within the first 5 mm of the compression face. For example, the vertical stress at the compression face of W1 drops by about 10 MPa.
The results in Fig. 9c also show that, due to drying and bending, the magnitude and distribution of
damage are different on the tension and compression faces of the specimens. On the tensile face, damage extends up to a depth of 5–7.5 mm. It is also shown that the damage variable depends on the instantaneous strain produced by the load. The damage variable decreases from 0.86 (W1) to 0.22 (W4) as the eccentricity decreases. The results in Fig. 9c also show that the depth of damage on the compression face of W1 extends up to 50 mm (i.e. half of the specimen width), where the damage threshold has been reached. Overall, the results in Fig.9a–c indicate that both concrete drying and the applied load can produce and affect the development of damage.
0 20 40 60 80 100
-3000 -2500 -2000 -1500 -1000 -500
0 Tension face
Vertical strain(με)
Width (mm)
W1-This study W2-This study W3-This study W4-This study W1-MC2010 W2-MC2010 W3-MC2010 W4-MC2010
Cut-line
Compression face
0 20 40 60 80 100
-20 -15 -10 -5 0
Tension face Compression face
Cut-line
Vertical stress(MPa)
Width (mm)
W1 W2 W3 W4
(a) Vertical strain (b) Vertical stress
-10 0 10 20 30 40 50 60 70 80 90 100 110
-0.2 0.0 0.2 0.4 0.6 0.8 1.0
Tension face Compression face
Damage variable
Width (mm)
W1 W2 W3 W4
Cut-line
(c)Damage variable D(t)
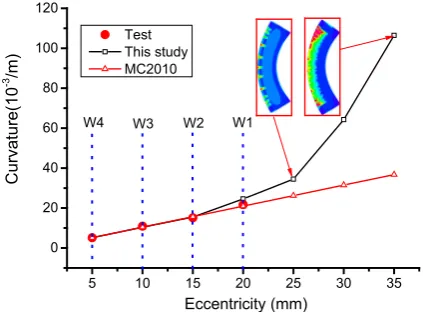
[image:13.547.51.499.55.452.2]To further study the effect of eccentricity on the development of curvature, Fig.10 compares the curvature of specimens W1–W4 at t= 321 days, as well as curvature given by the FE models and by MC2010. The experimental results in Fig.10 were calculated using strains measured at both faces of the specimens. The figure also shows FE results of three models with theoretical eccentricities of 25, 30 and 35 mm, which are used here to investigate the trend of results beyond the eccentricities used in the tests. The results in Fig. 10 show that whilst the curvature increases initially linearly with the eccentricity, it becomes nonlinear for eccentricities larger than 25 mm. The rapid increase in curvature can be attributed to extensive damage on the tensile face of the specimens, as indicated by the cracks shown in Fig.10. It is shown that the proposed model and MC2010 estimates accurately the curvatures for eccentricities below 25 mm, but the results diverge for large eccentricities since the model in MC2010 neglects the combined effects of cracking and drying. For instance, the calculated curvature for an eccen-tricity of 25 mm is 34.5910-3/m, which is 1.3 times larger than the MC2010 results.
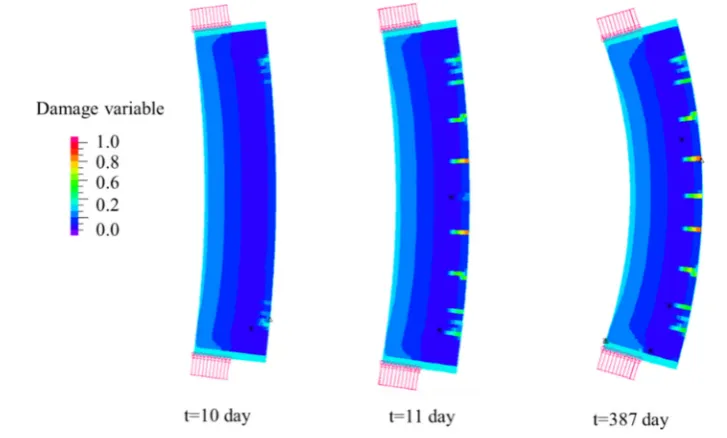
The proposed model can also estimate the devel-opment of cracking damage in concrete. Figure11
shows that after applying the load (t= 10 days) in the model with a theoretical eccentricity of 25 mm, damage occurs at the tensile face and across a depth of 5–10 mm. Tensile damage extends towards the centre of the specimen over 1 day (t= 11 days), and the number and length of the cracks increase
significantly, which somehow explains why the fifth specimen mentioned in Sect.2.2 failed prematurely during the test. Tensile damage progresses until the end of the analysis (t= 387 days) where the depth of tensile damage increases up to 25 mm.
4.5 Validation of proposed approach
The proposed approach is used to simulate the long-term behaviour of two simple-supported reinforced concrete beams tested by Gilbert and Nejadi [39] in four-point bending. Whilst the beams were not subjected to direct axial compression, their behaviour is representative of that observed in the specimens tested in this study. Beams B1-a and B1-b had a clear span of 350 cm long and a cross-section of 25934 cm. The main flexural bottom reinforcement consisted of two 16 mm bars. The 28-day compressive strength, tensile strength and elastic modulus of concrete were 24.8 MPa, 2.8 MPa and 24.9 GPa, respectively. After moist-curing for 14 days, two sustained concentrated loads were applied at 117 cm from the supports. The loads were 18.6 kN and 11.8 kN for specimens B1-a and B1-b respectively, or approximately 50% and 39% of the ultimate flexural moment at midspan. The time-dependent deflections and cracking of the specimens were recorded for 400 days.
3D solid elements are employed to simulate the hydro-mechanical behavior of the beams in ADINA (see Fig. S2 in Supplementary Material). Due to symmetry, only a quarter of the beams is modelled. A 1D rebar element (truss element) is used to model the reinforcement. Bond-slip behavior between bars and concrete is considered through distributed nonlinear spring elements.
The mechanical models described in previous sections (considering the interaction between drying, damage and creep) are used to assess the time-dependent deflections of the beams reported in [39], where standard shrinkage and creep tests were also performed. The shrinkage and creep specimens were exposed to the same environmental, curing and drying conditions as the tested beams. Accordingly, the surface factor f and the hydro-shrinkage coeffi-cientbshare calculated through inverse analyses using the results of drying shrinkage tests reported in [39]. The parameters for the creep model are defined according to the results of concrete properties and
5 10 15 20 25 30 35
0 20 40 60 80 100 120
W1 W2 W3
Curvature(10
-3 /m)
Eccentricity (mm)
Test This study MC2010
[image:14.547.49.261.59.215.2]W4
creep tests from the report. For the beams, values f = 0.8 mm/day and bsh = 0.0025 are adopted in subsequent analysis of drying shrinkage. Likewise, a linear creep coefficientb; = 1.02 and a creep-induced damage modification coefficientac= 0.6 are used for the creep models. To check the influence of differen-tial dry shrinkage and nonlinear creep, the original shrinkage and creep models in MC2010 are adopted and examined. The damage effect (Sect.3.1) is also considered in the MC2010 model to simulate the initial cracks due to the first loading.
Figure S3 in the Supplementary Material shows the estimated distribution of internal humidity in the core and the surface of the beams at t= 15, 50 and 300 days. The FEA results of time-dependent RH show that the drying depth of the exposed surface is only 1–3 cm in the first 300 days, while the internal RH at the core varies marginally. The non-uniform RH between the surface and the core of the cross section causes a differential drying shrinkage strain, as well as drying-induced stresses. This is inconsistent with the uniform shrinkage model adopted in MC2010, where the differential drying shrinkage strain and stress are neglected. Conversely, the one-way hydro-mechanical coupling analysis approach proposed in this study considers the drying shrinkage and drying-induced stress according to the distribution of the internal humidity on the beams.
Figure12compares the deflection estimated by the proposed model and the test results of B1-a and B1-b. It is shown that the proposed approach predictions match well the experimental beam deflections for both the instantaneous deflection and time-dependent deflection. This confirms the importance of consider-ing the dryconsider-ing-induced stress in the analysis of long-term deformations of concrete elements.
The proposed model also matches well the crack distribution observed during the tests performed by Gilbert and Nejadi, as shown in Fig. S4 in Supple-mentary Material. It is shown that MC2010 matches Fig. 11 Development of damage variable over time for an eccentricity of 25 mm
0 100 200 300 400
0 2 4 6 8 10 12 14
B1-a
B1-b
Test[39]
This study MC2010 Chong et al.[40]
Defection(mm)
Time(day)
[image:15.547.286.501.471.636.2]well the cracks in the constant moment region (due to the first loading), but not the cracks outside this region that developed during the period of sustained loads. For instance, cracks 1 and 2 formed at 20 and 51 days after the initial application of the load, respectively. The underestimation of concrete cracking outside the constant moment region explains the underestimation of the long-term deflection given by MC2010 in Fig.12. These results further confirm that both the applied load and the drying-induced stress contribute to cracking in concrete elements. To further validate the proposed model, Fig. 14 also includes the predic-tions of the model proposed by Chong et al. [40], which is widely used for the time-dependent analysis of reinforced concrete structures. The figure only includes Beam 1a from Gilbert and Nejad’s study because the results of beam B1-b are not available in Ref. [40]. It is shown that the model proposed in this study matches the experimental results better than Chong et al.’s model.
Overall, the results in this study show that the proposed numerical approach estimates the behaviour of the concrete specimens with good accuracy. Therefore, it is proposed to use this model to assess time-dependent behaviour and crack development in specimens subjected to eccentric compression taking into account ageing, drying and cracking effects. However, due to the limited test data available for the model calibration and validation, future research is needed to further generalise the model. It should also be mentioned that whilst an isotropic elastic damage model was adopted in this study, the use of an elastic– plastic damage criterion could provide better results on damage evolution. Moreover, a one-way coupling method was adopted to determine the interaction between drying, damage and creep. This implies that although the proposed model considers the contribu-tion of concrete drying to surface damage (cracking), it ignores the additional drying due to surface damage, which in turn could speed up moisture evaporation. Further research is needed to clarify this issue.
5 Conclusions
This study proposed a new creep damage model based on modifications to the linear creep approach given in Model Code 2010. The parameters of the model were determined and calibrated against 12 small-scale
concrete specimens subjected to long-term eccentric axial load. The proposed model simulates accurately the development of shrinkage and creep, as well as the interaction between drying, damage and creep. Based on the results of this study, the following conclusions are drawn:
1. The results of shrinkage specimens calculated by the hygro-mechanical simulation show that the creep of concrete has no obvious influence on the development of shrinkage strain for both the sealed or unsealed specimens tested in this study, but it significantly affects the drying-induced stress and the damage distribution.
2. The model indicates that eccentric loading leads to different tensile and compressive creep on the specimens’ faces, which contradicts the current design approach that suggests that compressive loads produce similar tensile and compressive creep.
3. The relationship between lateral deflection and load eccentricity in short columns is nonlinear. As the eccentricity increases from 5 to 20 mm, the differential strain (which represents the deflection curvature of the specimen) increases by 5%. 4. The proposed approach matches the experimental
results of the tested specimens with good accu-racy. The accuracy of the approach is confirmed by further validation with test data available in the literature. Therefore, it is proposed to use this model to assess the time-dependent behaviour and the development of cracking of concrete speci-mens subjected to eccentric compression and taking into account ageing, drying and cracking effects. Since only a few parameters are needed during calculations, the proposed approach is suitable for practical assessment of long-term behaviour of concrete bridges and buildings.
Compliance with ethical standards
Conflict of interest The authors declare that they have no conflict of interest.
Human and animal rights This research does not involve human participants and/or animals.
Open Access This article is licensed under a Creative Commons Attribution 4.0 International License, which permits use, sharing, adaptation, distribution and reproduction in any medium or format, as long as you give appropriate credit to the original author(s) and the source, provide a link to the Creative Commons licence, and indicate if changes were made. The images or other third party material in this article are included in the article’s Creative Commons licence, unless indicated otherwise in a credit line to the material. If material is not included in the article’s Creative Commons licence and your intended use is not permitted by statutory regulation or exceeds the permitted use, you will need to obtain permission directly from the copyright holder. To view a copy of this licence, visit
http://creativecommons.org/licenses/by/4.0/.
References
1. Bazˇant ZP, Yu Q, Li GH (2012) Excessive long-time deflections of prestressed box girders. I: record-span bridge in Palau and other paradigms. J Struct Eng 138(6):676–689.
https://doi.org/10.1061/(asce)st.1943-541x
2. Krˇı´stek V, Bazˇant ZP, Zich M, Kohoutkova´ (2006) Box girder deflections: why is the initial trend deceptive? ACI SP-194, Farmington Hills, MI, pp 237–260
3. Elbadry M, Ghali A, Gayed RB (2014) Deflection control of prestressed box girder bridges. J Bridge Eng 19(5):04013027. https://doi.org/10.1061/(asce)be.1943-5592.0000564
4. Granata MF, Recupero A (2015) Serviceability and ultimate safety checks of segmental concrete bridges through N–M and M–V interaction domains. J Bridge Eng 20(8):B4014003. https://doi.org/10.1061/(asce)be.1943-5592.0000686
5. Huang H, Huang S-S, Pilakoutas K (2018) Modeling for assessment of long-term behavior of prestressed concrete box-girder bridges. J Bridge Eng 23(3):04018002 6. Huang H, Garcia R, Guadagnini M, Pilakoutas K (2017)
Effect of section geometry on development of shrinkage-induced deformations in box girder bridges. Mater Struct 50(5):222.https://doi.org/10.1617/s11527-017-1090-y
7. Barros H, Silva VD, Ferreira C (2010) Second order effects in slender concrete columns-reformulation of the Eurocode 2 method based on nominal curvature. Eng Struct 32(12):3989–3993. https://doi.org/10.1016/j.engstruct. 2010.08.005
8. Hamed E (2012) Bending and creep buckling response of viscoelastic functionally graded beam-columns. Compos Struct 94(10):3043–3051. https://doi.org/10.1016/j. compstruct.2012.04.029
9. Hamed E, Lai C (2016) Geometrically and materially non-linear creep behaviour of reinforced concrete columns. Structures 5:1–12.https://doi.org/10.1016/j.istruc.2015.07. 001
10. Lou T, Lopes S, Lopes AV (2015) FE analysis of short- and long-term behavior of simply supported slender prestressed concrete columns under eccentric end axial loads causing uniaxial bending. Eng Struct 85:52–62.https://doi.org/10. 1016/j.engstruct.2014.12.023
11. Kwak HG, Kim JK (2006) Nonlinear behavior of slender RC columns. Constr Build Mater 20(8):527–537. https:// doi.org/10.1016/j.conbuildmat.2005.01.036
12. fib (2013) fib Model Code for Concrete Structures 2010. Wilhelm Ernst & Sohn, Berlin
13. Forth JP (2015) Predicting the tensile creep of concrete. Cem Concr Compos 55:70–80. https://doi.org/10.1016/j. cemconcomp.2014.07.010
14. Kristiawan SA (2006) Strength shrinkage and creep of concrete in tension and compression. Civ Eng Dimens 8(2):80
15. Bazˇant ZP, Xi YP (1994) Drying creep of concrete: con-stitutive model and new experiments separating its mecha-nisms. Mater Struct 27(1):3–14
16. Bazˇant ZP, Jira´sek M (2014) Microprestress-solidification theory on drying creep. In: Proceedings of EURO-C 2014: computational modelling of concrete structures, pp 749–758 17. Gasch T, Malm R, Ansell A (2016) A coupled hygro-thermo-mechanical model for concrete subjected to variable environmental conditions. Int J Solids Struct 91:143–156.
https://doi.org/10.1016/j.ijsolstr.2016.03.004
18. Wei Y, Guo W, Liang S (2016) Microprestress-solidifica-tion theory-based tensile creep modeling of early-age con-crete: considering temperature and relative humidity effects. Constr Build Mater 127:618–626.https://doi.org/ 10.1016/j.conbuildmat.2016.10.055
19. Jira´sek M, Havla´sek P (2014) Microprestress–solidification theory of concrete creep: reformulation and improvement. Cem Concr Res 60:51–62. https://doi.org/10.1016/j. cemconres.2014.03.008
20. Hilaire A, Benboudjema F, Darquennes A, Berthaud Y, Nahas G (2014) Modeling basic creep in concrete at early-age under compressive and tensile loading. Nucl Eng Des 269:222–230.https://doi.org/10.1016/j.nucengdes.2013.08. 034
21. Di Luzio G, Cusatis G (2013) Solidification–micropre-stress–microplane (SMM) theory for concrete at early age: theory, validation and application. Int J Solids Struct 50(6):957–975. https://doi.org/10.1016/j.ijsolstr.2012.11. 022
22. Reviron N, Benboudjema F, Torrenti J, Nahas G, Millard A (2007) Coupling between creep and cracking in tension. In: 6th International conference on fracture mechanics of con-crete and concon-crete structures, Italy
23. Mazzotti C, Marco S (2003) Nonlinear creep damage model for concrete under unaxial compression. J Eng Mech 129(9):10. https://doi.org/10.1061//ASCE/0733-9399/ 2003/129:9/1065
24. Li H, Liu J, Wang Y, Yao T, Tian Q, Li S (2015) Defor-mation and cracking modeling for early-age sidewall con-crete based on the multi-field coupling mechanism. Constr Build Mater 88:84–93. https://doi.org/10.1016/j. conbuildmat.2015.03.005
25. Knoppik-Wro´bel A, Klemczak B (2015) Degree of restraint concept in analysis of early-age stresses in concrete walls. Eng Struct 102:369–386. https://doi.org/10.1016/j. engstruct.2015.08.025
concrete structures. Eng Struct 33(4):1390–1401. https:// doi.org/10.1016/j.engstruct.2010.12.044
27. Kwak HG, Ha SJ, Kim JK (2006) Non-structural cracking in RC walls. Cem Concr Res 36(4):749–760.https://doi.org/ 10.1016/j.cemconres.2005.12.001
28. Azenha M, Leita˜o L, Granja JL, de Sousa C, Faria R, Barros J (2017) Experimental validation of a framework for hygro-mechanical simulation of self-induced stresses in concrete. Cem Concr Compos 80:41–54. https://doi.org/10.1016/j. cemconcomp.2017.02.008
29. Benboudjema F, Meftah F, Torrenti JM (2005) Interaction between drying, shrinkage, creep and cracking phenomena in concrete. Eng Struct 27(2):239–250.https://doi.org/10. 1016/j.engstruct.2004.09.012
30. Benboudjema F, Thiery M, Sicard J (2008) Analysis of microcracking induced by differential drying shrinkage. Cem Concr Compos 30(10):947–956. https://doi.org/10. 1016/j.cemconcomp.2008.06.015
31. Honorio T, Bary B, Benboudjema F (2015) Factors affect-ing the thermo-chemo-mechanical behaviour of massive concrete structures at early-age. Mater Struct 49(8):3055–3073. https://doi.org/10.1617/s11527-015-0704-5
32. ACI Committee 209 (2008) ACI 209.2R-08-guide for modeling and calculating shrinkage and creep in concrete. American Concrete Institute, USA
33. JTG D62-2004 (2004) Code for design of highway rein-forced concrete and prestressed concrete bridges and cul-verts. M.o.C.o., Beijing, China (in Chinese)
34. C512M-15 AC (2015) Standard test method for creep of concrete in compression. ASTM International, West Conshohocken
35. Mazars J, Pijaudier-Cabot G (1989) Continuum damage theory—application to concrete. J Eng Mech 115(2):345–365
36. Ruiz MF, Muttoni A, Gambarova PG (2007) Relationship between nonlinear creep and cracking of concrete under uniaxial compression. J Adv Concr Technol 5(3):383–393 37. Kim JK, Lee CS (1999) Moisture diffusion of concrete
considering self-desiccation at early ages. Cem Concr Res 29:1921–1927
38. ADINA (2001) ADINA Theory and modeling guide. Report 01–7. Watertown, MA
39. Gilbert R, Nejadi S (2004)An experimental study of flexural cracking in reinforced concrete members under sustained loads. UNICIV Report No. R-435, The University of New South Wales, Sydney
40. Chong KT, Foster SJ, Gilbert RI (2008) Time-dependent modelling of RC structures using the cracked membrane model and solidification theory. Comput Struct 86(12):1305–1317