1
A method-centric ‘User Manual’ for the mitigation of diffuse
1
water pollution from agriculture
2S. P. C
UTTLE a1,J. P. N
EWELL PRICE b*,D. H
ARRIS c,D. R. C
HADWICK d2,M. A.
3
S
HEPHERD b3, S. G. A. A
NTHONY e,C. J. A. M
ACLEOD d4, P. M. H
AYGARTH d5 4&
B. J. C
HAMBERS b 56
a
Institute of Grassland and Environmental Research (IGER), Plas Gogerddan (now Institute 7
of Biological, Environmental and Rural Sciences - IBERS - Aberystwyth University), 8
Aberystwyth, Ceredigion SY23 3EB, UK, bADAS Gleadthorpe, Meden Vale, Mansfield, Notts. 9
NG20 9PD, UK, cADAS Leeds, Rubicon Square, Pentagon 2, 4205 Park Approach, Thorpe 10
Park, Leeds LS15 8GB, UK, d IGER, North Wyke (now Rothamsted Research, North Wyke), 11
Okehampton, Devon, EX20 2SB UK, eADAS Wolverhampton, Pendeford House, Pendeford 12
Business Park, Wolverhampton WV9 5AP, UK 13
1
Now retired, 2Now at the School of Environment, Natural Resources and Geography, 14
Bangor University, Bangor LL57 2UW, UK, 3Now at AgResearch, Ruakura Research Centre, 15
Hamilton 3214, NZ, 4Now at The James Hutton Institute, Craigiebuckler, Aberdeen AB15 16
8QH, UK, 5Now at Lancaster Environment Centre, Lancaster University, Lancaster LA1 4YQ, 17
UK 18
*Corresponding Author: P. Newell-Price. (E-mail: [email protected])
19 20
Running Title: Manual for mitigation of diffuse water pollution
2
Summary
22
We describe the development of a manual of methods for mitigating diffuse water pollution 23
from agriculture and its important influence on policy and practice in England and Wales. The 24
objective of the ‘User Manual’ was to provide policy makers and those implementing policies 25
with information about the cost, effectiveness and applicability of potential methods in a form 26
that would be readily understood by non-specialists. The ‘User Manual’ was based on earlier 27
reports synthesising available research data and, where data were unavailable, used expert 28
elicitation. The outcome generated 44 potential methods (under the broad categories of land 29
use, soil management, livestock management, fertiliser management, manure management 30
and farm infrastructure) and described the simultaneous impact of applying each method on 31
losses of nitrate, phosphorus and faecal indicator organisms relative to baseline losses. 32
Estimates of cost and effectiveness were presented at the whole-farm level for seven model 33
farm types. Methods differed widely in their cost-effectiveness and applicability to the 34
different model farms. Advantages and limitations of the approach are discussed and 35
subsequent developments of the original ‘User Manual’ are described, together with the 36
opinions of catchment officers who have used the ‘User Manual’ to implement mitigation 37
methods on farms. 38
Keywords: mitigation methods, cost-effectiveness, nitrate, phosphorus, faecal indicator
39
3
Introduction
41
The European Union Water Framework Directive (EU, 2000) seeks to address all forms of 42
water pollution by requiring that all surface waters and groundwater in member states should 43
be of good ecological and chemical status by 2015 with a maximum derogation to 2027. A 44
key requirement is that member states should implement River Basin Management Plans 45
detailing the measures to be taken to tackle pollution at the catchment scale, including the 46
diffuse pollution that originates from agricultural sources. Much research had been done to 47
quantify the losses of diffuse water pollutants from agricultural land, to understand the 48
processes controlling them and to develop practical measures to reduce losses (e.g. Haygarth 49
& Jarvis, 2003; Cherry et al., 2008; Sharpley et al. 2005; Shepherd and Chambers, 2007); 50
however, the further use of these findings to assist with the development of effective policies 51
for the control of water pollution required that complex and sometimes conflicting 52
information be made available in a form that was accessible and readily understood by those 53
developing and implementing these policies. 54
In this paper we describe one of the first attempts to provide policy makers with an 55
integrated assessment of the cost-effectiveness of a range of potential mitigation measures to 56
control losses of the most important forms of diffuse water pollution from agriculture 57
(DWPA): nitrogen (N) in the form of nitrate-N, phosphorus (P) and faecal indicator 58
organisms (FIOs) originating from animal excreta and manures. This was presented in the 59
form of a ‘User Manual’, which in addition to information about their cost-effectiveness also 60
provided specific information about how the methods operate, their applicability to different 61
types of farm and the wider implications of their use. A novel feature of the ‘User Manual’ 62
was that it adopted a ‘method-centric’ approach, focussing on each method in turn and its 63
simultaneous impact on all three pollutants. Preparation of the ‘User Manual’ also recognised 64
4 was necessary to rely on expert elicitation to fill the gaps where scientific data were lacking, 66
accepting the uncertainties associated with this process. Expert elicitation is recognised as 67
making a valuable contribution to the description and modelling of complex environmental 68
systems, especially where evidence is incomplete and the implementation of policies or 69
actions cannot be delayed until all the necessary knowledge becomes available (Kreuger et 70
al., 2012). 71
By analysing and bringing together the results of a wide range of scientific studies and 72
presenting them in an accessible form, the ‘User Manual’ is seen as an important contribution 73
to bridging the gap between scientists and policy makers to assist in the development of 74
evidence-based policies (Macleod et al., 2008). We describe how the ‘User Manual’ was 75
formulated, how it has been developed since its publication in 2007 and its subsequent use to 76
help implement policy and DWPA methods in programmes such as Catchment Sensitive 77
Farming (CSF) (Natural England, 2013). 78
Method
79
Development of the ‘User Manual’ 80
The requirement for a manual arose from a request from the UK Department for Environment, 81
Food and Rural Affairs (Defra) to integrate and further develop a number of literature studies 82
that examined the cost and effectiveness of a range of methods for reducing forms of DWPA, 83
including N (Defra, 2004a), P (Haygarth et al., 2009) and FIOs (Defra, 2005). Information 84
from these reports, which each dealt with a separate pollutant, was brought together in a 85
single inventory to allow a more ‘method-centric’ approach to be adopted. The ‘User Manual’ 86
was developed from this inventory to provide policy makers with a comprehensive 87
5 controlling losses of N, P and FIOs, their cost and effectiveness and the potential for their 89
application within different farming systems and soil types. 90
The ‘User Manual’ was prepared by an interdisciplinary team of scientists, including 91
agronomists, biogeochemists, economists, hydrologists, modellers and soil scientists, with 92
considerable experience in understanding the processes controlling the behaviour of the 93
relevant pollutants and how these are influenced by agricultural practices. The ‘User Manual’ 94
development process is described in the following sections. 95
Model farms, climate and soil types 96
Pollutant losses were expressed at the whole-farm level. It was therefore necessary to define 97
specific model farms to use as the basis for the calculations. These were chosen to be 98
representative of the main UK farming sectors and were closely defined in terms of farmed 99
area, field size, cropping, livestock numbers and ages, housing period, fertiliser and 100
manure/slurry management, using typical values obtained from published data (e.g. MAFF, 101
2000; Smith et al., 2000; Goodlass & Allin, 2004) and expert judgement. Characteristics of 102
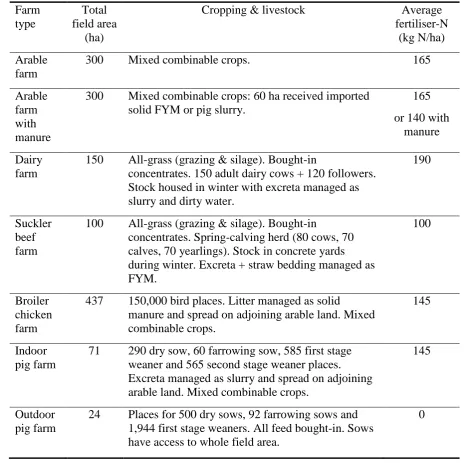
the seven model farm types are outlined in Table 1. 103
All farms were assumed to be located in a medium rainfall area (850 mm rain/year). 104
Estimates were prepared for farms on a clay loam soil (assumed to be artificially drained 105
under arable production) and on a sandy loam soil (assumed to be freely drained and not 106
requiring artificial drainage), representing the dominant contrasting soil types in England and 107
Wales (Avery, 1980). Around 56% of lowland soils in England and Wales have topsoil 108
textures that are either sandy loam or clay loam (Anthony, 2006). The model outdoor pig farm 109
was restricted to the sandy loam soil as such enterprises are only suited to free-draining sites. 110
For farms on clay loam soil, an expert judgement approach was used to decide on the 111
6 have an effective drainage system installed, but only two-thirds of fields on the dairy farm and 113
one-third on the suckler beef farm. Sandy loam soils were assumed to be at risk of capping 114
(Catt et al., 1998; Chambers et al., 2000), with the result that surface run-off would be greater 115
than from the clay loam soil but with less transport of suspended soil particles. 116
Estimates of baseline losses and the effectiveness of mitigation methods 117
The first stage of the estimations was to determine baseline pollutant losses for each of the 118
farms in the absence of any mitigation methods. The NITCAT (Lord, 1992), NCYCLE 119
(Scholefield et al., 1991), MANNER (Chambers et al., 1999) and SLIMMER (Anthony et al., 120
1996) models were used to estimate nitrate-N losses and the PSYCHIC model (Davison et al., 121
2008) for P losses for each area of the farm under a particular management regime. These 122
were validated using field experimental evidence (e.g. Oliver et al., 2005) and combined to 123
obtain an overall, average loss for the whole farm area (in kg/ha/year). 124
There was less information from research studies about losses of FIOs and therefore 125
greater uncertainty about our estimates. An expert judgement approach was used, largely 126
based upon work undertaken in previous Defra projects (Defra, 2004b; Defra, 2005) but 127
consulting with experts from outside the project team when necessary. FIO losses were 128
expressed in terms of relative units where the baseline loss for the model dairy farm on a clay 129
loam soil was arbitrarily set at 100 units/ha; made up of 40 units arising from livestock 130
grazing in the field, 40 units from landspreading of manure, 10 units from hard standings, 131
tracks, etc. and 10 units from excreta deposited directly into watercourses. All other model 132
farm types were referenced to this. 133
The estimated baseline losses are summarised in Table 2. The lowest losses of N and P 134
were from the model suckler beef farm and the largest from the outdoor pig unit, which also 135
7 were much smaller losses of FIOs from farm types that applied farmyard manure (FYM) 137
because FYM was assumed to be stored long enough for most organisms to die off before the 138
material was spread. FIO losses would have been higher if these farms had been assumed to 139
apply fresh manures or slurry. Losses of N were slightly greater for the model farms on the 140
sandy loam soil than on clay loam while losses of P and FIOs were appreciably higher on the 141
clay loam soil. 142
The effectiveness of the mitigation method was estimated by first dividing the baseline 143
loss for each model farm between components originating from the soil, from manure and 144
excreta and from fertiliser. These components were then used as the basis for determining the 145
likely reduction in losses arising from the introduction of each of the mitigation methods. 146
Initial estimates of impacts on N and P losses were taken from the previous Defra projects 147
(Defra, 2004a, 2005; Haygarth et al., 2009) and an expert judgement approach used to 148
estimate likely reductions in losses of FIOs. Because the earlier projects focussed on 149
individual pollutants, not all of the methods were included in each report or they sometimes 150
differed in detail from those described in the ‘User Manual’. In these cases, it was necessary 151
to estimate the effectiveness using the most closely analogous method and an expert 152
judgement of the weighting to be applied. Reductions in N and P losses were expressed in 153
kg/ha/year, whereas for FIOs the reductions were given as a percentage of the baseline loss 154
(to the nearest 10%). 155
In the ‘User Manual’, the effectiveness was summarised in a table for each method, 156
listing the reduction in nitrate-N, total P and FIO losses at the farm scale and the baseline loss 157
for each farm type on the sandy loam and clay loam soils (except for those farms where the 158
method was not applicable). Reductions in P losses only referred to the short-term effect; 159
8 slow decline in soil P contents, but because of the uncertainties in these estimates, they were 161
not quantified in the ‘User Manual’. 162
Estimates of baseline costs and the costs of implementing the mitigation methods 163
Estimates of the cost of implementing each method were determined for each of the model 164
farm types. Costs could be trading costs in terms of impacts on productivity, variable costs 165
such as feed and fertiliser, fixed costs such as machinery and labour, management time or 166
capital costs, which required converting to an annual value as appropriate for the different 167
methods. Where a method resulted in land not being farmed, this could lead to a loss of 168
support payments but this was not assumed in the estimates. Similarly, the costs did not 169
include any impacts on the agricultural supply industry arising from reductions in stocking 170
rates or in the area of land farmed. All estimates were based on typical costs as in autumn 171
2006. In the ‘User Manual’, costs were presented for each method as a table with cost per ha 172
and averaged over the whole farm area and, where appropriate, as capital and annual costs. 173
Expert elicitation 174
The development phase involved a structured set of expert elicitation workshops with invited 175
expert research scientists to assess baseline losses and the cost and effectiveness of methods 176
for each pollutant and each model farm. The assessment was carried out iteratively with both 177
estimation and checking phases to validate outputs. The resulting values were documented by 178
the project scientists and entered into a ‘farm library’ spreadsheet for use in the final ‘User 179
Manual’. Defra representatives also attended inception and mid-term meetings to represent 180
the ‘end-user’ and provide some surety that what was being delivered would meet their needs. 181
At a late stage of the work a near-final draft of the ‘User Manual’ was circulated to Defra and 182
industry stakeholders and their comments incorporated into the final version. 183
Results
9 Description of the ‘User Manual’
185
The ‘User Manual’ (Cuttle et al., 2007) contained 44 control measures, selected by the expert 186
group as the most cost-effective of the 57 potential methods identified by the earlier reviews. 187
These are listed in Table 3 and, as in the ‘User Manual’, grouped into six categories based on 188
whether they involved a change in land use, soil management, livestock management, 189
fertiliser management, manure management or a change to farm infrastructure. 190
Overall, the ‘User Manual’ provided a succinct description of the range of mitigation 191
methods, their cost-effectiveness and applicability. Each method was described separately 192
using the same form of presentation for each, with information provided under the following 193
headings: 194
Description. Details of the actions to be taken to implement the method. 195
Rationale. The broad reason for adopting the method as a means of reducing pollution. 196
Mechanism of action. A description of the processes leading to a reduction in pollution. 197
Potential for applying the method. An assessment of the UK farming systems, regions, soils 198
and crops to which the method is most applicable. 199
Practicability. An assessment of how easy the method is to adopt, how it may impact on other 200
farming practices, problems with maximising effectiveness and possible resistance to uptake. 201
Costs. A table of how much it would cost to implement the method in terms of investment and 202
operational costs. 203
10 Other benefits or risk of pollution swapping. An assessment of wider environmental benefits 205
and how emissions of other pollutants might be reduced or increased if the method were to be 206
adopted. 207
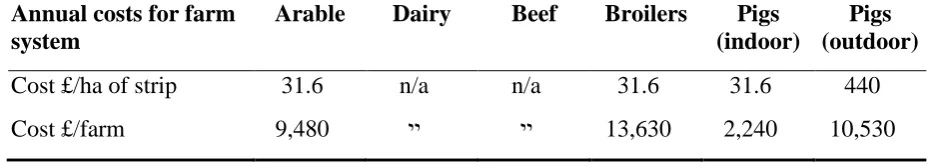
As an example of the format, the entry for Method 9, establishing in-field grass buffer 208
strips, is presented in Table 4. In this example, the table of costs did not include the arable 209
with manure farm because costs were assumed to be similar to those for the arable farm. 210
Similarly, there were no values for the dairy and suckler beef farms in the cost or 211
effectiveness tables because Method 9 was not applicable to these all-grass farms. The higher 212
cost of implementing this measure on the outdoor pig farm arose from the additional need for 213
a pig-proof fence on both sides of the strip. This was the only method where the reduction in 214
P loss was greater for the farms on sandy loam than on clay loam soil, even though baseline 215
losses were appreciably larger on the clay loam soil. 216
Comparisons between farm types and methods 217
When the full range of methods were compared there were large differences in their estimated 218
cost and effectiveness and between farm types. The potential for reducing losses was greatest 219
on those model farms with the highest baseline losses but there were differences in the extent 220
to which the various methods could be applied to the different farm types. Although the 221
outdoor pig farm was the most polluting of the model farms, only 18% of the 44 methods 222
were applicable to this farm type, compared with 66% for the indoor pig and broiler chicken 223
farms. The methods in the soil management category were most applicable to the various 224
arable types of farm, with only Methods 10 (loosen compacted soil layers in grassland) and 12 225
(allow field drainage systems to deteriorate) being applicable to the dairy and suckler beef 226
farm types. Examples of the variation in cost and effectiveness are shown in Figure 1 for the 227
model dairy farm and indoor pig farm, on a clay loam and sandy loam soil, respectively. The 228
11 for FIOs. Only the methods that were applicable to the particular farm type are shown,
230
arranged in order of increasing cost. It is apparent that the relative order of methods differs for 231
the two farms and absolute costs for some methods, as £/ha, are much higher for the indoor 232
pig farm. 233
When considered over all the farm types, a small number of the methods were 234
particularly effective at reducing losses, often of more than one pollutant, but these were 235
generally high-cost options (Methods 1, 13, 30 and 37). However, there were also methods of 236
intermediate effectiveness but only low to moderate cost (e.g. Methods 25, 27, 35, 43 and 44) 237
and a few that provided a ‘win-win’ solution, reducing pollution while at the same time 238
achieving a cost saving for the farmer, either through reducing cultivation costs (Method 4) or 239
fertiliser costs (Methods 20 and 22). Many methods, including most of the soil management 240
methods, achieved only a small reduction in pollutant loss, but were relatively cheap to 241
implement. The most effective soil management methods were Methods 2 (establish cover 242
crops in autumn) and 9 (establish buffer strips). Method 9 was particularly effective at 243
reducing losses of P on sandy loam soils and of FIOs from the outdoor pig farm (Table 4), but 244
in all other respects Method 2 was as effective and at appreciably lower cost. In contrast, the 245
least effective of all methods was Method 11 (maintaining soil organic matter contents in 246
arable fields). This was relatively costly to implement, slightly increased losses of N and FIOs 247
and would only be expected to reduce P losses and improve soil quality in the longer term. 248
The consideration of all three pollutants together helped provide a better assessment of 249
the overall cost-effectiveness of each method, though there was no attempt to present this as a 250
single effectiveness score. The additional information about possible impacts on other 251
pollutants also contributed to this wider assessment, by indicating additional benefits or a risk 252
of ‘pollution swapping’ increasing other forms of pollution. For example, Method 12 253
12 increase denitrification and associated nitrous oxide emissions. Similarly, Method 14
255
(reducing the length of the grazing season) would reduce N, P and FIO losses to water but at 256
the whole-farm scale may increase gaseous emissions of ammonia and methane. 257
Discussion
258
Limitations of the ‘User Manual’ 259
The ‘User Manual’ was successful in providing provisional estimates of cost and 260
effectiveness in an accessible form; nevertheless, there were a number of unavoidable 261
limitations to its content and application. It is useful to express the estimates of cost and 262
effectiveness at the whole-farm level as this is the scale at which the methods are 263
implemented; however, whole-farm values are reliant on the particular properties of the farms 264
for which they are determined. Hence, the estimates in the ‘User Manual’ were only strictly 265
valid for farms matching the defined model farm types and cannot be representative of the full 266
range of farms found within a particular farming sector or of different soils and climate zones. 267
For example, the model dairy farm was defined as an all-grass farm, but if the description had 268
allocated part of the area to growing forage maize or cereals this would have changed the 269
baseline losses and several additional methods targeted at arable land would have become 270
applicable. Similarly, baseline losses and the cost and effectiveness of many methods were 271
sensitive to the proportion of the farm contributing to the loss and to which the method could 272
be applied; for example, the area of land susceptible to run-off or bordering a watercourse. 273
Actual farms also differ in the extent to which mitigation methods have already been adopted, 274
with fewer opportunities for improvements in water quality on those farms that have already 275
applied some controls. In addition, the ‘User Manual’ only considered the cost-effectiveness 276
13 Manual’ noted where particular methods were incompatible but it was beyond its scope to 278
quantify the combined cost and effectiveness of combinations of methods. 279
Estimates of cost are subject to further uncertainty because there are likely to be 280
different ways of implementing any particular method, even within a single farm, and their 281
costs may differ from those assumed in the ‘User Manual’. As the ‘User Manual’ makes clear, 282
the estimates of cost and effectiveness only apply to the model farms and cannot be simply 283
extrapolated to the whole of a farming sector across farms of different sizes and in different 284
regions. 285
Further uncertainty arose from the difficulties of extending results from what was 286
often a limited number of research studies to a whole-farm scale and to different soils. This 287
particularly affected estimates of FIO losses, but for some methods there was a lack of 288
information about all three pollutants; for example, there was little practical experience of 289
operating artificial wetlands on UK farms (Method 44). Expert elicitation was a satisfactory 290
procedure for dealing with these situations where evidence was lacking. However, since the 291
preparation of the original ‘User Manual’ there has been recognition of the need for greater 292
accountability in the elicitation process and quantification of the inherent uncertainty in the 293
estimates obtained (Kreuger et al., 2012). Although the ‘User Manual’ did not attempt to 294
provide a measure of the uncertainty attached to the individual estimates, the differences 295
between effective and ineffective methods were often sufficient for these limitations to be of 296
secondary importance. 297
Use of the ‘User Manual’ and its further development 298
The ‘User Manual’ has been used by policy makers in Defra, by the Environment Agency and 299
by Catchment Officers providing advice to farmers as part of the CSF Programme designed to 300
14 Manual’ was also an important source of information that was used with data from other 302
countries to produce an on-line, Europe-wide register of methods for controlling DWPA 303
(Schoumans et al., 2011). 304
More recent work for Defra has produced an updated and extended version of the 305
‘User Manual’. This ‘User Guide’ (Newell-Price et al., 2011) retained a similar format to the 306
‘User Manual’, but included a wider range of pollutants and a greater number of potential 307
mitigation methods, including methods for controlling gaseous pollutants. It addressed several 308
of the limitations of the earlier ‘User Manual’ by including a wider range of model farm types 309
and rainfall zones. It also recognised the high uncertainty associated with the estimates of 310
effectiveness and presented these as a broad effectiveness range rather than attempting to 311
assign specific values. Alongside this, a decision support tool, FARMSCOPER (Gooday et 312
al., 2014), was developed for farmers and advisors to assess pollutant losses from the farm 313
and quantify the impacts of mitigation methods. This model allows greater customisation of 314
the farm systems to better describe actual farms and environmental conditions. It also has the 315
ability to examine the effectiveness of combinations of methods and also takes account of 316
uncertainties to allow selection of those methods that provide the greatest chance of success. 317
Opinions of catchment officers and advisors using the ‘User Manual’ in the field 318
In 2015, a number of users were asked a series of questions about the ‘User Manual’ and 319
subsequent ‘User Guide’. The contributors included Catchment Sensitive Farming Officers, 320
River Basin Co-ordinators, Catchment Officers of Rivers Trusts and Environment Agency 321
staff. Users stated that the ‘User Manual/User Guide’ was key to their work, giving structure 322
in advice and in catchment planning. For those new to the subject, it provided a very good 323
introduction to DWPA issues and helped them to select the most relevant mitigation methods 324
15 The more experienced officers tended to use the ‘User Manual/User Guide’ less
326
frequently with time, although it was still used as a reference and to provide a benchmark. 327
Individual interpretation is critical for each farm situation and the ‘User Manual/User Guide’ 328
was used by officers to build up a picture of the farm, its place in the catchment, changes in 329
pollution pressures over the seasons and the farmer’s attitude to various mitigation methods. 330
Cost-effectiveness values play a large part in convincing farmers to take up mitigation 331
methods. Implementation of methods is significantly influenced by grant support, where 332
available, which is targeted at the main contributors to DWPA within CSF priority 333
catchments. However, although for many farmers capital grants have provided an introduction 334
to controlling DWPA, they account for a minor proportion of method implementation overall. 335
Conclusions
336
The ‘User Manual’ was successful in bringing together research data, expert opinion and 337
advisory experience from a wide range of sources to provide succinct information on DWPA 338
mitigation. The ‘User Manual’ and later ‘User Guide’ provide useful information to aid 339
selection of methods at the field and farm scale. A limitation to the approach was that 340
estimates of baseline pollutant losses and the cost-effectiveness of methods only applied to 341
the model farms and climate described in the ‘User Manual’. Extending the information to the 342
catchment and wider scales and to different environmental conditions can only be addressed 343
through the greater flexibility of computer models such as the FARMSCOPER tool. In future 344
versions of the ‘User Guide’ there may also be scope for greater consideration of socio-345
economic factors affecting the acceptability and uptake of mitigation methods by farmers. 346
347
Acknowledgements
16 The funding provided by Defra and the feedback provided by Catchment Sensitive Farming 349
Officers, River Basin Co-ordinators, Catchment Officers of Rivers Trusts and Environment 350
17
References
352
Anthony, S.G., Quinn, P. & Lord, E.I. 1996. Catchment scale modelling of nitrate leaching. 353
Aspects of Applied Biology, 46, 23-32. 354
Anthony, S.G. 2006. Cost and effectiveness of policy instruments for reducing diffuse 355
agricultural pollution. Final report for Defra projects WQ0106 and ES0205. ADAS, 356
Wolverhampton, 119 pp. 357
Avery, B.W. 1980. Soil Classification for England and Wales (Higher Categories). Soil 358
Survey Technical Monograph, 14. Harpenden. 359
Catt, J.A., Howse, K.R., Farina, R., Brockie, D., Todd, A., Chambers, B.J., Hodgkinson, R., 360
Harris, G.L. and Quinton, J.N. (1998). Phosphorus losses from arable land in England. Soil 361
Use and Management, 14, 168-174. 362
Chambers, B.J., Lord, E.I., Nicholson, F.A. & Smith, K.A. 1999. Predicting nitrogen 363
availability and losses following application of organic manures to arable land: MANNER. 364
Soil Use and Management, 15, 137-143. 365
Chambers, B. J., Garwood, T. W. D. & Unwin, R.J. 2000. Controlling soil water erosion and 366
phosphorus losses from arable land in England and Wales. Journal of Environmental Quality, 367
29, 145-150. 368
Cherry, K.A., Shepherd, M., Withers, P.J.A. & Mooney, S.J. 2008. Assessing the 369
effectiveness of actions to mitigate nutrient loss from agriculture: a review of methods. 370
Science of the Total Environment, 15, 1-23. 371
Cuttle, S., Macleod, C., Chadwick, D., Scholefield, D., Haygarth, P., Newell-Price, P., Harris, 372
D., Shepherd, M., Chambers, B. & Humphrey, R. 2007. An Inventory of Methods to Control 373
18 ES0203. Available at:
375
http://randd.defra.gov.uk/Document.aspx?Document=es0203_4145_FRA.pdf; accessed 376
27/9/2015. 377
Davison, P., Withers, P., Lord, E., Betson, M. & Stromqvist, J. 2008. PSYCHIC - A process 378
based model of phosphorus and sediment mobilisation and delivery within agricultural 379
catchments. Part 1 – Model description and parameterisation. Journal of Hydrology, 350, 290-380
302. 381
Defra. 2004a. Cost curve of nitrate mitigation options. Final report forproject NT2511. 382
Available at: 383
http://randd.defra.gov.uk/Default.aspx?Module=More&Location=None&ProjectID=11431; 384
accessed 27/9/2015. 385
Defra. 2004b. Investigations of the routes by which pathogens associated with livestock 386
slurries and manure may be transferred from the farm to the wider environment. Final report 387
for project WA0804. Available at: 388
http://randd.defra.gov.uk/Document.aspx?Document=WA0804_3190_FRP.doc; accessed 389
27/9/2015. 390
Defra. 2005. COST-DP: Cost effective diffuse pollution mitigation. Final report for project 391
ES0121. Available at: 392
http://randd.defra.gov.uk/Document.aspx?Document=ES0121_3701_FRP.doc; accessed 393
27/9/2015. 394
EU. 2000. Water Framework Directive. Directive 2000/60/EC of the European Parliament 395
and of the Council of 23 October 2000 (OJ L 327, 22 December 2000). Available at: 396
19 Haygarth P.M. & Jarvis S.C. (eds.) 2003. Agriculture, Hydrology and Water Quality. CAB 398
International Wallingford UK. 399
Haygarth, P. M., ApSimon, H., Betson, M., Harris, D., Hodgkinson, R., & Withers, P. J. A. 400
2009. Mitigating diffuse phosphorus transfer from agriculture according to cost and 401
efficiency. Journal of Environmental Quality, 38, 2012-2022. 402
Gooday, R.D., Anthony, S.G. Chadwick, D.R., Newell-Price, J.P., Harris, D., Duethmann, D., 403
Fish, R., Collins, A.L. & Winter, M. 2014. Modelling the cost-effectiveness of mitigation 404
methods for multiple pollutants at farm scale. Science of the Total Environment, 468, 1198-405
1209. 406
Goodlass, G. & Allin, R. 2004. British Survey of Fertiliser Practice: Fertiliser Use on Farm 407
Crops for Crop Year 2003. Defra/SEERAD. ISBN 1 86190 127 5. 408
Krueger, T., Page, T., Hubacek, K., Smith, L., & Hiscock, K. 2012. The role of expert opinion 409
in environmental modelling. Environmental Modelling & Software, 36, 4-18. 410
Lord, E.I. 1992. Modelling of nitrate leaching: Nitrate Sensitive Areas. Aspects of Applied 411
Biology, 30, 19-28. 412
Macleod, C.J.A., Blackstock, K.L. & Haygarth, P.M. 2008. Mechanisms to improve 413
integrative research at the science-policy interface for sustainable catchment management. 414
Ecology and Society, 13, Article 48. Available at:
415
http://www.ecologyandsociety.org/vol13/iss2/art48/; accessed 27/9/2015. 416
MAFF. 2000. Fertiliser Recommendations for Agricultural and Horticultural Crops (RB209). 417
7th edition. The Stationery Office Norwich UK. 418
Natural England. 2013. CSF052: Working towards Catchment Sensitive Farming. Available 419
20 Newell-Price, J.P., Harris, D., Taylor, M., Williams, J.R., Anthony, S.G., Duethmann, D., 421
Gooday, R.D., Lord, E.I., Chambers, B.J., Chadwick, D.R. & Misselbrook, T.H. 2011. 422
Mitigation Methods - User Guide. An Inventory of Mitigation Methods and Guide to their 423
Effects on Diffuse Water Pollution, Greenhouse Gas Emissions and Ammonia Emissions 424
from Agriculture. Prepared as part of Defra project WQ0106. Available at: 425
http://randd.defra.gov.uk/Document.aspx?Document=MitigationMethods-426
UserGuideDecember2011FINAL.pdf; accessed 27/9/2015. 427
Oliver, D. M., Heathwaite, L., Haygarth, P. M., and Clegg, C. D. 2005. Transfer of 428
Escherichia coli to water from drained and undrained grassland after grazing. Journal of 429
Environmental Quality, 34, 918-925. 430
Scholefield, D. Lockyer, D., Whitehead, D. & Tyson, K. 1991. A model to predict 431
transformations and losses of nitrogen in UK pastures grazed by beef cattle. Plant and Soil, 432
132, 165-177. 433
Schoumans, O.F. (Ed.), Chardon, W.J. (Ed.), Bechmann, M., Gascuel-Odoux, C., Hofman, 434
G., Kronvang, B., Litaor, M.I., Lo Porto, A, Newell-Price, P. & Rubaek, G. 2011. Mitigation 435
options for nutrient reduction in surface waters and groundwaters. A study amongst European 436
member states of Cost action 869. Alterra Report 2141. Alterra, Wageningen, The 437
Netherlands. Available at: http://www.cost869.alterra.nl/Report2141.pdf; accessed 27/9/2015. 438
Sharpley, A.N., Withers, P.J.A., Abdalla, C.W. & Dodd, A.R. 2005. Strategies for the 439
sustainable management of phosphorus. In: Phosphorus: Agriculture and the Environment 440
(eds J.T. Sims & A.N. Sharpley), Agronomy Monograph 46, American Society of Agronomy 441
Madison WI, pp 1069 - 1101. 442
Shepherd, M.A. & Chambers, B.J. 2007. Managing nitrogen on the farm: the devil is in the 443
21 Smith, K.A., Brewer, A.J., Crabb, J. & Dauven, A. 2000. A survey of the production and use 445
of animal manures in England and Wales: 1. Pig manure. Soil Use and Management, 16, 124-446
132. 447
22
TABLES
449
Table 1 Summary characteristics of the model farm types used for estimating the costs and
450
effectiveness of the mitigation methods. 451
Farm type
Total field area
(ha)
Cropping & livestock Average fertiliser-N
(kg N/ha) Arable
farm
300 Mixed combinable crops. 165
Arable farm with manure
300 Mixed combinable crops: 60 ha received imported solid FYM or pig slurry.
165 or 140 with
manure Dairy
farm
150 All-grass (grazing & silage). Bought-in
concentrates. 150 adult dairy cows + 120 followers. Stock housed in winter with excreta managed as slurry and dirty water.
190
Suckler beef farm
100 All-grass (grazing & silage). Bought-in
concentrates. Spring-calving herd (80 cows, 70 calves, 70 yearlings). Stock in concrete yards during winter. Excreta + straw bedding managed as FYM.
100
Broiler chicken farm
437 150,000 bird places. Litter managed as solid
manure and spread on adjoining arable land. Mixed combinable crops.
145
Indoor pig farm
71 290 dry sow, 60 farrowing sow, 585 first stage weaner and 565 second stage weaner places. Excreta managed as slurry and spread on adjoining arable land. Mixed combinable crops.
145
Outdoor pig farm
24 Places for 500 dry sows, 92 farrowing sows and 1,944 first stage weaners. All feed bought-in. Sows have access to whole field area.
0
[image:22.595.70.541.169.632.2]23
Table 2 Estimated baseline losses of N, P and FIOs for the model farms with no mitigation
453
methods applied, on sandy loam and clay loam soils. 454
455
Baseline loss at the farm scale
Farm type Nitrate (kg N/ha) Total P (kg P/ha) FIOs (relative units)
sandy loam clay
loam sandy loam clay loam sandy loam clay loam
Arable 51 47 0.3 2.3 0 0
Arable +
manure 57 51 0.4 2.5 1 1
Dairy 61 34 0.2 2.8 36 100
Beef 18 12 0.2 1.0 15 43
Broilers 82 68 0.4 3.2 0 0
Indoor pigs 89 74 0.5 3.7 4 10
24
Table 3 Mitigation methods selected for inclusion in the ‘User Manual’.
456
Category No. Method
Land use 1 Convert arable land to extensive grassland
Soil management 2 3 4 5 6 7 8 9 10 11 12
Establish cover crops in the autumn
Cultivate land for crop establishment in spring rather than autumn Adopt minimal cultivation systems
Cultivate compacted tillage soils Cultivate and drill across the slope Leave autumn seedbeds rough Avoid tramlines over winter
Establish in-field grass buffer strips
Loosen compacted soil layers in grassland fields Maintain and enhance soil organic matter levels Allow field drainage systems to deteriorate
Livestock management 13 14 15 16 17 18
Reduce overall stocking rates on livestock farms Reduce the length of the grazing day or grazing season Reduce field stocking rates when soils are wet
Move feed and water troughs at regular intervals Reduce dietary N and P intakes
Adopt phase feeding of livestock
Fertiliser management 19 20 21 22 23 24
Use a fertiliser recommendation system Integrate fertiliser and manure nutrient supply Reduce fertiliser application rates
Do not apply P fertilisers to high P index soils Do not apply fertiliser to high-risk areas
Avoid spreading fertiliser to fields at high-risk times
Manure management 25 26 27 28 29 30 31 32 33 34 35 36 37 38
Increase the capacity of farm manure (slurry) stores Minimise the volume of dirty water produced Adopt batch storage of slurry
Adopt batch storage of solid manure Compost solid manure
Change from slurry to a solid manure handling system
Site solid manure heaps away from watercourses and field drains Site solid manure heaps on concrete and collect the effluent Do not apply manure to high-risk areas
Do not spread farmyard manure to fields at high-risk times
Do not spread slurry or poultry manure to fields at high-risk times Incorporate manure into the soil
Transport manure to neighbouring farms Incinerate poultry litter
Farm infrastructure 39 40 41 42 43 44
Fence off rivers and streams from livestock
Construct bridges for livestock crossing rivers and streams Re-site gateways away from high-risk areas
Establish new hedges
Establish riparian buffer strips
25
Table 4 Example of the format used to describe each method in the ‘User Manual’: Method 9.
458
Establish in-field grass buffer strips. 459
9. Establish in-field grass buffer strips
Description: On sloping fields, establish grass buffer strips along the land contour, in valley
bottoms or on upper slopes to reduce and slow down surface flow. Cut regularly in the first 12 months to control annual weeds and encourage grasses to tiller.
Rationale: In-field buffer strips can reduce P and, where manures are applied to tillage land,
FIO losses by slowing run-off and intercepting the delivery of sediment.
Mechanism of action: An in-field buffer strip is a vegetated strip of land, located along the land
contour, on upper slopes or in valley bottoms. It is usually a permanent feature, although it can be temporary. The Entry Level Environmental Stewardship Scheme† offers options for strips between 2 and 6 m in width. Also, under the Higher Level Stewardship Scheme†, there is the option to establish in-field grass areas to prevent erosion and run-off (with a maximum permissible area of 30% of each field).
The strip acts as a natural buffer to reduce the transfer of diffuse pollutants in surface run-off from agricultural land to water. Buffer strips can act as a sediment-trap, as well as helping to reduce nutrient and pesticide losses in run-off. The strip has no effect on nitrate other than pro rata for the area taken out of production (i.e. the buffer strip is similar to unfertilised grass).
Potential for applying the method: In-field buffer strips are applicable to all arable farming
systems on sloping land. They are particularly suited to fields with long slopes, where high volumes of surface run-off can be generated.
Practicability: The buffer strips will reduce the length of fields, but increase the time taken for
field operations by around 10%. They are reasonably acceptable to farmers who are keen to improve the environmental potential of their farm and are compatible with the Entry Level and Higher Level Environmental Stewardship schemes. They may be more effective when combined with additional riparian buffer strips (Method 43).
Cost: It has been assumed that 10% of the farm area will be put into buffer strips (see Appendix
II).
Annual costs for farm system
Arable Dairy Beef Broilers Pigs
(indoor)
Pigs (outdoor)
Cost £/ha of strip 31.6 n/a n/a 31.6 31.6 440
Cost £/farm 9,480 ײ ײ 13,630 2,240 10,530
(continued)
†
These schemes were replaced by the Countryside Stewardship Scheme in 2015 460
26
Table 4 (continued) Example of the format used to describe each method in the 'User
462
Manual’: Method 9. Establish in-field grass buffer strips.
463
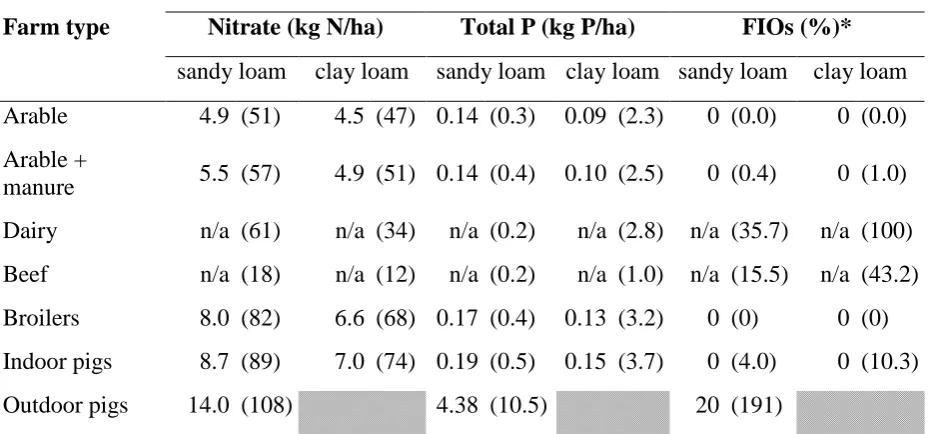
Effectiveness:
N: The benefit will be from taking land out of production and will be confined to the area of the buffer strip. The nitrate loss from the strip will be similar to that from ungrazed, zero-N
grassland. The buffer strips are assumed to occupy 10% of the farm area; the reduction in leaching at the farm scale will therefore be 10% of the arable reversion value for the particular model farm system and soil type (see Method 1(a)).
P: PE0203 Method 40 ‘Grass buffers’ was used, as applied to the all-arable and grassland scenarios. After adjusting for the expert weighting, this reduced the overall P loss by 40% on both soil types. The benefit was confined to the 10% buffer strip area on the clay loam soil but was effective over 100% of the area on the sandy loam.
FIOs: <10% reduction. Even without the mitigation method, losses of FIOs from arable land are
generally small because the storage period for manures is sufficient for most organisms to die-off before spreading and manures are then ploughed in after application.
Reduction in pollutant loss at the farm scale
(baseline loss for the farm type is shown in parentheses)
Farm type Nitrate (kg N/ha) Total P (kg P/ha) FIOs (%)*
sandy loam clay loam sandy loam clay loam sandy loam clay loam Arable 4.9 (51) 4.5 (47) 0.14 (0.3) 0.09 (2.3) 0 (0.0) 0 (0.0) Arable +
manure 5.5 (57) 4.9 (51) 0.14 (0.4) 0.10 (2.5) 0 (0.4) 0 (1.0) Dairy n/a (61) n/a (34) n/a (0.2) n/a (2.8) n/a (35.7) n/a (100) Beef n/a (18) n/a (12) n/a (0.2) n/a (1.0) n/a (15.5) n/a (43.2) Broilers 8.0 (82) 6.6 (68) 0.17 (0.4) 0.13 (3.2) 0 (0) 0 (0) Indoor pigs 8.7 (89) 7.0 (74) 0.19 (0.5) 0.15 (3.7) 0 (4.0) 0 (10.3)
Outdoor pigs 14.0 (108) 4.38 (10.5) 20 (191)
*Baseline losses for FIOs are in relative units, where the loss from the dairy farm system on a clay loam soil = 100 units. Reductions are shown as percentages of the baseline FIO loss.
Other benefits or risk of pollution swapping: Buffer strips can also reduce the transfer of
BOD and ammonium-N to surface waters by intercepting organic matter in surface run-off. The risk of pollution is increased if fertiliser or manure is spread on the buffer strips and if the buffer strips are used for regular access, turning or storage.
27
FIGURE CAPTION
466
Figure 1 Estimates of the reduction in losses of nitrate-N, phosphorus and FIOs as a
467
percentage of the baseline loss for the mitigation methods applied to (a) the model dairy farm 468
(on clay loam soil) and (b) the indoor pig farm (on sandy loam soil) and the annual cost of the 469
methods, arranged in order of increasing cost. Where costs are negative this represents a 470