Temperature Dependency of Diffusional Transformation Texture Development
in Steel Sheet
Yasuaki Tanaka
1,2,3,*1, Tomonari Inamura
1,2, Hideki Hosoda
1,2, Yoshihiro Suwa
3and Toshiro Tomida
4,*2 1Laboratory for Materials and Structures, Institute of Innovative Research, Tokyo Institute of Technology, Yokohama 226–8503, Japan 2Laboratory for Future Interdisciplinary Research of Science and Technology (FIRST), Institute of Innovative Research, Tokyo Institute of Technology, Yokohama 226–8503, Japan3Technical Research & Development Bureau, Nippon Steel & Sumitomo Metal Corporation, Amagasaki 660–0891, Japan 4Nippon Steel & Sumikin Technology Co., Ltd., Amagasaki 660–0891, Japan
The temperature dependency of diffusional transformation texture development in steel sheet was investigated by electron backscatter diffraction. The site of the precipitated pro-eutectoid ferrite (PF) grains and the orientation relation with the surrounding austenite (γ) phase were affected by the transformation temperature. The PF on the triple junction, which has a Kurdjumov-Sachs relation (K-S) with the two surrounding γ phases (double K-S [DKS] relation) with high probability, predominated in the high-temperature transformation, whereas the PF on the grain boundary, which fulfills DKS with lower probability than the PF on triple junction, became predominant with decreasing temperature. The in-tensity of the variant selection on transformation decreased with decreasing transformation temperature. The texture predicted by the DKS model reproduced the measured PF texture, indicating that the intensity of the variant selection obeying DKS decreased with decreasing trans-formation temperature. Therefore, the intensity of the variant selection was affected by the degree of supercooling. The DKS rule operates strongly on the transformation in the high-temperature region, corresponding to a low degree of supercooling. However, the DKS rule has a small effect when the temperature decrease corresponds to a high degree of supercooling. [doi:10.2320/matertrans.M2016393]
(Received November 4, 2016; Accepted January 16, 2017; Published March 25, 2017)
Keywords: steel, variant selection, diffusional transformation, texture
1. Introduction
The crystallographic orientation relation operates between parent and product phases during transformations. This rela-tion usually has crystallographic equivalent choices, called variants due to crystal symmetries. In carbon steel, the Kurd-jumov-Sachs relation (K-S) is a specific orientation relation
between ferrite (α) and the parent austenite (γ)1,2), which has
24 variants.
If all the variants were activated equally, the predicted transformed texture would be much weaker than the
experi-mentally observed texture.3–5) Therefore, specific variants
must be favored via various mechanisms to reproduce the transformation texture quantitatively, and this variant selec-tion problem has been extensively discussed. Many studies
have modeled transformation texture development6–13) for
displacive and diffusional transformations.
Studies of the variant selection of the grain boundary pre-cipitates on the diffusional transformation texture model have frequently focused on the orientation relation between
pre-cipitates and their adjoining parent phases. As for α/β brass
in which the product α phase (fcc) nucleates on grain
bound-aries of the parent β phase (bcc), Stanford and Bate14)
report-ed that the variant selection was observreport-ed in adjacent α grains,
in which β boundary misorientation with <110>β alignment
led to the dominance of variants with similar <111>α
align-ment on either side of the boundaries. Ameyama et al.15,16)
found that specific variants of the K-S are favored in the γ
precipitation from the parent α phase at grain boundaries in
dual-phase stainless steel, in which the parallel plane among
the closed-packed {111}β planes to the grain boundary plane
is favored and the opposite plane has the best coherency with
the γ phase. Tomida et al.17) proposed a selection rule, in
which the variants that fulfill or nearly fulfill the K-S with two adjoining parent grains nucleate preferentially, and the rule quantitatively predicted the transformation texture of
hot-rolled sheet steel. Lischewski and Gottstein18) have
re-ported that the preferred nucleation at a grain boundary near a triple junction requires an orientation relation close to the
K-S on both sides of the adjacent grains, and a {110}
body-cen-tered cubic (bcc) plane parallel with the interface boundary
plane. Their result for the α to γ phase transformation in the
steel alloy obtained via in situ observation by electron back-scatter diffraction (EBSD) agrees with the results of
Ameya-ma and colleagues15,16) and Tomida et al.,17) in that the nuclei
tend to select the lowest energy state at the interface bound-ary.
Although there is much interest in the connection between the variant selection and the orientation relation of the prod-uct phase with the neighboring parent phases, the transforma-tion temperature dependency of the variant selectransforma-tion under the diffusive mechanism has not been thoroughly
investigat-ed, especially the γ-α transformation in carbon steel.
Furuha-ra et al.19) have investigated the orientation relationships of
the grain boundary ferrite with respect to the adjacent austen-ite grains in Fe-Mn-C alloy that was isothermally heat-treated at the temperatures of 550, 600 and 720 C. The experimental results in the high temperature region beyond 720 C are, however, not sufficient. Therefore, it is important for manu-facturing that the effect of transformation temperature on tex-ture development is examined because the textex-ture affects the properties of steel produced by various thermal processes. According to heterogeneous nucleation theory, the nucleation site is affected by the degree of supercooling. In other words,
*1
Graduate Student, Tokyo Institute of Technology, Corresponding author, E-mail: [email protected]
*2
the development of the relation between precipitates and their surrounding parent grains, which is variant selection, should be affected by the degree of the supercooling.
In the present study, we assess whether the transformation temperature affects the texture development under the diffu-sional mechanism in steel.
2. Experimental Method
2.1 Material preparation
Steel plates with the chemical composition, in which 2.0 mass% Si added for suppressing the cementite precipita-tion as shown in Table 1 were cold rolled from 6 to 3.2 mm thick. The cold rolled steel sheets were reheated into a single
γ region at 950 C for 60 s, following the intermediate
preser-vation of recrystallization at 650 C below the Ae1 tempera-ture (Fig. 1). The materials were cooled to temperatempera-tures of
890 to 650 C at 30 C/s and kept at the target temperature for
6–600 s to promote precipitation of the pro-eutectoid ferrite (PF). Next, the materials were cooled to 400 C and held at
this temperature for 10 min to stabilize the retained γ. Small
samples for the EBSD measurements were cut and electro-chemically polished on the rolling-direction–normal-direc-tion cross secrolling-direction–normal-direc-tion.
2.2 Local orientation analysis
EBSD measurements were performed on the center of the cross section. An orientation imaging microscopy (OIM) unit (Hikari, EDAX-TSL) for EBSD scanning electron microsco-py (SEM; JSM-7500F, JEOL) was used to measure the of bcc
and face-centered cubic (fcc) crystal orientations in an 800 ×
200 μm area at 0.2 μm/step. The microstructure consisted of
PF grains precipitated on the pre-transformed γ grain
bound-aries, lath-shaped bainite, and the retained γ particles, which
we assumed were preserved in the same orientation as in the high-temperature region.
We focused on the crystal orientation relations between PF
grains and their neighboring γ grains, and the orientation of
the PF grains was extracted from the measured bcc orienta-tion by the following method. In general, PF has fewer differ-ences in orientation within a grain than bainite owing to the microstructure of the lath shape. Thus, the local average
mis-orientation (LAM) method,20) which measures the local
ori-entation spread, was used to characterize the PF regions in the orientation image obtained by EBSD. LAM estimates the av-erage disorientation within the range of a maximum values between all neighboring points within the grain. The orienta-tion of the PF grains was extracted by LAM, and low
misori-entation areas of less than 0.6 in a grain area within 2 μm
from each of the measured points were detected considering
the EBSD measurement error of 0.5–1 .21) Furthermore, to
identify the site of PF precipitation, we reconstructed the
pre-transformed γ phase by using the method reported by
Réglé et al.,22) in which the retained γ particles were extended
until they touched the other particles.
The extracted PF data were overlaid on the reconstructed γ
data, the orientation imaging data for the intermediate stage
of the γ-to-α transformation were reconstructed, and the
ori-entation relation between PF and the surrounding γ phase was
estimated as follows. The calculated orientations of the 24
K-S variants based on the orientation of the surrounding γ
phase were compared with the measured PF orientation, and
the minimum orientation deviation (θmin) from the exact K-S
relation was determined. The number of PF grains fulfilling
the K-S relation with the surrounding γ phase was obtained
for θmin up to 15 based on the method of Lischewski et al.18)
The transformation temperature dependency of the
orienta-tion relaorienta-tion between PF grains and their surrounding γ grains
was investigated.
3. Results
3.1 Temperature dependency of the texture develop-ment
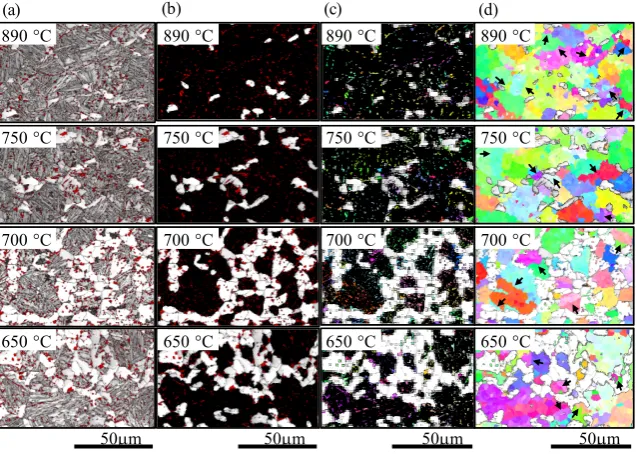
Figure 2(a) shows examples of the orientation images of the materials obtained by isothermal heat treatment at several temperatures. The microstructure consists of PF (white), the
retained γ particles (red), and lath-shaped bainite. The
recon-structed orientation images of the intermediate stage of the γ
to α transformation (Fig. 2(d)) which consists of the extracted
PF and the reconstructed γ obtained by LAM (Fig. 2(b)) and
the method described by Réglé et al.22) (Fig. 2(c)) show that
the PF grains were located on the grain boundary or triple
junction of the γ phase. Therefore, the reconstruction method
was appropriate. The arrows in Fig. 2(d) indicate annealing
twin of γ.
Figure 3 compares the orientation distributions of the
mea-sured retained γ particles and the reconstructed γ grains. The
orientations of the reconstructed γ grains had a similar
distri-bution to the measured orientation. This means that the recon-struction method was successfully done without missing or enhanced orientations possibly caused in the reconstruction
method of the parent γ used in this study.
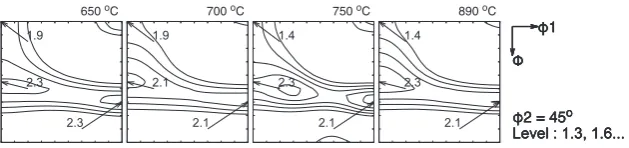
Figure 4 shows the orientation distribution function (ODF)
of the γ phase in the materials processed at various
tempera-tures. Because of the small number of γ grains, the ODF was
calculated by the spherical series expansion method with a low truncation degree (L = 7) and a Gaussian spread of 5 .
Figure 4(a) shows that the γ texture in all the materials had a
similar texture development of the fcc α-fiber, although there
were small differences in the position and intensity of the ma-jor components. The PF textures in Fig. 4(b) indicate that the Table 1 Chemical composition (mass%) of the sample.
Sample C Si Mn Al Ae1 Ae3
Steel A 0.20 2.0 2.0 0.40 706 C 907 C
bcc α-fiber and γ-fiber developed in all the materials. It was difficult to investigate the effect of the variant selec-tion on transformaselec-tion by using the absolute ODF values, ow-ing to the low intensity of the texture obtained; therefore, the
measured α texture and the calculated textures without
vari-ant selection rules (indicated in Fig. 4(c)) were compared to estimate the temperature dependency of the transformation texture development.
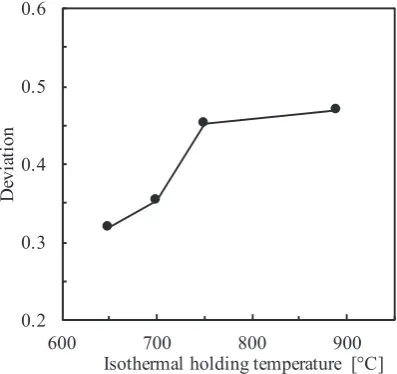
Figure 5 compares the measured bcc α-fiber profiles with
the profiles calculated by the K-S relation without variant se-lection. The orientations of the maximum intensity were sim-ilar between the measured and calculated profiles for each
temperature, suggesting that the γ and α textures were related
by the K-S relation and the differences in the profiles between
samples arose from small differences in the γ texture.
Assum-ing that the differences in the profile between the measure-ments and the calculations were due the variant selection, the root square mean deviation between the measured and
calcu-lated profiles for the α-fiber was used to estimate the
tempera-ture dependency of the textempera-ture development (Fig. 6). This was because that most of the PF grains had the K-S relation
with the neighboring parent γ as shown later. The deviation
decreased with decreasing temperature, which may weaken
the effect of the variant selection on transformation.
3.2 Temperature dependency of the PF precipitation site
Figure 7 shows the orientation images of the samples pro-cessed at several temperatures. The amount of PF grains pre-cipitated on the grain boundary increased with decreasing
transformation temperature. The equilibrium fractions of α at
each isothermal treatment temperature are summarized with measured areal fractions in Table 2. In the samples isothermal treated at 650 750 C, almost all grain boundaries of the prior
γ were covered by the PF, though the observed fraction of α
was lower than the equilibrium fraction. In the sample treated
at 820 C, the measured volume fraction of α have reached the
equilibrium value. Therefore, the orientation relationship
be-tween γ and α that precipitated at γ grain boundary was
ana-lyzed in the following sections without considering the effect
of the difference in the volume fraction of α.
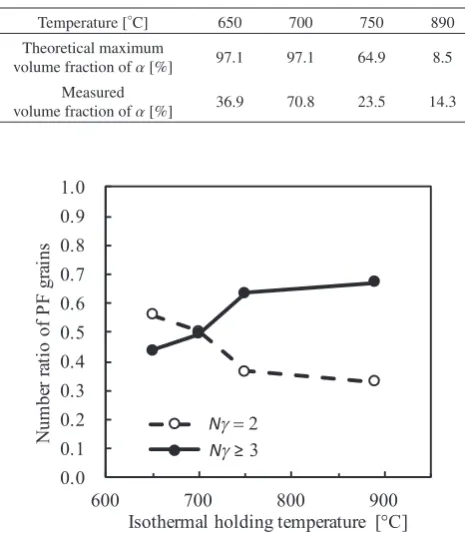
To determine the PF precipitation sites statistically, the PF grains were classified into two categories according to the
number of the neighboring γ grains (Nγ). Although cases
where the PF sites had more than four surrounding γ grains
were observed owing to the growth of the PF grains, these PF
grains were included in the Nγ ≥ 3 group. Assuming that the
observed PF grains with Nγ = 2 and Nγ ≥ 3 corresponded to
the precipitates on the grain boundary planes and the triple junctions, respectively, Fig. 8 shows that the PF precipitated on the triple junction would be dominant in the high-tempera-ture region. In contrast, the amount of PF precipitated on the grain boundary plane increased as the transformation tem-perature decreased.
Focusing on the dependency of the orientation relation
be-tween PF and its surrounding γ on the precipitation site and
the temperature, the number fraction of the PF grains fulfill-ing the K-S relation was determined. The three categories of PF grains were defined as belonging to the number of the K-S relation with a tolerance of 15 by referring to information Fig. 2 OIM images of the samples processed at several isothermal holding temperatures. (a) Image quality (IQ) map with an overlay of the γ phase map in red, (b) IQ map of the extracted PF and γ phase map, (c) IQ map of the extracted PF and the γ orientation map, and (d) IQ map of PF and the reconstructed γ orientation map. The arrows in (d) indicate the annealing twin boundaries.
[image:3.595.140.459.70.297.2] [image:3.595.69.271.357.464.2]from previous research by Lischewski et al.,18) all with their
surrounding γ grains, as follows. Single K-S (SKS): the PF
has only one surrounding γ grain fulfilling the K-S relation.
Double K-S (DKS): the PF has not less than two surrounding
γ grains fulfilling K-S relations. Non K-S (NKS): the PF has
no surrounding γ grains fulfilling the K-S relation.
Figure 9(a) summarizes the relation between the number ratio of PF grains in the NKS, SKS, and DKS categories and the precipitation site and transformation temperature. The re-lation between the K-S rere-lations and the transformation tem-perature shows that the fraction of PF obeying DKS rule in the whole material tended to decrease with decreasing
tem-perature. The precipitation site (indicated with Nγ) had a
strong effect on the K-S relations, whereas the transformation temperature had a weak effect. Furthermore, for precipitation on the grain boundary plane, the main category was SKS, as
shown for Nγ = 2. However, where precipitation occurred on
the triple junction, the main category was DKS.
Fig. 7 OIM images of the material processed by isothermal heat treatment at (a-1), (a-2) 650 C × 6 s, (b-1), (b-2) 700 C × 12 s, (c-1), (c-2) 750 C × 12 s, and (d-1), (d-2) 890 C × 200 s. (a)-2 to (d)-2: IQ maps overlaid with the inverse pole figure maps of the reconstructed γ texture.
Fig. 6 Changes in the averaged deviation from the calculated texture with-out the variant selection rule in the bcc α-fiber at various isothermal hold-ing temperatures.
Fig. 4 Comparison ODF contour maps of (a) γ, (b) α, and (c) the calculated α texture without the variant selection rule.
[image:4.595.128.473.68.293.2] [image:4.595.71.273.329.518.2] [image:4.595.327.526.333.520.2] [image:4.595.306.549.585.736.2]To examine whether these results were not an artefact
aris-ing from the arrangement of PF and γ grains, the fractions of
DKS, SKS and NKS were calculated for PF having random
orientation with respect to the observed γ grains. The
micro-structure and orientation of γ grains in Fig. 7 were kept and
then random orientation was artificially applied to all PF grains observed in Fig. 7. The result is shown in Fig. 9(b). The averaged fraction of PF fulfilling K-S (total of SKS and DKS) decreased to 60% of the measured fraction compared
with that shown Fig. 9(a). For the groups with Nγ ≥ 3, the
averaged fraction of DKS and SKS grains when the random orientation was applied were 26% and 40%, respectively. Thus, the SKS played a major role in precipitation, even on the triple junction, which was different from the measured fraction. The fraction of PF fulfilling DKS was much higher than that fulfilling SKS; therefore, the selection of the DKS rule had a much higher probability than random chance.
The experimental results can be summarized as follows. The effect of variant selection on transformation texture de-velopment was weakened as the transformation temperature decreased. The faction of PF grains that precipitated on the grain boundary plane increased, whereas the fraction of PF grains that precipitated on the triple junction decreased with decreasing transformation temperature. Therefore, the frac-tion of PF grains fulfilling the DKS rule decreased as the tem-perature decreased because the fraction of DKS grains on the grain boundary planes was a nearly half that on the triple junctions.
4. Discussion
4.1 Comparison of the predicted texture by the DKS model
The experimental result indicates that the fraction of DKS grains and the effect of the variant selection were changed by the transformation temperature. Therefore, the prediction of PF textures by the DKS model for the transformation tem-peratures was assessed. The DKS model has been described
in previous publications.17,23) The preferential selection of
variants is assumed, in which α grains nucleate on γ grain
boundaries that fulfill the K-S relation on both sides of the α
grain, although several deviations from K-S are allowed.
The variant selection function, ρg, is expressed by
Fig. 9 Relation between the number ratio of the PF grains and the isother-mal holding temperature for (a) the actual material and (b) the simulated material with randomly oriented PF grains.
Table 2 Comparison of the volume fraction between the theoretical maxi-mum estimated by the phase equilibrium calculation and the experimental data.
Temperature [ C] 650 700 750 890
Theoretical maximum
volume fraction of α [%] 97.1 97.1 64.9 8.5 Measured
volume fraction of α [%] 36.9 70.8 23.5 14.3
[image:5.595.326.524.79.328.2] [image:5.595.325.522.95.549.2] [image:5.595.51.284.100.371.2]ρ(g)= ω
N k
f(∆g−1·gck·∆g·g)+ρc(g) (1)
with the first term from DKS and the second term (ρc(g))
from the material conservation law. Δg is the rotation matrix
for the crystal rotation due to the γ-to-α transformation that
maintains the K-S relation, gc
k is the rotational operator for the
cubic symmetry group, and N is the number of variants taken
into account. N is 21 in this study; the same variant of Δg and
two variants having 10.5 of misorientation with the variant
of Δg were excluded.23) The γ and α textures expressed as the
expansion coefficient via the spherical harmonic function, γCµν
λ and
αCµν
λ, respectively, are related by
αCµν
λ =
∞
λ1=0 M(λ1)
µ=1 N(λ1)
ν1=1 γCµν1
λ1 × ∞
λ2=0 M(λ2)
ν2=1 +λ
m.s=−λ ρrν2
λ2 A(λ1λ2mr|λs){λ1λ2ν1ν2|λν}T˙˙ µs
λ∗(∆g)
(2)
where s = m + r, |λ2 − λ1| ≤ λ ≤ |λ1 + λ2|, s ≤ λ
˙˙Tµs
λ and ˙˙A
m1µ
λ1 are the symmetrically invariant functions and
related coefficients defined for the cubic symmetry of the
crystals, respectively, (λ1λ2mr|λs) and {λ1λ2ν1ν2|λν} are
Clebsch–Gordan coefficients and related coefficients,24)
re-spectively, and ρrν2
λ2 is the expansion coefficient of ρg by the
symmetrically invariant function defined for the orthorhom-bic sample symmetry, which can be written as
ρrν2
λ2 =
ω Nk
M(λ2)
µ2=1 γCµ2ν2
λ2
k ˙˙Tµ2r
λ2 (∆g −1·gc
k·∆g)
−241 i,k
˙˙Tµ2r
λ2 (∆g −1·gc
k·∆g·gci)
(3)
The value of ω corresponds to the intensity of the variant
se-lection. The proper ω value was fitted in the range of more
than 1, whereas ρg was well-defined physically for ω from 0
to around 1.23) The high ω value may arise from the weak γ
texture. Because γCµν
λ affects the variant selection function in
addition to ω, as shown in eq. (3), the weak texture of γ would
result in weak variant selection. For the austenite grains, which were fewer in number, the series truncation limit was reduced to 7 to produce a more continuous texture, although this decreased the resolution, leading to the underestimation
of γ texture development and the overestimation of ω to
re-produce the α texture. However, because the intensities of the
γ textures were similar (Fig. 4(a)), ω could be compared.
Al-though the ω value was overestimated because of the low
in-tensity of the γ textures, we considered the role of ω, which is
the intensity of the variant selection obeying DKS during the
transformation. Figure 10 shows that the proper ω values
[image:6.595.76.290.425.495.2]de-crease with decreasing temperature, which is a similar trend to the fraction of PF grains fulfilling the DKS as shown in Section 3.2.
Figure 11 shows the ODF contour maps of the predicted α
textures. Compared with the experimental α texture in
Fig. 4(a), the texture calculated based on the DKS model with
the proper ω value from Fig. 10 agreed well with the
experi-mental results in Fig. 4(b).
4.2 Temperature dependency of the variant selection
According to heterogeneous nucleation theory, nucleation on edges and corners, which occurs even at low activation energies, prevails in transformations with a low degree of su-percooling. Thus, the grain boundary plane nucleation be-comes predominant as the degree of supercooling increases, owing to the large number of the potential sites for nucle-ation. The intensity of the variant selection rule obeying DKS rule is strong in the high-temperature region corresponding to a low degree of supercooling, because the grains precipitate on the triple junction can fulfill the DKS easily. However, the decreasing transformation temperature, corresponding to an increase in supercooling, increases the precipitation on the grain boundary plane, which can decrease the intensity of the variant selection obeying DKS. Therefore, even in the trans-formation temperature range dominated by the diffusional mechanism, the transformation temperature affects the trans-formation texture development via the number of nucleation
Fig. 11 ODF contour maps of the α texture predicted by the DKS model.
[image:6.595.325.525.458.642.2] [image:6.595.142.457.698.772.2]sites, which is controlled by the degree of supercooling.
Furuhara et al.19) have examined the orientation
relation-ships of PF formed at austenite grain boundaries with respect to the adjacent austenite grains in the steel isothermally trans-formed at temperatures of 550, 600 and 720 C. Their results indicate that the lower the transformation temperature, the higher is the fraction of DKS in contradiction to the results of the present research. It is suggested that one of the reasons for the above disagreement is the differences of the isothermal hetreatment temperature. Since the accommodation by at-omistic diffusion becomes difficult to occur at the interphase boundary upon the transformation at a lower temperature
re-gion,25) the DKS rule seems to be favored in order to reduce
the interfacial energy. The results in this study imply that the variant selection depends on the nucleation site and is weaken with decreasing transformation temperature at a higher tem-perature region where diffusion is much easier.
A further study of the change in the variant selection mech-anisms during the transition temperature region between dif-fusional transformation and non-difdif-fusional one would deep-en the understanding of the temperature depdeep-enddeep-ence in the variant selection.
5. Conclusion
The temperature dependency of the transformation texture development dominated by the diffusional mechanism of 0.2% C-2.0% Si-2.0% Mn-0.2% Al steel sheet was investigat-ed via EBSD analysis. The results are summarizinvestigat-ed as follows. (1) PF mainly precipitated on the triple junction in the high-
temperature region, whereas it mainly precipitated on the grain boundary plane as the temperature decreased. (2) About 60% of the fraction of the PF that precipitated at
the triple junction fulfilled the DKS rule, which was twice that of the fraction at the grain boundary plane.
(3) The intensity of the variant selection on transformation decreased with decreasing transformation temperature. (4) The texture predicted by the DKS model reproduced the
measured PF texture well, which indicated that the inten-sity of the variant selection obeying the DKS rule de-creased with decreasing transformation temperature. (5) The intensity of the variant selection was affected by the
degree of supercooling, in which the DKS rule operates on the transformation in the high-temperature region cor-responding to a low degree of supercooling. However, the DKS rule has little effect when the temperature decreas-es, corresponding to a high degree of supercooling.
Acknowledgement
The authors are grateful to Dr. N. Maruyama, Mr. M.
Waki-ta and Mr. M. Kobayashi of Nippon Steel and Sumitomo Met-al Corporation for vMet-aluable discussion of the EBSD techniq and the sample preparation.
They also thank Nippon Steel and Sumitomo Metal Corpo-ration for providing the instruments and materials. This work was partially supported by Grant-in-Aid of Scientific Re-search (B:15H04143) from the Japan Society for the Promo-tion of Science.
REFERENCES
1) A.D. King and T. Bell: Metall. Trans. A 6 (1975) 1419–1429.
2) A.D. King and T. Bell: Met. Sci. J. 8 (1974) 253–260.
3) R.K. Ray, J.J. Jonas, M.P. Butron-Guillen and J. Savoie: ISIJ Int. 34
(1994) 927.
4) P. Chapellier, R.K. Ray and J.J. Jonas: Acta Metall. Mater. 38 (1990) 1475–1490.
5) J. Savoie, R.K. Ray, M.P. Butron-Guillen and J.J. Jonas: Acta Metall. Mater. 42 (1994) 2511–2523.
6) G. J. Davies and R. M. Bateman, Proc. 6th Int. Conf. on Texure and Materials (ICOTOM6), 1, (Iron and Steel Inst. of Japan, 1981), 132– 148.
7) M. Sum and J.J. Jonas: Textures and Microstructures 31 (1999) 187– 215.
8) M. Humbert, F. Wagner, W. P. Liu, C. Esling and H. J. Bunge, Proc. 8th Int. Conf. on Texure and Materials (ICOTOM8), (The Minerals, Metals & Materials Society, 1987), 743–748.
9) J. J. Jonas, M. P. Butrbon-Guillnen and C. S. Da Costa Viana, Proc. 11th Int. Conf. on Texure and Materials (ICOTOM11), (International academic Publishers, 1998), 575–591.
10) C.S.D.C. Viana, M.P. Butron-Guillen and J.J. Jonas: Textures and Mi-crostructures 26 (1996) 599–610.
11) P. Bate and B. Hutchinson: Acta Mater. 48 (2000) 3183–3192.
12) N. Wittridge, J.J. Jonas and J. Root: Metall. Mater. Trans., A 32 (2001) 889–901.
13) J.J. Jonas and N.J. Wittridge: Metals and Materials International 6
(2000) 211–220.
14) N. Stanford and P.S. Bate: Adv. Eng. Mater. 53 (2005) 859–867. 15) K. Ameyama, T. Maki and I. Tamura: J. Jpn. Inst. Met. Mater. 50 (1986)
602–611.
16) K. Ameyama, M. Minagawa, T. Maki and I. Tamura: Tetsu-to-Hagané
9 (1988) 1839–1845.
17) T. Tomida, M. Wakita, M. Yoshida and N. Imai, Proc. 15th Int. Conf. on Texure and Materials (ICOTOM15), (Pittsburg, 2008), 325–332. 18) I. Lischewski and G. Gottstein: Acta Mater. 59 (2011) 1530–1541.
19) T. Furuhara, H. Saito, G. Miyamoto and T. Maki: Mater. Sci. Forum
654–656 (2010) 7–10.
20) E. M. Lehockey, Y.-P. Lin and O. E. Lepik : Electron Backscatter
Dif-fraction in Materials Science, (Kluwer Academic/Plenum Publishers, 2000), pp. 247–264.
21) A.J. Wilkinson: Scr. Mater. 44 (2001) 2379–2385.
22) H. Réglé, N. Maruyama and N. Yoshinaga: Mater. Sci. Forum 467–470
(2004) 11–20.
23) T. Tomida, M. Wakita, M. Yasuyama, S. Sugaya, Y. Tomota and S.C. Vogel: Acta Mater. 61 (2013) 2828–2839.
24) H.J. Bunge, M. Humbert and P. Welch: Textures and Microstructures 6
(1984) 81–95.
25) N. Yoshinaga, H. Inoue, K. Kawasaki, L. Kestens and B.C. De Cooman: