Md.Azhar Uddin
, Yoshiei Kato
+and Shengji Wu
1Department of Material and Energy Science, Graduate School of Environmental and Life Science,
Okayama University, Okayama 700-8530, Japan
2Department of Environmental Chemistry and Materials, Faculty of Environmental Science and Technology,
Okayama University, Okayama 700-8530, Japan
3Department of Environmental Science and Engineering, Hangzhou Dianzi University, Hangzhou 310018, China
In order to maximize the recovery of silicon wafer in waste crystalline silicon solar cells, chemical treatment has been carried out by using the mixed solution of hydrofluoric acid (HF) and nitric acid (HNO3). The effect of HF and HNO3concentrations on etching rates of several components such as silver (Ag), aluminum (Al), anti-reflectionfilm made of silicon nitride (AR) and silicon (Si) in the solar cells has been made clear. The etching rates of Ag, Al and Si are held almost constant with time and become larger with the increasing HF concentration and the etching temperature. All of the etching rates of Al, AR and Si have peaked at the HF mole fraction of about 0.8. The dependency of HF concentration on Al, AR and Si etching rates becomes larger than that of HNO3. As the best solution composition for the Si recovery yield, the following relation has been found in this study: (number of AR moles)/(number of Al moles)=7.62©10¹4CHNO30.59CHF0.74whereCHNO3, CHF: HNO3, HF concentration (kmol/m3). [doi:10.2320/matertrans.M2015293]
(Received July 15, 2015; Accepted September 3, 2015; Published November 25, 2015)
Keywords: solar cell, silicon, photovoltaic cell, recycling, etching, hydrofluoric acid, nitric acid
1. Introduction
Due to the increase in photovoltaic (PV) market in the world, the recovery of end-of-pipe or rejected PV modules has been also much in demand. It is particularly important to establish the reusing or recycling system of crystalline silicon
solar cell which accounts for PV modules above 80%in the
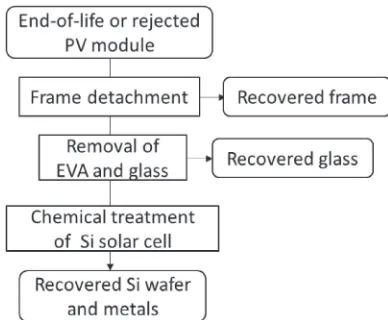
world. A typical recyclingflow17)of crystalline silicon solar
cells is shown in Fig. 1. Frames made of aluminum are detached, polymer encapsulants made of ethylene vinyl acetate (EVA) and glasses are removed, and silicon solar cells are etched chemically. Both of the frames and the glasses are usually recovered for reusing or recycling. However, the solar cells do not always recover due to the crack in cases of the separation of the EVAs and the glasses from the PV modules. There are a variety of investigations on chemical treatment of silicon solar cells. The etching targets are the surface
electrode made of silver, the anti-reflection film (AR)
including silicon nitride, the back electrode made of aluminum and the p-n junction part in the silicon wafer. In
order to dissolve each target efficiently, various etching
solutions were used sequentially as follows: HNO3-HCl-HF/
HNO3,3) HCl-HF/HNO3,3) NaOH-HF,3) HF/HNO3/CH3
-COOH,8) HF/H
2SO4/CH3COOH,8) HF/HNO3-KOH,9)
H3PO4-HF/HNO3,9) HF/HNO3/CH3COOH,10,11) HF/
HNO3/Br2,10,11) HF/HNO3/AgNO3,12,13) NOHSO4/HF/ H2SO412,13) and HF/HNO3/CH3COOH/Br.14) However, there was little study on the etching rate of each component
in the silicon solar cell when concentration of etching solution was varied widely. In addition, the relationship between the silicon wafer recovery yield and the etching rates
was not analyzed sufficiently, although it depends on the
etching rates of silver, aluminum and AR film covering the
silicon wafer. The present work is intended to propose the etching procedure to obtain the maximum silicon recovery yield by studying the effect of the composition in hydrogen
fluoride (HF)-nitric acid (HNO3) solution on the etching rate
of each component of the silicon solar cells.
2. Experimental Procedure
2.1 Experimental procedure
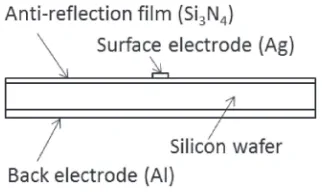
Figure 2 shows a schematic diagram of multicrystalline silicon solar cell used for experiment. The sample surface
area was 0.031©0.031 m2 and the thicknesses were 1.6©
10¹4m for the silicon wafer (silicon, Si), 8.0©10¹8m for the
Fig. 1 A typical recyclingflow of crystalline silicon solar cells.
+1Graduate Student, Okayama University. Present address: Shimane Prefecture, Okinoshima 685-8601, Japan
+2Undergraduate Student, Okayama University. Present address: Toray Industries Inc., Tokyo 103-8666, Japan
+3Undergraduate Student, Okayama University. Present address: Okayama Prefecture Police, Okayama 700-0824, Japan
[image:1.595.328.522.371.531.2]anti-reflection film (Si3N4), 3.3©10¹5m for the surface
electrode (silver, Ag) and 3.1©10¹5m for the back electrode
(aluminum, Al). The sample was dipped into the etching
solution prepared by mixing 26.45 kmol/m3 of hydrofluoric
acid, 13.00 kmol/m3 of nitric acid and deionized water by
hanging from the top. The etching rate was calculated from the perfect dissolution time measured by visual observations, assuming that each component of the sample was dissolved uniformly and layer by layer.
The effect of etching solution amount on the etching rate of each component was studied when the solution volume was
varied from 1©10¹5 to 2.0©10¹4m3, and HF and HNO
3
concentrations were kept constant at 6.61 and 3.25 kmol/m3,
respectively. The etching temperature was fixed to 298 K.
The temporal change in etching amount before the perfect
dissolution was measured under two kinds of HF and HNO3
concentrations (kmol/m3) such as HF/HNO
3=2.38/5.33,
4.36/4.33 for Ag and Al, and HF/HNO3=1.32/5.85, 2.64/
5.20 for Si. The solution volume wasfixed to 1.00©10¹4m3
and the etching temperature was 298 and 323 K. On the other hand, to study the effect of the solution concentration on the etching rate, 14 kinds of concentrations were prepared with the etching temperature of 298 K and the solution volume of
1.00©10¹4m3as shown in Fig. 3.
2.2 Quantitative analysis of components in solar cells Silver, aluminum and silicon concentrations in the etching
solution were analyzed quantitatively in order to find the
temporal change in weight of each component in the solar cell. Silver etching amount was obtained from measuring
weight of AgCl precipitate after putting excess NaCl into the etching solution. Aluminum concentration in the etching solution was measured by the chelate titration method using EDTA as titrant and Cu-PAN as indicator. To determine the
silicon concentration,15) K2SiF6 was precipitated by adding
KCl and ethanol into the H2SiF6-contained etching solution,
and then K2SiF6precipitate was dissolved by adding NaOH
solution as K2SiF6+4OH¹¼Si(OH)4+2K++6F¹.
3. Results and Discussion
3.1 Relationship between etching time of solar cell and acid residual ratio
The etching reaction equations of Ag, Al, Si3N4and Si in
HF/HNO3solution are as follows:
AgþHF!AgFþHþþe ð1Þ
3Agþ4HNO3!3AgNO3þ2H2OþNO ð2Þ
Alþ3HF!AlF3þ3Hþþ3e ð3Þ
Si3N4þ18HFþ4Hþ!3H2SiF6þ4NH4þ ð4Þ
3Siþ18HFþ4HNO3!3H2SiF6þ4NOþ8H2O ð5Þ
As the weights of Ag, Al, AR(Si3N4) and Si in the sample
were 3.1©10¹5, 3.2©10¹5, 2.6©10¹7and 3.7©10¹4kg,
respectively, mole numbers of HF and HNO3used to etch the
above components were calculated as 0.083 and 0.018 mol,
respectively. Consumption of HF and HNO3for Ag etching
expressed by eqs. (1) and (2) was distributed according
to molar ratio of HF/HNO3=6.61/3.25 as shown in
section 2.1. Hydrogenfluoride consumed by Si etching were
0.079 mol (95% of total HF), whereas nitric acid were
0.018 mol (78% of total HNO3).
The etching times of Al, AR and Si in the sample are
shown in Fig. 4 whereCHFandCHNO3are defined as HF and
HNO3 concentration (kmol/m3), respectively. Here, the
etching time means the time from the charge of sample into the etching solution to the perfect dissolution of each component. The Al and AR etching times were kept
approximately constant over 1.0©10¹5m3solution volume.
However, the Si etching time at 1.0©10¹5m3 solution
volume became larger due to a decrease in HF and HNO3
Fig. 3 Hydrofluoric acid, nitric acid and deionized water concentrations used for experiment.
[image:2.595.319.533.67.247.2] [image:2.595.89.250.69.165.2] [image:2.595.61.276.203.377.2]concentrations which contributed to the etching reaction rate as described in 3.4 and it became almost constant over
5.0©10¹5m3, that is, HF:0.33 mol and HNO
3:0.16 mol. As
stoichiometric HF and HNO3 amounts used for the sample
etching were 0.083 and 0.018 mol, respectively, 0.33/
0.083=4.0 times of HF and 0.16/0.018=8.9 times of
HNO3were necessary to maintain the constant etching time
of sample.
Figure 5 shows the residual ratios of HF and HNO3in the
etching solution. The residual ratio is defined as the remained
HF or HNO3concentration after the complete dissolution of
sample normalized by the initial condition. When the etching
time of sample became almost constant over 5.0©10¹5m3
solution volume as seen in Fig. 4, over 0.86 of HF and 0.75
of HNO3remained in the etched solution. It was found that
these residual ratios have little effect on the etching time.
3.2 Temporal change in etching rate of each component in solar cells
Temporal changes in Ag, Al and Si weights in the sample are shown in Figs. 6, 7 and 8, respectively. The slopes of temporal change in weight were recognized to be almost constant, although the data have slight variances. It means that each component in the sample dissolves at a constant rate. The weight decreasing rate of each component, that is, the etching rates of Ag, Al and Si became larger with the increases in HF concentration and the etching temperature. As shown in Fig. 6, the increase of Ag etching rate with increasing HF concentration suggests that Ag etching is controlled by eq. (1) instead of eq. (2). A difference of etching rate between Ag and Al at the same condition of solution concentration indicated in Figs. 6 and 7 seems to be due to a difference of each rate constant for etching reaction. As Si wafer is covered with Ag and AR, Si etching starts after a complete dissolution of either Ag or AR, which generally complicates the Si etching behavior. However, the Si etching rate in Fig. 8 was almost kept constant. It is because the Ag and Ar etching times are much more rapid than Si and have little effect on the Si etching behavior.
3.3 Effect of HF and HNO3 concentrations on etching rate of each component in solar cells
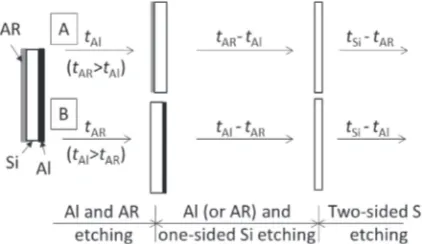
A schematic diagram of solar cell etching procedure is shown in Fig. 9. Both Al and AR dissolve initially and Si etching starts on one side after complete dissolution of Al or
AR, and follows on both sides of the sample after complete
dissolution of AR and Al. The etching rate,rSi(nm/s), of Si
on one side is expressed by using ti: complete dissolution
time (s) of component i (=Al, AR, Si), µSi: Si density
Fig. 5 Relationship between residual ratio of acids and solution volume
after dissolution of solar cells. Fig. 6 Temporal change in residual silver in solar cells.
Fig. 7 Temporal change in residual aluminum in solar cells.
Fig. 8 Temporal change in residual silicon in solar cells.
[image:3.595.319.533.71.197.2] [image:3.595.63.280.71.191.2] [image:3.595.320.533.237.364.2] [image:3.595.320.534.403.533.2] [image:3.595.321.532.574.696.2](kg/m3), S
Si: cross-sectional area (m2) of Si wafer and
dSi: thickness (nm) of Si wafer.
A. whentAR>tAl,
ðrSiÞðtARtAlÞµSiSSiþ2ðrSiÞðtSitARÞµSiSSi
¼dSiµSiSSi ð6Þ
B. whentAl>tAR,
ðrSiÞðtAltARÞµSiSSiþ2ðrSiÞðtSitAlÞµSiSSi
¼dSiµSiSSi ð7Þ
Both of eqs. (6) and (7) results in eq. (8).
rSi¼dSi=ð2tSitAltARÞ ð8Þ
WhendAl(nm) anddAR(nm) are defined as thickness of Al
and AR, respectively, Al etching rate, rAl (nm/s) and AR
etching rate, rAR (nm/s) are given by eqs. (9) and (10),
respectively.
rAl¼dAl=tAl ð9Þ rAR¼dAR=tAR ð10Þ Figures 10, 11 and 12 show the relationships between
¹rAl, ¹rAR and ¹rSi, and HF mole fraction, mHF (¹),
respectively. As the Al etching rate at mHF=0 without DI
water had the different scale from the other data, dashed lines were ruled to correlate with neighboring plots instead of solid
lines. All etching rates peaked atmHFof about 0.8, which was
slightly larger than 0.670.72 as shown by H. Robbins.16)
The peaks of Si etching rate at DI water of 0 and 25%were in
agreement with the stoichiometric proportion of mHF=18/
(18+4)=0.82 shown in eq. (5). The increasing dilution
ratio of the etching solution by DI water resulted in decreases
in the etching rates of Al, AR and Si. It is not clear why Al
and AR etching rates decrease atmHF=1 in spite that Al and
AR seems to react with HF as indicated in eqs. (3) and (4), respectively.
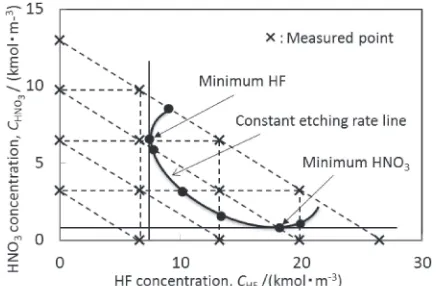
The constant etching rate lines of Al, AR and Si are
calculated from Figs. 1012. Figure 13 shows a schematic
diagram of a contour of the etching rate. The interpolated values of a given etching rate are found on the broken lines
and combined continuously. The minimum HF and HNO3
concentrations are also shown in Fig. 13.
[image:4.595.322.534.67.203.2]The contours of Al, AR or Si etching rate are shown in Fig. 14. The almost concave curves were found in every constant etching rate line. It means that mixing of HF and
HNO3 have the effect of the decrease in each acid
concentration. Moreover, the mHF values to minimize the
HF consumption for each constant etching rate increased with the increasing etching rate as shown in open circles in
Fig. 14. For example, Si etching rate of 5 nm/s as shown in
(c) of Fig. 14 corresponded tomHF=0.12, whereas 50 nm/s
to mHF=0.51 and 200 nm/s to mHF=0.61. The lower
etching rate of each component will provide the saving of HF consumption.
3.4 Procedure of efficient Si recovery in solar cells based on etching rate of AR and Al
The etching rate of component, i, is expressed by eq. (11)
when mixing solution of HF and HNO3is used.
[image:4.595.62.276.67.202.2]vi¼ki CHFaCHNO3b ð11Þ
[image:4.595.64.278.239.378.2]Fig. 10 Relationship between Al etching rate and HF mole fraction.
Fig. 11 Relationship between AR etching rate and HF mole fraction.
Fig. 12 Relationship between Si etching rate and HF mole fraction.
[image:4.595.318.536.244.387.2]where vi: etching rate of component, i, (mol/s), ki: etching constant of component, i. When Al and AR are etched by HF
alone shown in Figs. 1011, the etching rate is given by
eq. (12).
vi¼ki CHFa ð12Þ The multi-regression analysis of eqs. (11) and (12) by using data in section 3.3 led to the following equations.
A. for mixed solution of HF and HNO3,
vAl¼7:48109CHF3:07CHNO30:48 ð13Þ vAR¼5:701012CHF2:32CHNO31:07 ð14Þ vSi¼8:36109CHF3:17CHNO30:94 ð15Þ B. for HF solution alone,
vAl¼3:42107CHF1:40 ð16Þ vAR¼2:621011CHF1:57 ð17Þ
As shown in eqs. (13)(17), CHF dependency on Al, AR
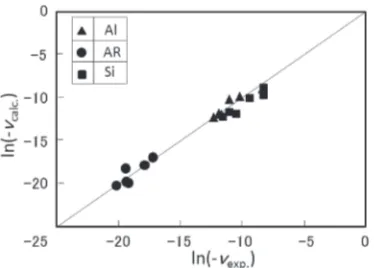
and Si etching rates was larger thanCHNO3. The comparison
between the calculated etching rate,¹vcalc. (mol/s), and the
experimental one,¹vexp.(mol/s), is shown in Fig. 15. It was
found that the regression calculation explained the experi-ment.
The maximum Si recovery is achieved when the AR layer on the surface and the Al layer on the opposite side in the solar cell complete their etching at the same time. Therefore, the etching rates of AR and Al affects the Si recovery. When ti: perfect etching time (s),µi: density (kg/m3),Mi: molecular
weight, di: thickness (nm), Si: cross-sectional area (m2) of
component i, eqs. (18)(19) are given, based on eqs. (13)
(14).
rAl¼ ð106µAl=MAlÞðdAl=109ÞSAl=tAl
¼7:48109CHF3:07CHNO30:48 ð18Þ rAR¼ ð106µAR=MARÞðdAR=109ÞSAR=tAR
¼5:701012CHF2:32CHNO31:07 ð19Þ
Therefore, eq. (20) is given when tAlis equal totAR.
ðµARdARSAR=MARÞ=ðµAldAlSAl=MAlÞ
¼7:62104CHNO30:59=CHF0:74 ð20Þ Applying the sample dimension in this study described in chapter 2 to eq. (20), the following equations are obtained:
ð106µ
Al=MAlÞðdAl=109ÞSAl¼1:19103 ð21Þ ð106µ
AR=MARÞðdAR=109ÞSAR¼1:71107 ð22Þ
Substituting eqs. (21) and (22) into eq. (20), the following relationship was obtained:
CHNO3¼0:060CHF1:26 ð23Þ
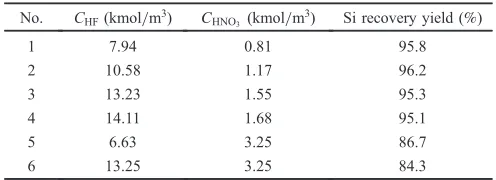
[image:5.595.110.489.69.291.2]Not only the relation of eq. (23) but also the newly experimental conditions to verify the Si recovery ratio are shown in Fig. 16. The newly experimental conditions indicated by Nos. 1, 2, 3 and 4 were on the curve of eq. (20) and compared with existing experimental conditions such as Nos. 5 and 6. The Si recovery yield after the complete etching times of Al and AR is shown in Table 1. The newly experimental conditions achieved higher Si yield than the existing ones out of eq. (20). It has been recognized that the relation of eq. (20) is generally applicable to chemical
Fig. 14 Contours of Al, AR and Si etching rates.
[image:5.595.77.264.334.468.2]etching of the waste crystalline silicon solar cell with mixed
solution of HF and HNO3.
4. Conclusions
Chemical treatment of multicrystalline silicon solar cell
was carried out by using mixed solution of hydrofluoric and
nitric acids.
(1) The etching time of silicon solar cell became almost
constant when masses of HF and HNO3remained over
86% and 75%, respectively, relative to the initial
conditions in the etching solution.
(2) The etching rates of Ag, Al and Si were kept almost constant and became larger with the increasing HF concentration and the etching temperature.
/
Acknowledgements
This work was supported by JFE 21st Century Foundation.
REFERENCES
1) A. Muller, K. Wambach and E. Alsema: Mater. Res. Symp. Proc., (Materials Research Society, 2006) 0895-G03-07.
2) E. Bomback, I. Rover, A. Muller, S. Schlenker, K. Wambach, R. Kopecek and E. Wefringhaus: Proc. 21st EU-PVSEC, (2006) pp. 20482053.
3) New Energy and Industrial Technology Development Organization (NEDO) Report, (2006) pp. 3740.
4) K. Okajima and Y. Uchiyama:J. Life Cycle Assess. Japan5(2009) 521528.
5) E. Radziemska, P. Ostrowski, A. Cenian and M. Sawczak: Ecol. Chem. Eng. S17(2010) 385391.
6) E. Klugmann-Radziemska:Chem. Didact. Ecol. Metrol.17(2012) 89 95.
7) M. Kimura and T. Motoji: Taiyo Energy38(2012) 17.
8) S. Kang, S. Yoo, J. Lee, B. Boo and H. Ryu:Renew. Energy47(2012) 152159.
9) J. Park and N. Park:RSC Adv.4(2014) 3482334829.
10) E. Radziemska, T. Seramak and P. Ostrowski: Adv. Mater. Sci.8(2008) 2834.
11) E. Klugmann-Radziemska and P. Ostrowski:Renew. Energy35(2010) 17511759.
12) S. Patzig, G. Roewer, E. Kroke and I. Rover: Verlag der Zeitschrift fur Naturforschung (2007) 14111421.
13) S. Patzig-Klein, G. Roewer and E. Kroke: Mater. Sci. Semicond. Process.13(2010) 7179.
14) E. Klugmann-Radziemska, P. Ostrowski, K. Drabczyk, P. Panek and M. Szkodo:Solar Energy Mater. Solar Cells94(2010) 22752282.
15) J. Acker and A. Herbge:Talanta72(2007) 15401545.
[image:6.595.65.276.63.204.2]16) H. Robbins and B. Schwartz:J. Electrochem. Soc.106(1959) 505 508.
Table 1 Si recovery yield.
No. CHF(kmol/m3) C
HNO3(kmol/m3) Si recovery yield (%)
1 7.94 0.81 95.8
2 10.58 1.17 96.2
3 13.23 1.55 95.3
4 14.11 1.68 95.1
5 6.63 3.25 86.7
[image:6.595.45.293.272.362.2]6 13.25 3.25 84.3