Self-Selection and Learning-by-Exporting
Hypotheses: Micro Level Evidence
Rehman, Naqeeb Ur
Department of Economics, Hazara University Mansehra
20 May 2016
Online at
https://mpra.ub.uni-muenchen.de/71480/
Self-Selection and Learning-by-Exporting Hypotheses: Micro Level Evidence
Preliminary draft, please do not quote anything from here.
Dr. Naqeeb Ur Rehman
Abstract
This aim of this empirical paper is to investigate the self-selection and learning-by-exporting
hypotheses. This study addresses the reverse causality between innovation, productivity and
exporting using micro level data on 29 countries from Eurasia and Central and Eastern
Europe (CEE). CDM estimation results suggest that innovation and productivity positively
influence the firm’s exporting and vice versa. This study has supported the self-selection and
learning-by-exporting hypotheses. Previous studies provided mixed outcome on the analysis
of these two major hypotheses. Similarly, innovation by exporting is examined using multiple
proxies of innovation such as product/process innovation, R&D and organizational
innovation. Findings imply that innovation is an important determinant of firms’ exporting
and this outcome is robust across Eurasian and CEE firms. Moreover, foreign owned firms
are more likely to export and innovate than domestic firms due to their technological
superiority over domestic firms. Concerning policy implications, economic policies should
address the firm’s innovation, productivity and exporting performance. This would result in
better economic integration between Eurasian and CEE firms. By removing the firm’s
barriers such as access to finance, trade regulations and taxation etc would encourage trade
networks between Eurasian and CEE firms.
Keywords: Innovation, productivity and Exporting.
1. Introduction
International trade theories emphasized the role of innovation and productivity growth for
accelerating export performance, while international trade unions such as European Union
(EU), Organization for Economic Cooperation and Development (OECD) and Eurasian
economies are striving to compete in terms of technological innovation in order to increase
their trade volume. Concerning the global trade linkages, European Neighbourhood Policy
(ENP) is an example of establishing the European economies trade networks with
neighbouring countries such as Azerbaijan, Belarus, Georgia, Israel, Turkey and Russia. ENP
covers diverse and multilateral economic ties with each neighbouring country in terms
investment, competition, labour and technological standards (Liargovas, 2013). Contrary to
they must maintain a minimum threshold of GDP per capita to sustain their economic
development. To be economically developed, countries continuously need to make
investment in innovation activities because the more they innovate, the larger are their
exports share which result in gain in foreign income. Regarding innovation, numerous
endogenous growth models (e.g., see Lachnmaier and Wobmann, 2006; Jose and Alvaro,
2014; Monreal-Perez et al. 2011) endogenize the innovation factor and predict the
productivity-export relationship. The innovation factor stems from the fierce competition in
the international markets which forces exporting firms, first, to improve their productivity
i.e., to cover the sunk costs of international markets, and second, to remain competitive, they
need to develop high quality products/services. Thus, maintaining high quality products result
in increasing the likelihood of innovation.
Without a second thought, exporters are better performers than non exporters because
exporting is associated with high productivity and competitiveness (Imbriani et al. 2014).
Consequently, exporters tend to pay higher wages, hired more skilled employees and are
more capital and technological intensive than non exporters (Trofimenko, 2008). In
particular, the empirical literature on international trade has extensively discussed the
self-selection (SS) and learning-by-exporting (LBE) hypotheses. Several quantitative studies (e.g.,
Harris and Li, 2008; Manez-Castillejo et al. 2009; Haidar, 2012) identified the endogenous
link between productivity and exporting, while another group of researchers (e.g., Sharma
and Mishra, 2012) investigated the relation between innovation and exporting. These past
studies asserted that innovation and productivity significantly boost the export performance
and vice versa.
Earlier studies (Claudio, Jose and Alvaro, 2014; Cassiman and Golovoko, 2007) have
provided little evidence in terms of empirical analysis of the SS (pre-entry performance) and
LBE (post-entry performance) hypotheses. This study has revisited the reverse causality
between innovation, productivity and exporting by introducing two research questions. Does
reverse causality exist between innovation, productivity and exporting? How multiple proxies
of innovation affect exporting using micro level data? Previous studies were focused on the
single country analysis and were limited in terms of generalizing their results. In this paper,
these two (SS and LBE) hypotheses are estimated on 29 countries mainly from Eurasian and
Central and Eastern European (CEE) countries. To estimate the affect of innovation on
used multiple proxies of innovation such as product and process innovation, R&D and
organizational innovation. This strategy has examined the separate effect of each innovation
proxy on exporting which is neglected by the previous studies.
To estimate the reverse causality between innovation, productivity and exporting, this study
has used the modified CDM (Crepon, Duguet and Mairesse, 1998) model. CDM model
addresses the selectivity, simultaneity and endogeneity biases. Using micro level data on 29
countries, SS and LBE hypotheses suggested that reverse causality exists between innovation,
productivity and exporting. Similarly, innovation by exporting hypothesis is estimated using
2SLS of instrumental variables approach. Results show that firms that are engaged in
product/process innovation, R&D and/or organizational innovation are more likely to involve
in exporting. This finding is robust across all Eurasian and CEE firms. Similarly, foreign
owned firms are more likely to engage in innovation activities as well as exporting due to
their technological superiorty over domestic firms.
The remainder of the paper is organized as follows: section 2 reviews the empirical literature
and section 3 provides information on the data source and empirical analysis of hypotheses.
Sections 4 conclude and present policy implications.
2. Related Literature
Innovation is an important factor in explaining the productivity-export relationship. A firms’
innovation capabilities provide sustain competitive advantage because innovation is an
important asset which is difficult to imitate, substitute and valuable (Guan and Ma, 2003). In
particular, international markets select the most productive and innovative firms. Several
studies (e.g., Masso and Vahter, 2011; Lopez, 2009; Claudio, Jose and Alvaro, 2014; Harris
and Li, 2008; Manez-Castillejo et al. 2009) have estimated the link between innovation,
productivity and exporting. They categorized their relationship into two major hypotheses.
First, the self-selection hypothesis (SS) i.e., highly productive or most innovative firms self
select the export markets, while learning-by-exporting (LBE) hypothesis suggest that
exporting positively influence the innovation and productivity performance. In other words,
there is a reverse causality between innovation, productivity and exporting. Nevertheless, past
studies provided little empirical evidence regarding the estimation of reverse causality
review of the past empirical studies in terms of innovation, productivity and exporting
relationship and then presented the empirical analysis.
2.1. Self-Selection (SS) Hypothesis
Selling goods abroad by the firms carry extra costs (sunk costs) e.g., collection of information
related to the demands of international customers, transportation costs, distribution or
marketing costs and the costs of managing foreign networks (Haidar, 2012; Harris and Li,
2008). To cover sunk costs, exporting firms’ require prior high productivity. Without prior
high productivity, firms cannot afford to export their products and services. Harris and Li
(2008) investigated the productivity-export relationship.1 They argued that exporters are
highly productive than non-exporters and before exporting, firms should improve production
efficiency, increase technological quality of their products and services which result in higher
productivity (Guan and Ma, 2003). Masso and Vahter (2011) study on Estonian firms
analyzed that innovation and productivity have endogenous link. A similar study is provided
by Baumann and Kritikos (2016) on German SMEs which suggested that innovation (product
and process innovation) and productivity (total factor productivity) are important
determinants of SMEs performance. However, both studies have failed to establish the
causal link between innovation, productivity and exporting. While other studies e.g.,
Antonielly and Cainelli (2010) panel study on Italian manufacturing firms, Banri and Ayumu
(2013) study on Japanese firms and Movahedi and Gaussens (2011) investigated French
SMEs, their empirical findings have supported the SS hypothesis. They argued that
innovation and productivity are the important determinants of export performance.
Consequently, this indicates that firms require high productivity and investment in innovation
activities before exporting. Claudio, Jose and Alvaro (2014) investigated the Chilean
manufacturing firms. They found that innovative firms (R&D firms) are more likely to export
than non innovative firms. Similarly, Cassiman and Golovoko (2007) examined the
innovation, productivity and export relationship for Spanish manufacturing firms. They stated
that innovation and productivity drives firms’ to export because innovative and productive
firms can easily afford the entry costs of international markets which is not possible for less
innovative and productive firms (Lopez, 2009; Cassimann et al. 2010).
1
Concerning the empirical strategies to estimate the SS hypothesis, numerous researchers
(Caldera, 2010; Monreal-Perez et al. 2011; Halpern and Murakozy, 2012; Faustino and
Matos, 2015) have examined the link between innovation, productivity and exporting.
Caldera (2010) and Monreal-Perez et al. (20111) have used the two stage least square (2SLS)
method to resolve the endogeneity between innovation (product/process) and exporting.
However, their study failed to address the reverse causality between innovation and
exporting. In addition, Halpern and Murakozy (2012) analyzed the innovation,
productivity-export relationship for Hungarian firms. In order to correct the selectivity and simultaneity
bias between innovation and productivity, they used Crepon-Duguet-Mairesse (CDM)
model.2 They asserted that innovation positively influences the firm’s productivity and
exporting. However, their findings have neglected to identify the reverse causality between
innovation and exporting. On the other hand, the causal link between innovation
(product/process) and exporting is identified by Lachenmair and Wobmann (2006) using
micro level data on German manufacturing firms. Further, Manez-Castillejo et al. (2009)
investigated the simultaneous relationship between innovation, productivity and exporting
using panel data (1990-2000) on Spanish firms. Their empirical analysis i.e., dynamic
trivariate probit model results showed that highly productive firms self select the international
markets for exporting. Therefore, higher the labour productivity, the more probability to
introduce process innovation and the greater is the firm’s probability to export. However, no
statistical evidence is found while using the product innovation in explaining the innovation,
productivity-export relationship. The next subsection provides the reverse causality of SS
hypothesis i.e., LBE.
2.2. Learning-by-Exporting (LBE) Hypothesis
LBE means just as learning-by-doing, in other words, it refers to the firm post entry
performance. Specifically, when firms enter to into the international markets they acquire
superior knowledge through innovative demands of foreign customers, adopt new production
techniques with higher capacity utilization which increases the firm’s productivity and
innovation performance (Lu and Beamish, 2006; Castellani, 2002; De Loecker, 2013). On
the other hand, the “born global” theory of firms’ internationalization suggest that firms
should start exporting in early stage without going through different stages of
2
internationalization (e.g., when firms’ initially start exporting via agents) (see Bell et al.
2003; Johanson and Vahlne, 1977). Born global firms experience high productivity and
innovation performance in the international markets. Evidence on LBE hypothesis is
provided by Martins and Yang (2009). They conducted a meta-analysis of the LBE
hypothesis on more than 30 papers and identified that exporting significantly improve the
productivity of firms’ in developing countries due to their greater distance to the
technological frontier.
In addition, Trofimenko (2008) investigated the learning-by-exporting hypothesis for 1057
Columbian manufacturing firms using quantile regression analysis. Trofimenko study
revealed that exporting to advance countries provide efficiency gains which is generated
through the information on production methods, product quality and design which result in
decreasing product costs and consequently improve the firms’ productivity. Sharma and
Mishra (2012) conducted a panel (unbalance) study on Indian automobile manufacturing
firms. They analyzed the causal link between exporting and productivity by estimating the
two main hypotheses. First, the SS hypothesis i.e., firms that require higher productivity
before exporting. Second, the LBE hypothesis i.e., firms become more productive when they
enter export markets. However, their empirical findings supported only LBE hypothesis
which suggest that exporting positively influence the productivity. A similar study is
presented by Damijan, Kostevc and Polanec (2010). They studied the causal link between
innovation (product and process) and exporting using a panel data on Slovenian firms.
However, their empirical results only found that exporting increases the probability of firm’s
undertaking process innovation than introducing product innovations. Their results
demonstrated that LBE effect take place through the mechanism of process innovation which
improves the firm’s technical efficiency and thus result in high productivity.
In addition, De Loecker (2013) conducted a study on Estonian firms. De Loecker (2013)
found that Slovenian firms substantially gains productivity from entering into the export
markets. Harris and Moffat (2011) examined the link between R&D, innovation
(product/process) and exporting using probit regression analysis for UK firms. Their
empirical study found that R&D, innovation and exporting has causal link and these three
endogenous variables are economically interdependent. Similarly, Greenaway and Yu (2004)
investigated the reverse causality between productivity and exporting for UK chemical
However, Greenway and Yu (2004) study provided no empirical evidence related to
innovation. Very recently, Haidar (2012) conducted a study on Indian manufacturing using
unbalance panel data. Haidar found that productivity influence exporting but exporting does
not influence productivity. In other words, his study failed to provide evidence for
learning-by-exporting hypothesis.
To conclude, aforementioned studies provided mixed outcome regarding the reverse causality
between innovation, productivity and exporting. Similarly, the direction of causality is not
very clear and robust across several countries using micro level data. This study would revisit
the SS and LBE hypotheses by using a rich micro level data on 29 countries. This research
study has formed the basic research question. Does reverse causality exist between
innovation, productivity and exporting? This paper also adds to the empirical literature by
introducing an additional hypothesis i.e., innovation by exporting using the multiple proxies
of innovation.
3.1. Data Source
This empirical study has obtained cross sectional micro level data though the World Bank’s
enterprise survey. The survey has been jointly conducted in CEE and Eurasian economies by
the World Bank in cooperation with European Bank for Reconstruction and Development
(EBRD). Countries were surveyed in 2012 under the title of Business Environment and
Enterprise Performance Surveys (BEEPS), and the survey questions refer to fiscal year 2011.
The survey includes 15,883 observations from 29 countries in the Eurasian and CEE regions
(see Appendix 2). Over 90% questions are specifically designed to ask objectively about the
country business environment characteristics (e.g., infrastructure). The remaining questions
were design to measure the firms’ growth and obstacles to their business. Regarding sampling
procedure, a stratified random sample of firms were selected which were representative of a
country’s manufacturing and service sectors. Enterprise surveys usually are conducted in
cooperation with business organizations and government institutions. The data is collected
from business owners and top managers from formal (registered) firms with 5 or more
employees are targeted for interview.
The method of data collection is face-to-face interviews. The strength of the dataset is, it
provides micro level data on 29 countries using innovation, productivity and exporting
firms’ size, age, sales, exports, obstacles to the business and on innovation variables i.e.,
product and process innovation, R&D, marketing and organizational innovation. The
innovation variables were coded dummy 1 if firms’ were engaged in whether
product/process, R&D, marketing and organizational innovation, otherwise 0. Moreover,
information on costs of input variables such as fuel and electricity, raw material and
intermediate goods and labour costs allows this study to measure TFP (see Appendix A1).
The average numbers of employees are approximately 65 and the average age of the firms are
16 year.
3.2. Innovation, Productivity and Export Distribution – A Graphical Assessment
Prior to estimation, Figures 1 shows the graphical assessment of productivity difference
between exporters and non exporters. Productivity distributions for exporters and non
exporters are coincided. In addition, Figure 2-6 compares the productivity of innovators and
non innovators. The visual comparison indicates that productivity is higher for firms’ that are
engaged in product/process, R&D, organizational and marketing innovation. This indicates
that productivity for innovators have stochastic dominance over non-innovators. Moreover,
Figure 7-11 presents the visual comparison of exports distribution of innovators and non
innovators. Overall, Figure 7-11 implies that innovators are more likely to export than non
innovators. In other words, innovation (i.e., product/process, R&D, organizational and
marketing innovation) plays a vital role in the productivity and export performance. Figure 12
shows the productivity difference between foreign and domestic owned firms. The
productivity distribution is higher for foreign owned firms because they are superior in skills
and technology than domestic firms. To sum up, innovators firms’ have stochastic dominance
Further, Table 1 shows the total factor productivity (TFP) distribution of a various sample
groups. The TFP distribution of these sample groups are sub-divided into exporting and
non-exporting, product and non-product innovators, process and non-process innovators and so
forth. Two-sided Kolmogorov-Smirnov test is used to reject the null hypothesis of identical
distribution, alternatively it means that the TFP distribution of these sample groups have
inequality. To simplify the interpretation, rejecting the null hypothesis implies that TFP is
higher for exporters and innovators compared to non-exporters and non-innovators. From the
Table 1, it is clear that TFP is higher for exporters and innovators (product/process, RD, OI,
MI) which has rejected the null hypothesis, at 1% significance level. To conclude,
productivity of exporters and innovators has stochastic dominance over non exporters and
Table1: Two-Sample Kolmogorov-Smirnov Tests on the Distribution of TFP by Sub-Groups
Sub-Group Difference Favourable To:
TFP (Yes=1) TFP (No=0)
Exporting firms 0.0846*** -0.0021
Product Innovation 0.1026*** -0.0011 Process Innovation 0.1219*** -0.0009
R&D Firms 0.1527*** -0.0017
Organizational Innovation 0.1398*** -0.0001 Marketing Innovation 0.1318*** -0.0001
*** Denotes null hypothesis rejected at 1% significance level
3.3. Empirical Strategy
In order to analyze the SS and LBE hypotheses, this study has followed the empirical
strategies of Crepon, Duguet and Mairesse (1998); Viroj and Tavassoli (2014) and Baumann
and Kritikos (2016). Crepon, Duguet and Mairesse (1998) have initially developed a model
which is referred as CDM in the empirical literature. This model has corrected the selectivity
and simultaneity bias between R&D, innovation and productivity (see Crepon, Duguet and
Mairesse, 1998). They used four equations to estimate the R&D, innovation, productivity
relationship and the model was applied on French manufacturing firms using cross sectional
data. Later on, Viroj and Tavassoli (2014) modified the CDM model by including an
additional variable i.e., exporting and investigated the SS and LBE hypotheses on Swedish
firms. This study has followed the empirical strategy of Viroj and Tavassoli (2014) by using
micro level data on 29 countries. This empirical strategy corrects the selectivity, simultaneity
and endogeneity issues and estimates the SS and LBE hypotheses. Four equations have been
formulated as follows;
= + + (1)
= + + + + (2)
= + + + + (3)
Equation-1 investigates the firm decision to invest in innovation input ( ). This discrete
variable shows the combine effect of innovation inputs if firm’s engage either in R&D,
marketing and organizational innovation, while X are explanatory variables firm size, age
(are logged), obstacles to innovation3 and foreign owned firms (dummy coded 1 if firm’s is
foreign owned, otherwise 0). Equation-2 considers the dependent variable as product
innovation sales per employee ( ). In addition, the predicted value of innovation input
has been used as regressor and lagged one period for several reasons. First, to connect
equation-1 with equation-2 as part of the system of equations and second, predicted value of
innovation input is used as an instrumental variable to eliminate the potential endogeneity
and reverse causality with innovation output variable (see e.g., Viroj and Tavassoli, 2014). To
correct the selection bias, inverse Mills ratio (IMR) is used (see Heckman, 1979). The
problem of selection bias arises when innovative or exporting firms are not selected randomly
from a population or selected according to specific criteria i.e., usually occurs in surveys
because of self-selection rules: some respondents refuse to answer specific questions.
Equation-3 shows the determinants of total factor productivity (TFP). The predicted value of
innovation output (lagged one period) is used from the previous equation as an independent
variable. Further, export sale per employee (exp) is included to estimate the
learning-by-exporting hypothesis. For estimating the self-selection hypothesis, equation-4 has been
developed. In addition, firm earlier export experience (lagged one period) has been added as
an explanatory variable ( #), because this strategy would represent the firms’ past export
experience on the firm’s decision to export next year. Overall, this empirical model is
estimated in two stages. In the first stage: the selection equation i.e., innovation input and
innovation output equation have been estimated jointly, while in the second stage, the three
equations (2)-(4) have been estimated simultaneously using 3 stage-least-square (3SLS).
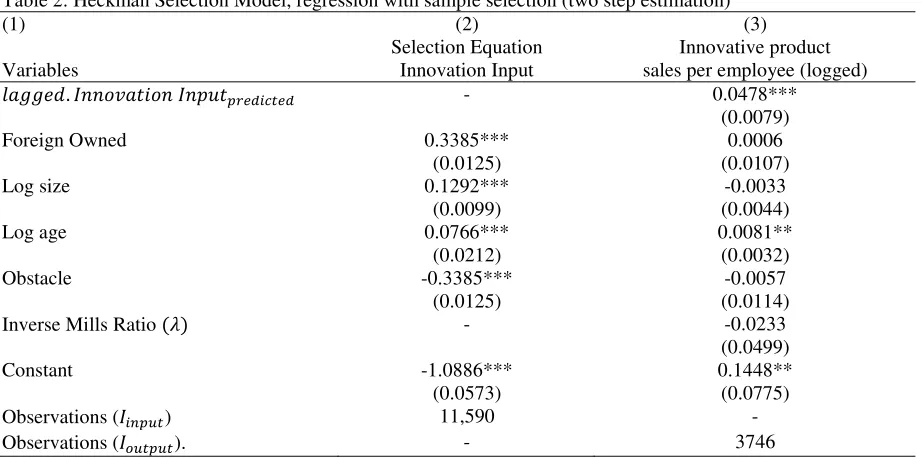
Table 2 provide information related to the selectivity bias using the simultaneously Heckman
selection model. The selection equation and the equation of interest are jointly estimated by
maximum likelihood (see Hill et al. 2007). This model jointly estimates the two equations by
using manximum likelihood method. Column 2 is the selection equation that determines the
3
variable of interest which is innovation input (as dependent variable). Foreign owned firms
are more likely to invest in innovation activities compared to domestic firms because of their
technological superiority and have better human capital. Similarly, large and older firms are
more likely to invest in innovation due to their economies of scale. In comarison, obstacles
reduce the firm’s decision to invest in innovation activities. In column 3 the dependent
variable is innovative product sale per employee. The predicted value of innovation input
from the previous period showed positive association to innovation output. This indicates
that past innovation input has a significant impact on the current innovation output. The
inverted Mills ratio is statistically insignificant and indicates that no selectivity bias is present
[image:13.595.71.532.306.535.2]in the least squares.
Table 2: Heckman Selection Model, regression with sample selection (two step estimation)
(1) (2) (3)
Selection Equation Innovative product Variables Innovation Input sales per employee (logged)
%&'' (. **+,&-.+* * /- 012 3 12 - 0.0478***
(0.0079) Foreign Owned 0.3385***
(0.0125)
0.0006 (0.0107)
Log size 0.1292***
(0.0099)
-0.0033 (0.0044)
Log age 0.0766***
(0.0212)
0.0081** (0.0032)
Obstacle -0.3385***
(0.0125)
-0.0057 (0.0114)
Inverse Mills Ratio (4) - -0.0233
(0.0499)
Constant -1.0886***
(0.0573)
0.1448** (0.0775)
Observations ( ) 11,590 -
Observations ( ). - 3746
Robust standard errors are in parentheses. ***p<0.01,**p<0.05,*p<0.1
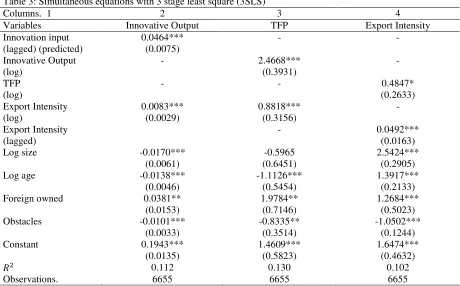
Table 3 reports the results of 3SLS using three equations (2)-(4). This method shows
maximum efficiency advantage over 2SLS by considering the correlations of the unobserved
factors between equations. This estimation procedure examines the SS and LBE hypotheses.
Innovation input positively influences the firm’s innovation output (see Column 2), while in
the next column innovation output present statistical relationship with productivity (TFP).
This outcome indicates that innovation has a positive impact on the firms’ productivity. To
investigate the SS hypothesis, 1% increase in productivity would likely to increase the
exports by 48% (see Column 4). This suggests that productivity significantly improve the
empirical studies of Cassiman and Golovoko (2007); Lopez (2009) and Caldera (2010). In
order to estimate the LBE hypothesis, 1% increases in export intensity the innovation output
is rise by 0.8%, while productivity is rise by 88% due to 1% increase in exports (see columns
2 & 3). Overall, this outcome indicates that exporting positively influence the firms’
innovation output and productivity. This outcome has accepted the LBE hypothesis. To
conclude, this empirical paper has supported the SS and LBE hypotheses for 29 countries
using firm level data. In other words, the paper has answered the research question that
is-reverse causality exists between innovation, productivity and exporting. Moreover, this
empirical study corrected the selectivity and simultaneity biases. Similarly, past export
experience has a positive impact on the firms’ next year export intensity. This suggests that
prior export experience significantly improve the firms’ current export decision (see Column
4). In other words, this finding has supported the sunk cost hypothesis (hysteresis effect)
which states that firms’ previous export performance would more likely to increase the next
year export performance.
Firms’ size, age and innovation output relationship suggests that small and younger firms
have a positive impact on the innovation output. In comparison, large and older firms are
more likely to export than small and younger firms because large and older firms have
sufficient resources (both financial and physical) to meet the sunk costs of entry into the
international markets, while small and younger firms can be innovative or productive but
prefer to stay in domestic markets due to less resources to face international competition.
Similarly, foreign owned firms are more innovative, productive and export oriented than
domestic firms’ due to their technological and skills superiority over local firms. Lastly,
obstacles negatively affect the innovative, productivity and export performance of these
firms. This outcome implies that removing barriers to trade may accelerate the global trade
between these countries. In the next sub section 3.4 the data is split into Eurasian and CEE
firms and examine the affect of innovation indicators separately on exporting. Previous
studies used few innovation indicators whether product or process innovation, but this
Table 3: Simultaneous equations with 3 stage least square (3SLS)
Columns. 1 2 3 4
Variables Innovative Output TFP Export Intensity Innovation input (lagged) (predicted) 0.0464*** (0.0075) - - Innovative Output (log)
- 2.4668*** (0.3931)
-
TFP (log)
- - 0.4847*
(0.2633) Export Intensity (log) 0.0083*** (0.0029) 0.8818*** (0.3156) - Export Intensity (lagged)
- 0.0492*** (0.0163) Log size -0.0170***
(0.0061)
-0.5965 (0.6451)
2.5424*** (0.2905) Log age -0.0138***
(0.0046)
-1.1126*** (0.5454)
1.3917*** (0.2133) Foreign owned 0.0381**
(0.0153)
1.9784** (0.7146)
1.2684*** (0.5023) Obstacles -0.0101***
(0.0033)
-0.8335** (0.3514)
-1.0502*** (0.1244) Constant 0.1943***
(0.0135)
1.4609*** (0.5823)
1.6474*** (0.4632)
0.112 0.130 0.102
Observations. 6655 6655 6655
Robust standard errors are in parentheses. ***p<0.01,**p<0.05,*p<0.1.
3.4. Eurasian and CEE: Innovation-by-Exporting Hypothesis
This sub section has analyzed the innovation by exporting hypothesis by splitting the micro
level data on Eurasian and CEE firms. These two major economic blocs have strong
historical, cultural and trade linkages. For example, CEE countries such as Bulgaria, Czech
Republic, Estonia, Hungry and Poland etc (EU members) and Eurasian economies such as
Albania, Armenia, Belarus, Turkey, Tajakistan and Russia have economic integration with
each other as well as with the rest part of the world.4 One the one hand, Turkey is member of
custom union (trade links with Western Europe) and also has economic ties with Eurasian
economies such as Uzbekistan, Tajikistan and Azerbaijan (see Ageliki and Ioannis, 2015,
Seker, 2005). On the other hand, Russia is a major supplier of hydro-carbon related products
to the European countries and an active member of Eurasian economies. Consequently,
economic growth is impressive in both Eurasian and CEE economies in recent years with
positive trends in human capital, employment rate including rising real wages, increasing
literacy rate and experienced decreasing in infant mortality rates (see Sprout and Murphy,
2006). Economic reforms are the major agenda for Eurasian and CEE countries to focus on
trade liberalization and better integration into the world economy. It is worth to mention that,
4
CEE economies have achieved a strategic position from democracy and international trade
(Bertarelli and Lodi, 2015) and foreign capital (FDI) is one of the major sources of
productivity growth and technological diffusion for CEE economies (Bijsterbosch and
Kolasa, 2010).
In spite of the trade links between Eurasian and CEE economies, Radosevic and Kravtsova
(2012) provided empirical evidence related to the low innovation and productivity
performance of CEE countries. They argued that inefficiencies exist within the broader
national innovation system of CEE countries. One the one hand, CEE economies are
struggling in terms of conversion of their R&D output into productivity due to low absorptive
capacity (low education and vocational training systems). On the other hand, global financial
and economic crisis in 2008-2009 which hit harder the CEE economies because CEE
economies went through negative GDP growth rate (-14%) and experienced massive
imbalances in current and public accounts (huge deficits); drop in real wages with double
digit unemployment rate (15%) (Kattel, 2010). Kattel (2010) study suggested that CEE
economies need to establish effective industrial and innovation policies to enhance their
domestic competitiveness through improving productivity and exports. In short, this
empirical study investigates the innovation-by-exporting hypothesis for Eurasian and CEE
firms. The estimation results would help policy makers to focus on improving the trade links
between these two economic blocs in terms of innovation and exporting performance.
3.4.1. Innovation by Exporting – 2SLS
In the past, innovation-by-exporting hypothesis is investigated by numerous researchers (e.g.,
Caldera, 2010; Monreal-Perez et al. 2011; Damijan et al. 2010; Lachenmaier and Wobmann,
2006; Crepon et al. 1998) and identified the endogenous link between innovation and
exporting using 2SLS method. A recent study by Imbriani et al. (2014) used multiple proxies
of innovation such as technological (product and process) and non-technological (marketing
and organizational innovation). They examined the positive association between innovation
and exporting by using a micro level data on Italian manufacturing SMEs. However, this
study is failed to address the endogenous link between innovation and exporting. While, this
study is focused on the endogenous relationship between innovation and exporting using
multiple proxies of innovation such as product and process innovation, R&D, marketing and
organizational innovation. Each proxy of innovation is estimated separately with exporting by
endogenous relation between innovation and exporting. For estimation, probit models have
been used to examine the Eurasian and CEE firms’ innovation and exporting performance. In
equation (a), innovation is endogenous variable, so using OLS method would result in biased
and inconsistent estimators. Thus, this study has used two instrumental variables which are
denoted by ‘z’ in equation (b). Here z represents formal training of permanent employees
and business support for innovation as instrumental variables in the model. The two
important characteristics of a valid instrument are that it should be strongly related to
endogenous explanatory variable – innovation in this case, while at the same time it must be
uncorrelated to the error term of the exports equation. Thus, training and business support are
reasonably exogenous to the error term and does not have direct effect on exports but could
have indirect effect through innovation. These two equations are estimated jointly through
2SLS method.
5 +6-7,9 = :+ **+,,9+ log ( > ) ,9+ ?,9+ #?@7-&A% 7,9+ B%+'C.D ,9
+ E%+'F' ,9+ GC A-+6,9+ H,9 (&) (17- 7-&' )
**+,,9 = :+ D,9+ %+' ( > ) ,9+ ?,9+ #?@7-&A% 7,9+ B%+'C.D ,9
+ E%+'F' ,9+ GC A-+6,9+ ,9 (@) (2*( 7-&' )
In aforementioned models, exports is a dummy variable and subscripts i, j show number of
observations and the type of industry. Similarly, innovation (Innov) is a dummy variable and
codified 1 if firms are engage in product/process innovation, R&D and organizational
innovation. Marketing innovation is merged with organizational innovation because
marketing innovation is a process of organizational innovation activities. Earlier empirical
studies (e.g., Banri and Ayumy, 2013; Halpern and Murakozy, 2012) have neglected to use
multiple proxies of innovation and this research study would fill that narrow research gap.
The total factor productivity (TFP) has been lagged for one period because it is assumed that
earlier productivity positively influences the firm’s decision to export and innovation in
current year. Lagging TFP for one period also overcome the potential endogeneity between
exporting and innovation (see e.g., Sharma and Mishra, 2012). Lopez (2009) argued that
highly productive firms self select into the export markets so that exporters can afford the
sunk costs of entry into foreign markets. Similarly, before exporting, firms’ require to
increase productivity in order to invest in innovation because exporters need to sell high
likely to export and innovate due to their technological superiority over domestic firms. Age,
firms’ size and obstacles are continuous variables. For sectoral comparison, an additional
dummy variable is introduced and it is codified 1 if firm belong to manufacturing sector
otherwise 0. Further, this study has split the micro level data into two economic blocs i.e.,
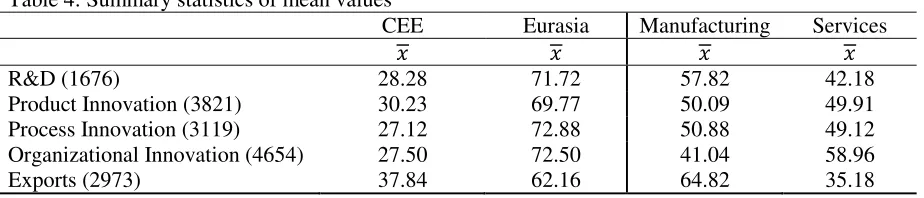
Eurasian and CEE (see Appendix A2). Before regression analysis, Table 4 shows the mean
values of CEE and Eurasin economies in terms of exporting and innovation. It is observed
that Eurasian economies have higher mean values compared to CEE countries. Overall, the
mean values for innovation and exporting is high for manufacturing sector (see Table 4).
Overall, Table 4 results suggest that Eurasian countries are dominant in terms of innovation
[image:18.595.68.530.307.406.2]activities and export performance.
Table 4: Summary statistics of mean values
CEE Eurasia Manufacturing Services
R&D (1676) 28.28 71.72 57.82 42.18
Product Innovation (3821) 30.23 69.77 50.09 49.91
Process Innovation (3119) 27.12 72.88 50.88 49.12
Organizational Innovation (4654) 27.50 72.50 41.04 58.96
Exports (2973) 37.84 62.16 64.82 35.18
Number of observations is in parentheses.
Furthermore, Table 5 presents the test of association between innovation and exporting
variables. Of the total 3821 product innovation firms, approximately 29% are involved in
exporting. The chi-square test value shows the statistical link between product innovation and
exporting. Nearly 27% of 3119 process innovators are engaged in exporting, while chi-square
test present the statistical relationship between process innovation and exporting. Overall,
Table 5 results provide the statistical evidence regarding the relationship between innovation
and exporting. This suggests that firms that are engaged in innovation are more likely to
[image:18.595.68.529.637.722.2]export than non innovators.
Table 5: Test of Association between innovation and exporting Exports (%)
Innovation Yes No Chi-square
Product Innovation (3821) 28.87 71.13 340.6056***
Process Innovation (3119) 27.32 72.68 188.5960***
R&D (1676) 38.90 61.10 501.7224***
Organizational Innovation (4654) 24.99 75.01 170.1584***
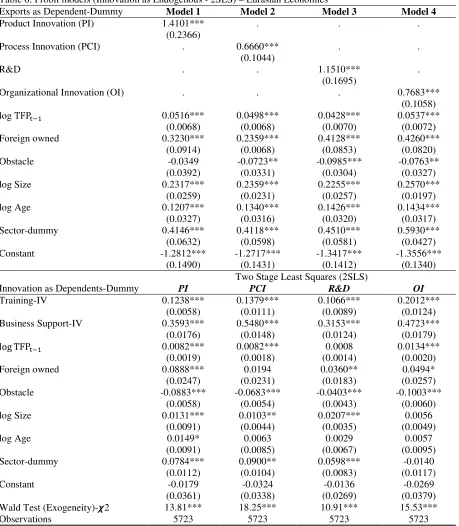
3.4.2. 2SLS Results
Table 6 reports the probit estimation results of equations (a)-(b) using 2SLS method for
Eurasian countries.5 Regarding the innovation and exporting link, all innovation indicators
whether product or process innovation, R&D and organizational innovation show statistical
association with exporting, at 1% significance level. This outcome suggests that innovation
drives firms’ exporting and supported the innovation-by-exporting hypothesis. This finding is
consistent with the Jose and Alvaro (2012) empirical study. Similarly, total factor
productivity (lagged one period) presents positive association with exporting. This implies
that firms require prior high productivity to export into the international markets. This result
is in line with empirical findings of Sharma and Mishra (2012) and Cassiman et al. (2010). In
other words, earlier productive firms are more likely to export because past productivity firms
can cover the sunk costs of entry into the foreign markets.
Similarly, foreign owned firms are more likely to export than domestic firms due to their
technological and skills superiority and have better contacts in the international markets.
Obstacles show negative relationship with exporting. This outcome indicates that trade
regulations, political instability and the lack of skilled labour force etc are more likely to
reduce the export performance of Eurasian firms. Large sized and older firms are more likely
to export than small or younger firms due to their economies of scale (experience in
technology) (see Imbriani et al. 2014). In addition, manufacturing sector is more likely to
undertake innovation activities. Furthermore, Table 6 shows the statistical association
between IVs and innovation (as dependents) (see bottom part of the Table 6). This indicates
that firms’ employees with formal training and business support positively affect the
innovation activities of Eurasian firms. Past productivity positively affects the innovation
activities. This suggests that high level of past productivity would encourage firms to
undertake innovation activities such as product and process innovation, R&D and
organizational innovation in the current year. Similarly, foreign owned firms are more likely
to undertake innovation activities than domestic firms. The remaining results are almost in
consistent with the first stage results. To summarize, for Eurasian firms’ innovation variables
significantly improve the export performance and supported the innovation-by-exporting
hypothesis.
5
Table 6: Probit models (Innovation as Endogenous - 2SLS) – Eurasian Economies
Exports as Dependent-Dummy Model 1 Model 2 Model 3 Model 4
Product Innovation (PI) 1.4101*** (0.2366)
. . .
Process Innovation (PCI) . 0.6660*** (0.1044)
. .
R&D . . 1.1510***
(0.1695)
.
Organizational Innovation (OI) . . . 0.7683*** (0.1058)
log TFPL> 0.0516***
(0.0068) 0.0498*** (0.0068) 0.0428*** (0.0070) 0.0537*** (0.0072) Foreign owned 0.3230***
(0.0914) 0.2359*** (0.0068) 0.4128*** (0.0853) 0.4260*** (0.0820)
Obstacle -0.0349
(0.0392) -0.0723** (0.0331) -0.0985*** (0.0304) -0.0763** (0.0327) log Size 0.2317***
(0.0259) 0.2359*** (0.0231) 0.2255*** (0.0257) 0.2570*** (0.0197) log Age 0.1207***
(0.0327) 0.1340*** (0.0316) 0.1426*** (0.0320) 0.1434*** (0.0317) Sector-dummy 0.4146***
(0.0632) 0.4118*** (0.0598) 0.4510*** (0.0581) 0.5930*** (0.0427) Constant -1.2812***
(0.1490) -1.2717*** (0.1431) -1.3417*** (0.1412) -1.3556*** (0.1340) Two Stage Least Squares (2SLS)
Innovation as Dependents-Dummy PI PCI R&D OI
Training-IV 0.1238*** (0.0058) 0.1379*** (0.0111) 0.1066*** (0.0089) 0.2012*** (0.0124) Business Support-IV 0.3593***
(0.0176) 0.5480*** (0.0148) 0.3153*** (0.0124) 0.4723*** (0.0179)
log TFPL> 0.0082***
(0.0019) 0.0082*** (0.0018) 0.0008 (0.0014) 0.0134*** (0.0020) Foreign owned 0.0888***
(0.0247) 0.0194 (0.0231) 0.0360** (0.0183) 0.0494* (0.0257) Obstacle -0.0883***
(0.0058) -0.0683*** (0.0054) -0.0403*** (0.0043) -0.1003*** (0.0060) log Size 0.0131***
(0.0091) 0.0103** (0.0044) 0.0207*** (0.0035) 0.0056 (0.0049)
log Age 0.0149*
(0.0091) 0.0063 (0.0085) 0.0029 (0.0067) 0.0057 (0.0095) Sector-dummy 0.0784***
(0.0112) 0.0900** (0.0104) 0.0598*** (0.0083) -0.0140 (0.0117)
Constant -0.0179
(0.0361) -0.0324 (0.0338) -0.0136 (0.0269) -0.0269 (0.0379) Wald Test (Exogeneity)-M2 13.81*** 18.25*** 10.91*** 15.53***
Observations 5723 5723 5723 5723
***,p<0.01;**,p<0.05;*,p<0.10 significance levels. Robust standard errors are in parentheses.
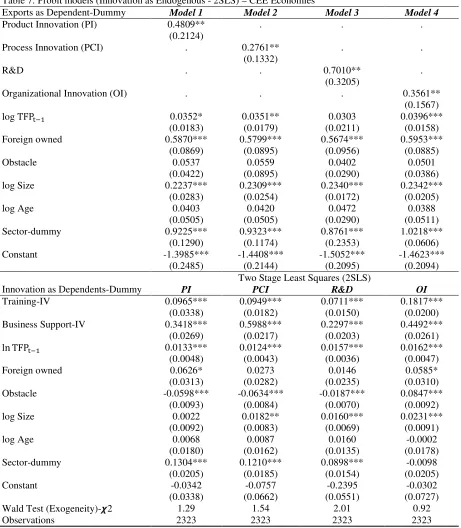
Additionally, Table 7 provides information on the endogenous link between innovation and
exporting for CEE firms. Firms that are engaged in product/process innovation, R&D and
organizational innovation are more likely to export than non innovators. This finding
indicates that 1% increase in product, process, R&D and organizational innovation, the
exports is rise by 48%, 27%, 70% and 35%. However, the coefficients values are lower
European countries (e.g., Germany, France) which are the major source of technological
innovation for CEE firms (see Radosevic and Kravtsova, 2012).
Previous year TFP (lagged one period) positively influences the next year exporting. This
outcome suggests that prior high productivity significantly improve the firm’s next year
exporting because it covers the sunk costs of entry into the international market. Similarly,
foreign owned are more likely to export than domestic firms due to high innovation and
human skills capacity than domestic firms. In comparison, obstacles show no statistical
relationship with exporting. This result may imply that CEE firms face no obstacle while
exporting to the nearest European markets. In addition, the positive relationship between size
and exporting show that large firms’ are more likely to export than small firms due to their
economies of scale. Manufacturing firms are more likely to export because of their
investment in technologies.
Furthermore, Table 6 presents the two stage results of equation (b). Instruments such as
training and business support show positive association with innovation proxies (as
dependent variables). Firms with high productivity in the previous period are more likely to
undertake innovation activities. In comparison, obstacles such as access to credit, trade
regulations, political instability negatively influence the innovation activities of CEE firms.
Large firms are more likely to engage in innovation activities (i.e., product/process, R&D and
organizational innovation) than small firms because of their low production cost. Lastly,
manufacturing sector has positive relationship with product/process innovation, R&D and
organizational innovation. Overall, the results of Table 7 are in line with the previous finding
from Table 6 findings. To summarize, this study has identified that innovation activities
Table 7: Probit models (Innovation as Endogenous - 2SLS) – CEE Economies
Exports as Dependent-Dummy Model 1 Model 2 Model 3 Model 4
Product Innovation (PI) 0.4809** (0.2124)
. . .
Process Innovation (PCI) . 0.2761** (0.1332)
. .
R&D . . 0.7010**
(0.3205)
.
Organizational Innovation (OI) . . . 0.3561** (0.1567)
log TFPL> 0.0352*
(0.0183) 0.0351** (0.0179) 0.0303 (0.0211) 0.0396*** (0.0158) Foreign owned 0.5870***
(0.0869) 0.5799*** (0.0895) 0.5674*** (0.0956) 0.5953*** (0.0885)
Obstacle 0.0537
(0.0422) 0.0559 (0.0895) 0.0402 (0.0290) 0.0501 (0.0386) log Size 0.2237***
(0.0283) 0.2309*** (0.0254) 0.2340*** (0.0172) 0.2342*** (0.0205)
log Age 0.0403
(0.0505) 0.0420 (0.0505) 0.0472 (0.0290) 0.0388 (0.0511) Sector-dummy 0.9225***
(0.1290) 0.9323*** (0.1174) 0.8761*** (0.2353) 1.0218*** (0.0606) Constant -1.3985***
(0.2485) -1.4408*** (0.2144) -1.5052*** (0.2095) -1.4623*** (0.2094) Two Stage Least Squares (2SLS)
Innovation as Dependents-Dummy PI PCI R&D OI
Training-IV 0.0965*** (0.0338) 0.0949*** (0.0182) 0.0711*** (0.0150) 0.1817*** (0.0200) Business Support-IV 0.3418***
(0.0269) 0.5988*** (0.0217) 0.2297*** (0.0203) 0.4492*** (0.0261)
ln TFPL> 0.0133***
(0.0048) 0.0124*** (0.0043) 0.0157*** (0.0036) 0.0162*** (0.0047) Foreign owned 0.0626*
(0.0313) 0.0273 (0.0282) 0.0146 (0.0235) 0.0585* (0.0310) Obstacle -0.0598***
(0.0093) -0.0634*** (0.0084) -0.0187*** (0.0070) 0.0847*** (0.0092)
log Size 0.0022
(0.0092) 0.0182** (0.0083) 0.0160*** (0.0069) 0.0231*** (0.0091)
log Age 0.0068
(0.0180) 0.0087 (0.0162) 0.0160 (0.0135) -0.0002 (0.0178) Sector-dummy 0.1304***
(0.0205) 0.1210*** (0.0185) 0.0898*** (0.0154) -0.0098 (0.0205)
Constant -0.0342
(0.0338) -0.0757 (0.0662) -0.2395 (0.0551) -0.0302 (0.0727) Wald Test (Exogeneity)-M2 1.29 1.54 2.01 0.92
Observations 2323 2323 2323 2323
***,p<0.01;**,p<0.05;*,p<0.10 significance levels. Robust standard errors are in parentheses.
4. Conclusion
This study has examined the self-selection and learning-by-exporting hypothesis for 29
countries using micro level data. Using the modified CDM (Crepon-Duguet-Mairesse) model,
this empirical paper supported the SS and LBE hypotheses. Results showed that productivity
significantly improve the firms’ exports, while innovative product sales enhance the firm’s
exports showed statistical link with productivity and accepted the learning-by-exporting
hypothesis. Moreover, the CDM model also corrected the selectivity and simultaneity biases.
To estimate the innovation by exporting hypothesis for Eurasian and CEE firms, the data was
divided into two economic blocs based on their geographical proximity. Previous studies
neglected to use multiple indicators of innovation and failed to examine the each proxy
(product/process, R&D and organizational innovation) of innovation separate on exporting.
Concerning the endogenous relationship between innovation and exporting, 2SLS method
was used. Overall, findings suggested that firms that were engaged in product or process
innovation, R&D and organizational innovation positively influence the firms’ exporting for
both Eurasian and CEE firms.
Empirical findings from this research study can be extended to other developing and
developed economies which are extensively contribute to the global trade. Economic policies
must target the economic integration between developing and developed countries. Through
learning-by-exporting experience, firms in poor countries can learn about the technological
and non technological innovation in the industrialized countries. Economic policies regarding
openness to trade result in high productivity and innovation performance of domestic firms.
Specifically, foreign direct investment could be a major source of innovation and productivity
growth for local firms because foreign firms are superior in technology and in human capital.
By establishing the forward and backward linkages with foreign firms, domestic firms can
overcome the innovation, productivity and exporting constraints. The SS hypothesis also
indicates that before exporting, firms require a certain minimum threshold of innovation
investment and productivity growth and that is only possible when economic policies are
specifically targeted to improve the absorptive capacity (innovation investment) of local
firms. With low absorptive capacity, domestic firms cannot benefit from the positive
externalities of foreign direct investment.
This study has certain limitations. The use of cross section data on 29 countries may not
capture the long terms effects using innovation, productivity and exporting variables. Past
studies mainly used panel data and estimated the SS and LBE hypothesis. In future, a panel
study would better investigate the economic relationships between innovation, productivity
and exporting variables. Further, due to the lack of information on price indices for each
References:
Ageliki, Anagnostou; Ioannis, Panteladis (2015). Eurasian Orientation and Global Trade Intregration: The Case of Turkey. Eurasian Economic Review, (1), 15-38.
Antonielli, Roberto; Cainelli, Guilio (2010). Innovation, Productivity and Export: Evidence from Italy. University of Trento, WP No.(17), 1-20.
Alvarez, Roberto; Lopez A. Ricardo (2005). Exporting and Performance: Evidence from Chilean Plants. Canadian Journal of Economics, 38(4), 1384-1400.
Banri, ITO; Ayumu, Tanaka (2013). Open Innovation, Productivity, and Export: Evidence from Japanese Firms, RIETI, Japan, Discussion Paper No. 13-E-006, 1-27.
Baumann, Julian; Kritikos S. Alexander (2016). The Link between R&D, Innovation and
Productivity: Are Micro Firms Different? IZA Discussion Paper No. 9374, University of Potsdam, 1-44.
Bell, J. MacNaughten, R., Young. S. and Crick, D. (2003). Towards an Integrative Model of Small Firm Internationalisation. Journal of International Entrepreneurship 1(4), 339-362.
Bertarelli, Silvia; Lodi, Chiara (2015). Innovation and Exporting: A Case Study on Eastern European Firms. Universita Degli Studi Di Ferrara, Ferrara, WP, No, 10(4), 1-26.
Bijsterbosch, Martin; Kolasa, Marcin (2010). FDI and Productivity Convergence in Central and Eastern Europe: An Industry level Investigation. Review of World Economy, 145(1), 689-712.
Caldera, Aida (2010). Innovation and Exporting: Evidence from Spanish Manufacturing Firms. Review of World Economy, 146(1), 657-689.
Cassiman, Bruno; Golovko, Elena; Martinez-Ros, Ester (2010). Innovation, Exports and Productivity. International Journal of Industrial Organization, 28, 372-376.
Cassiman, Bruno; Golovoko, Elena (2007). Innovation and the Export-Productivity Link, WP, No. 688, University of Navarra, IESE Business School, 1-25.
Claudio Bravo-Ortega, Jose, Miguel Benavente; Alvaro Gonzales (2014). Innovation, Exports, and Productivity, Learning and Self-Selection in Chile. Emerging Markets Finance and Trade, 50(1), 68-95.
Castellani, D. (2002). Export Behaviour and Productivity Growth: Evidence from Italian Manufacturing Firms. Journal of Weltwirtschaftliches Archive. 138(4), 605-628.
Crepon, B, Duguet; E., and Mairesse J. (1998). Research Investment, Innovation, and Productivity: An Econometric Analysis, Economics of Innovation New Technology, 7(2), 115-158.
Damijan P. Joze; Kostevc, Crt; Polanec, Saso (2010). From Innovation to Exporting or Vice Versa. The World Economy, 1, 374-398.
Faustino, C. Horacio; Matos, V. Pedro (2015). Exports, Productivity and Innovation: New Firm Level Empirical Evidence. Applied Economics, 47(46), 4918-4933.
Greenaway, David; Yu, Zhihong (2004). Firm-Level Interaction between Exporting and Productivity: Industry-Specific Evidence. Review of World Economics, 140(3), 376-392.
Haidar, Ibrahim, Jamal (2012). Trade and Productivity: Self-Selection or Learning-by-Exporting in India. Economic Modelling, 29,1766-1773.
Harris, Richard; Li, Cher, Qian (2008). Evaluating the Contribution of Exporting to UK
Productivity Growth: Some Microeconomic Evidence. The World Economy, 1, 212-235.
Harris, Richard; Moffat, John (2011). R&D, Innovation and Exporting. SERC Discussion Paper, No. 73, University of Glasgow, 1-55.
Heckman, J. (1979). Sample Selection Bias as Specification Error. Econometrica, 47(1), 153-161.
Hill, R. Carter; Griffiths E. William; Lim C. Guay (2007). Principles of Econometrics, 3rd Ed. John Wiley & Sons, USA, 447-450.
Imbriani, Cesar; Morone, P. Testa, Giuseppina (2014). Innovation, Quality and Exports: The Case of Italian SMEs. The Journal of International Trade & Economic Development, 23(8), 1089-1111.
Johanson, J. and Vahlne, E-J., (1977). The Internationalization Process of the Firm-A Model of Knowledge Development and Increasing Foreign Market Commitments. Journal of International Business Studies, 8(1), 23-32.
Kattel, Rainer (2010). Financial and Economic Crisis in Eastern Europe. Journal of Post Keynesian Economics, 33(1), 41-60.
Lachenmaier, Stefan; Wobmann, Ludger (2006). Does Innovation Cause Export? Evidence from Exogenous Innovation Impulses and Obstacles using German Micro Data, Oxford Exconomic Papers, 58, 317-350.
Laszlo, Halpern; Murakozy, Balazs (2012). Innovation, Productivity and Exports: The Case of Hungary. Economics of Innovation and New Technology, 21(2), 151-173.
Liargovas, Panagiotis (2013). EU trade policies towards neighbouring countries. Working Paper No. 2/01, University of Peloponnese, 1-27.
Lopez, A. Ricardo (2009). Do Firms Increase Productivity in Order to Become Exporters? Oxford Bulletin of Economics and Statistics, 71(5), 0305-9049.
Lu, W. J. and Beamish W. P. (2006). SME internationalization and performance: Growth vs. profitability. Journal of International Entrepreneurship 4(1), 27-48.
Manez-Castillejo, A. Juan; Rochina-Barrachina E. Maria., (2009). Self Selection into Exports: Productivity and/or Innovation? Conference Paper, Universitat de Valencia, 1-32.
Masso, Jaan; Vahter, Priit (2011). The Link between Innovation and Productivity in Estonia’s Services Sector. The Service Industries Journal, 36(12), 2527-2541.
Monreal-Perez, Joaquin; Aragon-Sanchez, Antonio; Sanchez-Marin, Gregoio (2011). A Longitudinal Study of the Relationship between Export Activity and Innovation in the Spanish Firm: The Moderating role of Productivity. International Business Review, 1-16.
Movahedi, Mohammad; Gaussens, Olivier (2011). Innovation, Productivity, and Export: Evidence from SMEs in Lower Normandy, France. WP, 40443. 1-15.
Radosevic, Salvo; Kravtsova, Victoria (2012). Are Systems of Innovation in Central and Eastern Europe Inefficient? Economic Systems, 36(1), 109-126.
Reddy, M. (2007). Small business in small economies: constraints and opportunities for growth,Social and Economic Studies, 56(1), 304-321.
Seker, Murat (2010). Trade Performance in Eastern Europe and Central Asia, Enterprise Surveys, Enterprise Note Series, World Bank Group, Enterprise Note No. 19, 1-5.
Sharma, Chandan; Mishra, Kumar, Ritesh (2012). Export Participation and Productivity Performance of Firms in the Indian Transport Manufacturing, Journal of Manufacturing Technology Management, 23(3), 351-369.
Sprout, Ron; Murphy, Robyn (2006). Monitoring Country Progress in Eastern Europe and Eurasia, Working Paper, No.4, USAID, Washington DC, 1-50.
Trofimenko, Natalia (2008). Learning-by-Exporting: Does it Matter Where One Learns? Evidence from Colombian Manufacturing Firms. Economic Development and Cultural Change, 54(4), 871-894.
Viroj, Jienwatcharamongkhol; Tavassoli, Sam, (2014). Closing the Gap: An Empirical Evidence on Firm’s Innovation, Productivity, and Export, Working Paper, 2014/6. Department of Economics, Lund University, Sweden, 1-29.
Appendix A1. Measuring Productivity
This study has estimated total factor productivity (TFP) using firm level data on Eastern European countries. The model described by a Cobb-Douglas production function of the following form where all variables are used in natural logarithms:
O = + % + P + Q + R (1)
Where y, l,m and k refer to the output, labour, intermediate inputs (materials, fuel and electricity costs) and capital (fixed assets). Hence, TFP in growth terms is defined as (dropping subscripts).
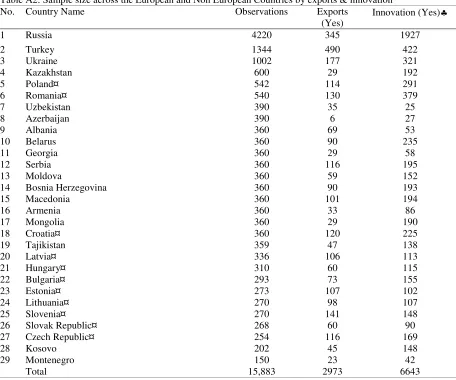
Appendix A2.
Table A2: Sample size across the European and Non European Countries by exports & innovation No. Country Name Observations Exports
(Yes)
Innovation (Yes)♣
1 Russia 4220 345 1927
2 Turkey 1344 490 422
3 Ukraine 1002 177 321
4 Kazakhstan 600 29 192
5 Poland¤ 542 114 291
6 Romania¤ 540 130 379
7 Uzbekistan 390 35 25
8 Azerbaijan 390 6 27
9 Albania 360 69 53
10 Belarus 360 90 235
11 Georgia 360 29 58
12 Serbia 360 116 195
13 Moldova 360 59 152
14 Bosnia Herzegovina 360 90 193
15 Macedonia 360 101 194
16 Armenia 360 33 86
17 Mongolia 360 29 190
18 Croatia¤ 360 120 225
19 Tajikistan 359 47 138
20 Latvia¤ 336 106 113
21 Hungary¤ 310 60 115
22 Bulgaria¤ 293 73 155
23 Estonia¤ 273 107 102
24 Lithuania¤ 270 98 107
25 Slovenia¤ 270 141 148
26 Slovak Republic¤ 268 60 90
27 Czech Republic¤ 254 116 169
28 Kosovo 202 45 148
29 Montenegro 150 23 42
Total 15,883 2973 6643
♣Indicates that country engaged at least in one innovation activity (i.e., product, process, RD and OI)
¤ Represent the European Union (EU) member states and most of them are CEE economies. The rest of the countries are treated as Eurasian economies which are not the members of EU.
Appendix A3.
Table A3. Principal component factor analysis of obstacles
Obstacles Factor Loadings
Access to finance 0.5896
Competition 0.4743
Trade regulations 0.5505
Taxation 0.6197
Political instability 0.6008
Inadequate skilled labour force 0.6298
Labour regulations 0.5938
Telecommunication 0.5446
[image:27.595.67.539.621.738.2]Appendix A4: Correlation matrix
A4:Correlation matrix of all variables
no Variables 1 2 3 4 5 6 7 8 9 10 11 1 Exports-dummy 1
2 TFP 0.05 1 3 Size(log) 0.26 0.41 1
4 Age(log) 0.13 0.07 0.25 1
5 Foreign owned 0.15 0.10 0.14 -0.02 1
6 Obstacles 0.13 0.01 0.07 0.05 0.01 1 7 Product Innovation 0.16 0.08 0.11 0.06 0.07 0.21 1 8 Process Innovation 0.12 0.10 0.12 0.05 0.04 0.20 0.41 1 9 RD 0.20 0.09 0.15 0.06 0.05 0.14 0.33 0.33 1 10 Org. Innovation 0.11 0.13 0.14 0.05 0.07 0.25 0.42 0.45 0.32 1 11 Innovative sales♣ 0.05 0.80 0.02 -0.03 0.04 -0.02 0.03 0.04 0.02 0.06 1